
PUBLISHER: MarketsandMarkets | PRODUCT CODE: 1781106

PUBLISHER: MarketsandMarkets | PRODUCT CODE: 1781106
Automated Border Control Market by Solution Type (E-gates, Kiosks), Component Type [Hardware (Document Verification, Biometrics (Facial, Iris Recognition)), Software, Services], Application (Airports, Seaports, Land Ports) - Global Forecast to 2030
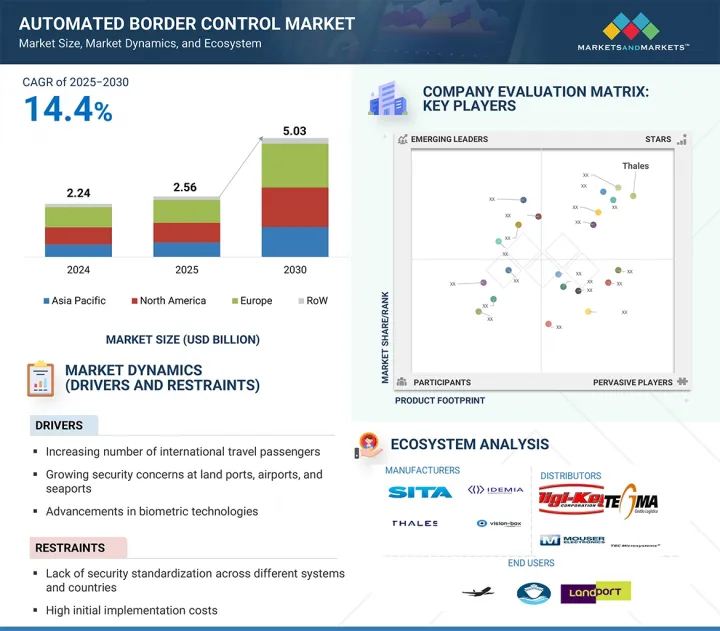
The automated border control market is projected to grow from USD 2.56 billion in 2025 to USD 5.03 billion by 2030, growing at a CAGR of 14.4% from 2025 to 2030. One of the primary drivers is the sharp increase in international passenger traffic, which has put immense pressure on border control authorities to process travelers more efficiently without compromising security. Airports, seaports, and land borders increasingly turn to automated solutions, such as eGates and biometric kiosks, to reduce congestion and waiting times.
| Scope of the Report | |
|---|---|
| Years Considered for the Study | 2021-2030 |
| Base Year | 2024 |
| Forecast Period | 2025-2030 |
| Units Considered | Value (USD Billion) |
| Segments | By Solution Type, Component Type, Application, and Region |
| Regions covered | North America, Europe, APAC, RoW |
The growing need for contactless and hygienic border procedures, especially in the aftermath of COVID-19, has significantly accelerated the adoption of ABC systems. Biometric technologies-facial recognition, fingerprint, and iris scanning-offer secure and fast identity verification, aligning with health and security protocols. Government mandates and regulatory frameworks, such as the European Union's Entry/Exit System (EES) and ICAO's TRIP strategy, also push countries to modernize their border infrastructure. At the same time, the high cost of manual processing and global staff shortages make automation a more attractive and cost-efficient option. In addition, technological advancements and support from vendors such as IDEMIA, Thales, and Vision-Box, along with smart airport and smart border initiatives, drive the market. These combined factors make the automated border control market a critical component of next-generation border security and travel efficiency.
"Hardware segment is expected to record a significant CAGR in the automated border market from 2025 to 2030."
The hardware segment is expected to witness the highest CAGR during the forecast period due to the physical infrastructure requirements involved in automating border crossing points. Key hardware components include eGates, biometric scanners (facial, fingerprint, and iris), passport readers, surveillance cameras, and integrated kiosks for processing travelers efficiently and securely. As global passenger traffic rebounds, countries are accelerating investments in automated border control (ABC) hardware to reduce congestion and enhance security. For instance, in July 2024, Mumbai's Chhatrapati Shivaji Maharaj International Airport deployed 68 new eGates, becoming India's largest automated immigration setup. Similarly, the US expanded biometric hardware deployment at over 50 airports, including high-traffic terminals at Miami, Dallas, and Atlanta, significantly reducing processing times. Additionally, land and seaports are integrating hardware systems such as vehicle scanners and biometric booths, with Europe and North America leading in adoption. The EU-funded Smart Borders Initiative is deploying hardware-heavy ABC systems across Schengen countries, especially at major airports like Frankfurt and Paris-CDG. The increasing need for secure, contactless, faster border control solutions pushes governments and airport authorities to prioritize hardware installations. With high capital expenditure and lifecycle replacements, hardware remains the core revenue-generating segment in the ABC market.
"Seaports segment is projected to hold a commendable share of the automated border market from 2025 to 2030."
The seaport segment is emerging as a considerable contributor to the automated border control market, driven by increasing passenger volumes, the need for faster processing, and enhanced maritime security. International seaports and ferry terminals, particularly in high-traffic regions, are adopting ABC systems to manage growing traveler flows. A notable example is Indonesia's Batam Center, where five major seaports collectively handle around 500,000 passengers annually. In 2024, Indonesian immigration authorities implemented HID Global's Autogate system at these ports, integrating ATOM passport readers with facial recognition cameras. This deployment significantly reduced border processing times, improved passenger throughput, and connected to international security databases like Interpol for real-time threat detection. Following this, authorities reported shorter queues and greater operational efficiency. Globally, the seaport segment is now recognized as the second-fastest growing area in the market, as increasing maritime travel and cargo movement heighten the demand for secure, automated border control. The introduction of advanced technologies such as on-device AI, liveness detection, and multispectral biometric imaging has enabled seamless implementation at seaports. These developments, coupled with successful pilot projects and government support, underscore the growing importance of the seaport segment in the global automated border control market.
"Europe contributed largest share of automated border control market in 2024."
Europe is set to contribute a significant share to the automated border control market in 2024, driven by robust infrastructure, regulatory initiatives, and widespread adoption of biometric systems. A major catalyst is the European Union's upcoming Entry/Exit System (EES), scheduled to launch in October 2025. The EES will require non-EU travelers to register biometric data, such as facial images and fingerprints, at self-service kiosks across all Schengen borders, leading to a rapid increase in ABC deployments. Airports across Europe are expanding their capabilities in anticipation of this shift. For instance, Frankfurt Airport boosted its eGate capacity by 40% in 2023 to manage over 70 million passengers annually, while France's major airports, including Nice, CDG, Orly, and Marseille, have rolled out facial recognition eGates under the PARAFE system. Additionally, manufacturers such as Vision-Box, IDEMIA, Thales, and Secunet are securing contracts with European airport authorities, enhancing regional ABC infrastructure. Security concerns related to illegal migration and overstays are also pushing adoption. Pilot programs in countries such as Germany and Croatia have reduced undocumented overstays by 40%. Despite some delays in EES rollout due to technical challenges in countries such as Germany and the Netherlands, phased implementation is underway, positioning Europe as a global leader in the market.
- By Company Type: Tier 1 - 40%, Tier 2 - 35%, and Tier 3 - 25%
- By Designation: C-level Executives - 35%, Managers -45%, and Others - 20%
- By Region: North America -25%, Europe - 40%, Asia Pacific- 25%, and RoW - 10%
Prominent players profiled in this report include Thales (France), Secunet Security Networks AG (Germany), IDEMIA (France), and SITA (Switzerland).
Report Coverage
The report defines, describes, and forecasts the automated border control market based on solution type (e-gates, kiosks), component type (hardware, software, services), application (airports, seaports, land ports), and region (North America, Europe, Asia Pacific, and RoW. It provides detailed information regarding drivers, restraints, opportunities, and challenges influencing the market growth. It also analyzes competitive developments such as acquisitions, product launches, expansions, and actions carried out by the key players to grow in the market.
Reasons to Buy This Report
The report will help the market leaders/new entrants with information on the closest approximations of the revenue for the overall automated border control market and the subsegments. The report will help stakeholders understand the competitive landscape and gain more insight to position their business better and plan suitable go-to-market strategies. The report also helps stakeholders understand the market's pulse and provides information on key drivers, restraints, opportunities, and challenges.
The report will provide insights into the following points:
- Analysis of key drivers (increasing number of international passengers traveling across borders; growing security concerns at land ports, airports, and seaports; advancements in biometrics), restraints (lack of security standardization across different systems and countries; high initial implementation cost for automated border control systems), opportunities (growing implementation of digital ID verification systems by governments and transportation organizations; rising integration of artificial intelligence in automated border control systems), and challenges (increasing risks of cyberattacks) in the automated border control market
- Product development /Innovation: Detailed insights into upcoming technologies, research & development activities, and new product launches in the automated border control market
- Market Development: Comprehensive information about lucrative markets; the report analyses the automated border control market across various regions
- Market Diversification: Exhaustive information about new products launched, untapped geographies, recent developments, and investments in the automated border control market
- Competitive Assessment: In-depth assessment of market share, growth strategies, and offering of leading players, including Thales (France), Secunet Security Networks AG (Germany), IDEMIA (France), NEC Corporation (Japan), and SITA (Switzerland) in the automated border control market
TABLE OF CONTENTS
1 INTRODUCTION
- 1.1 STUDY OBJECTIVES
- 1.2 MARKET DEFINITION
- 1.3 STUDY SCOPE
- 1.3.1 MARKETS COVERED AND REGIONAL SCOPE
- 1.3.2 YEARS CONSIDERED
- 1.3.3 INCLUSIONS AND EXCLUSIONS
- 1.4 CURRENCY CONSIDERED
- 1.5 UNIT CONSIDERED
- 1.6 LIMITATIONS
- 1.7 STAKEHOLDERS
- 1.8 SUMMARY OF CHANGES
2 RESEARCH METHODOLOGY
- 2.1 RESEARCH DATA
- 2.1.1 SECONDARY AND PRIMARY RESEARCH
- 2.1.2 SECONDARY DATA
- 2.1.2.1 Major secondary sources
- 2.1.2.2 Key data from secondary sources
- 2.1.3 PRIMARY DATA
- 2.1.3.1 Primary interviews with experts
- 2.1.3.2 Key data from primary sources
- 2.1.3.3 Key industry insights
- 2.1.3.4 Breakdown of primaries
- 2.2 MARKET SIZE ESTIMATION
- 2.2.1 BOTTOM-UP APPROACH
- 2.2.1.1 Approach to arrive at market size using bottom-up analysis
- 2.2.2 TOP-DOWN APPROACH
- 2.2.2.1 Approach to arrive at market size using top-down analysis
- 2.2.1 BOTTOM-UP APPROACH
- 2.3 DATA TRIANGULATION
- 2.4 RESEARCH ASSUMPTIONS
- 2.5 RESEARCH LIMITATIONS
- 2.6 RISK ANALYSIS
3 EXECUTIVE SUMMARY
4 PREMIUM INSIGHTS
- 4.1 ATTRACTIVE GROWTH OPPORTUNITIES IN AUTOMATED BORDER CONTROL MARKET
- 4.2 AUTOMATED BORDER CONTROL MARKET, BY SOLUTION TYPE
- 4.3 AUTOMATED BORDER CONTROL MARKET, BY OFFERING
- 4.4 AUTOMATED BORDER CONTROL MARKET, BY APPLICATION
- 4.5 AUTOMATED BORDER CONTROL MARKET, BY REGION
5 MARKET OVERVIEW
- 5.1 INTRODUCTION
- 5.2 MARKET DYNAMICS
- 5.2.1 DRIVERS
- 5.2.1.1 Increasing number of international passengers traveling across borders
- 5.2.1.2 Growing security concerns at land ports, airports, and seaports
- 5.2.1.3 Ongoing advancements in biometric technologies
- 5.2.2 RESTRAINTS
- 5.2.2.1 Inconsistent security protocols across jurisdictions
- 5.2.2.2 Limited adoption in emerging economies due to substantial setup and maintenance costs
- 5.2.3 OPPORTUNITIES
- 5.2.3.1 Growing implementation of digital ID verification systems by governments and transportation organizations
- 5.2.3.2 Rising integration of artificial intelligence in automated border control systems
- 5.2.4 CHALLENGES
- 5.2.4.1 Vulnerability to cyber threats
- 5.2.1 DRIVERS
- 5.3 SUPPLY CHAIN ANALYSIS
- 5.4 ECOSYSTEM ANALYSIS
- 5.5 PRICING ANALYSIS
- 5.5.1 PRICING RANGE OF AUTOMATED BORDER CONTROL SYSTEMS PROVIDED BY KEY PLAYERS, BY SOLUTION TYPE, 2024
- 5.5.2 PRICING RANGE OF AUTOMATED BORDER CONTROL SYSTEMS, BY SOLUTION TYPE, 2024
- 5.6 TRENDS/DISRUPTIONS IMPACTING CUSTOMER BUSINESS
- 5.7 TECHNOLOGY ANALYSIS
- 5.7.1 KEY TECHNOLOGIES
- 5.7.1.1 Artificial intelligence
- 5.7.1.2 Internet of Things
- 5.7.2 ADJACENT TECHNOLOGIES
- 5.7.2.1 Blockchain technology
- 5.7.3 COMPLIMENTARY TECHNOLOGIES
- 5.7.3.1 Biometrics technology
- 5.7.1 KEY TECHNOLOGIES
- 5.8 PORTER'S FIVE FORCES ANALYSIS
- 5.8.1 BARGAINING POWER OF SUPPLIERS
- 5.8.2 BARGAINING POWER OF BUYERS
- 5.8.3 THREAT OF NEW ENTRANTS
- 5.8.4 THREAT OF SUBSTITUTES
- 5.8.5 INTENSITY OF COMPETITIVE RIVALRY
- 5.9 KEY STAKEHOLDERS AND BUYING CRITERIA
- 5.9.1 KEY STAKEHOLDERS IN BUYING PROCESS
- 5.9.2 BUYING CRITERIA
- 5.10 CASE STUDY ANALYSIS
- 5.10.1 NIGERIA'S SMART AIRPORT INITIATIVE: COMBATING IDENTITY FRAUD THROUGH IDEMIA'S BIOMETRIC SOLUTION
- 5.10.2 SOUTH AFRICA'S SMART AIRPORT REVOLUTION: ELIMINATING QUEUES THROUGH VISION-BOX'S AI-POWERED BORDER CONTROL SOLUTION
- 5.10.3 INDIA'S SMART AIRPORT TRANSFORMATION: CUTTING IMMIGRATION TIME BY 73% THROUGH THALES GROUP'S AI-POWERED E-GATES
- 5.10.4 SULAYMANIYAH'S BORDER SECURITY REVOLUTION: ELIMINATING 20-MINUTE DELAYS THROUGH M2SYS' BIOMETRIC INNOVATION
- 5.10.5 PHILADELPHIA'S SMART AIRPORT INNOVATION: REVOLUTIONIZING US EXIT IMMIGRATION THROUGH SITA'S BIOMETRIC TECHNOLOGY
- 5.11 TRADE ANALYSIS
- 5.12 PATENT ANALYSIS
- 5.13 KEY CONFERENCES AND EVENTS, 2025-2026
- 5.14 REGULATORY LANDSCAPE
- 5.14.1 REGULATORY BODIES, GOVERNMENT AGENCIES, AND OTHER ORGANIZATIONS
- 5.14.2 STANDARDS AND REGULATIONS
6 AUTOMATED PROCEDURES FOR BORDER CROSSING
- 6.1 INTRODUCTION
- 6.2 ONE-STEP PROCESS
- 6.3 INTEGRATED TWO-STEP PROCESS
- 6.4 SEGREGATED TWO-STEP PROCESS
7 AUTOMATED BORDER CONTROL MARKET, BY SOLUTION TYPE
- 7.1 INTRODUCTION
- 7.2 ABC E-GATES
- 7.2.1 RISING ADOPTION OF ABC E-GATES AT AIRPORTS FOR GREATER SECURITY TO DRIVE MARKET
- 7.2.1.1 Automated boarding e-gates
- 7.2.1.2 Security checkpoint e-gates
- 7.2.1 RISING ADOPTION OF ABC E-GATES AT AIRPORTS FOR GREATER SECURITY TO DRIVE MARKET
- 7.3 ABC KIOSKS
- 7.3.1 URGENT NEED FOR FAST, EFFICIENT, AND SECURE BORDER CROSSING PROCESSES TO SUPPORT MARKET GROWTH
8 AUTOMATED BORDER CONTROL MARKET, BY OFFERING
- 8.1 INTRODUCTION
- 8.2 HARDWARE
- 8.2.1 RISING DEMAND FOR ENHANCED BORDER SECURITY TO ACCELERATE SEGMENTAL GROWTH
- 8.2.1.1 Document authentication system
- 8.2.1.1.1 Optical character recognition solution
- 8.2.1.1.2 Barcode reader
- 8.2.1.1.3 Signature scanner
- 8.2.1.2 Biometric verification system
- 8.2.1.2.1 Face recognition solution
- 8.2.1.2.2 Fingerprint recognition solution
- 8.2.1.2.3 Iris recognition system
- 8.2.1.2.4 Other biometric verification systems
- 8.2.1.3 Baggage scanner
- 8.2.1.3.1 RFID tags
- 8.2.1.4 Digital ID verification system
- 8.2.1.1 Document authentication system
- 8.2.1 RISING DEMAND FOR ENHANCED BORDER SECURITY TO ACCELERATE SEGMENTAL GROWTH
- 8.3 SOFTWARE
- 8.3.1 PRESSING NEED FOR REAL-TIME DECISION-MAKING AT BORDER CONTROL TO ACCELERATE DEMAND
- 8.4 SERVICES
- 8.4.1 INSTALLATION
- 8.4.1.1 Necessity to address regulatory compliance requirements to support demand
- 8.4.2 MAINTENANCE
- 8.4.2.1 Significant focus on preventive maintenance to spike demand
- 8.4.1 INSTALLATION
9 AUTOMATED BORDER CONTROL MARKET, BY APPLICATION
- 9.1 INTRODUCTION
- 9.2 AIRPORTS
- 9.2.1 RISING NUMBER OF INTERNATIONAL TRAVELERS TO SURGE DEMAND
- 9.3 SEAPORTS
- 9.3.1 NECESSITY TO FACILITATE SMOOTH MOVEMENT OF GOODS AND PASSENGERS TO SPIKE DEMAND
- 9.4 LAND PORTS
- 9.4.1 NEED TO DETECT FORGED OR TAMPERED DOCUMENTS TO INCREASE ADOPTION
10 AUTOMATED BORDER CONTROL MARKET, BY REGION
- 10.1 INTRODUCTION
- 10.2 NORTH AMERICA
- 10.2.1 MACROECONOMIC OUTLOOK FOR NORTH AMERICA
- 10.2.2 US
- 10.2.2.1 Significant focus on expediting immigration process, reducing wait times, and improving overall traveler experience to stimulate adoption
- 10.2.3 CANADA
- 10.2.3.1 Elevating deployment of e-gates at airports to propel market
- 10.2.4 MEXICO
- 10.2.4.1 Substantial increase in border traffic to drive demand
- 10.3 EUROPE
- 10.3.1 MACROECONOMIC OUTLOOK FOR EUROPE
- 10.3.2 GERMANY
- 10.3.2.1 Release of EasyPASS-RTP program to fuel market growth
- 10.3.3 UK
- 10.3.3.1 Expansion of e-passport gates to foster market growth
- 10.3.4 FRANCE
- 10.3.4.1 Passport verification program by government to faster market growth
- 10.3.5 ITALY
- 10.3.5.1 Surging security threats with growing number of irregular migrants to elevate demand
- 10.3.6 SPAIN
- 10.3.6.1 Early adoption of EU EES standards to augment deployment
- 10.3.7 POLAND
- 10.3.7.1 Widespread rollout of biometric e-gates and modernized visa screening to support market growth
- 10.3.8 NORDICS
- 10.3.8.1 Government focus on enhancing cross-border travel efficiency to drive market
- 10.3.9 REST OF EUROPE
- 10.4 ASIA PACIFIC
- 10.4.1 MACROECONOMIC OUTLOOK FOR ASIA PACIFIC
- 10.4.2 CHINA
- 10.4.2.1 Implementation of smart travel initiative to create growth opportunities
- 10.4.3 JAPAN
- 10.4.3.1 Commitment to improve overall travel experience to contribute to market growth
- 10.4.4 SOUTH KOREA
- 10.4.4.1 Airport modernization with deployment of biometric smart pass and e-gates to facilitate demand
- 10.4.5 INDIA
- 10.4.5.1 Deployment of integrated immigration check posts at various land borders to support market growth
- 10.4.6 INDONESIA
- 10.4.6.1 Investment in implementation of facial recognition systems at seaports to promote market growth
- 10.4.7 AUSTRALIA
- 10.4.7.1 Strong focus on deployment of fully biometric-enabled border processing infrastructure to strengthen market momentum
- 10.4.8 MALAYSIA
- 10.4.8.1 Elevating deployment of integrated QR systems, biometric autogates, and cross-border pilot programs to accelerate market progress
- 10.4.9 THAILAND
- 10.4.9.1 Launch of facial-recognition biometric system across several airports to fuel market growth
- 10.4.10 VIETNAM
- 10.4.10.1 Modernization initiatives in border control with biometric autogates and VNeID eKYC expansion to boost demand
- 10.4.11 REST OF ASIA PACIFIC
- 10.5 REST OF THE WORLD (ROW)
- 10.5.1 MACROECONOMIC OUTLOOK FOR ROW
- 10.5.2 MIDDLE EAST
- 10.5.2.1 Increase in number of high-profile events, summits, and global conferences in UAE to fuel demand
- 10.5.3 AFRICA
- 10.5.3.1 Need to manage influx of rising number of tourists to fuel market growth
- 10.5.4 SOUTH AMERICA
- 10.5.4.1 High volume of travelers to expedite demand
11 COMPETITIVE LANDSCAPE
- 11.1 INTRODUCTION
- 11.2 REVENUE ANALYSIS, 2020-2024
- 11.3 MARKET SHARE ANALYSIS, 2024
- 11.4 COMPANY EVALUATION MATRIX: KEY PLAYERS, 2024
- 11.4.1 STARS
- 11.4.2 EMERGING LEADERS
- 11.4.3 PERVASIVE PLAYERS
- 11.4.4 PARTICIPANTS
- 11.4.5 COMPANY FOOTPRINT: KEY PLAYERS, 2024
- 11.4.5.1 Region footprint
- 11.4.5.2 Solution type footprint
- 11.4.5.3 Application footprint
- 11.5 COMPANY EVALUATION MATRIX: STARTUPS/SMES, 2024
- 11.5.1 PROGRESSIVE COMPANIES
- 11.5.2 RESPONSIVE COMPANIES
- 11.5.3 DYNAMIC COMPANIES
- 11.5.4 STARTING BLOCKS
- 11.5.5 COMPETITIVE BENCHMARKING: STARTUPS/SMES, 2024
- 11.5.5.1 Detailed list of key startups/SMEs
- 11.5.5.2 Competitive benchmarking of key startups/SMEs
- 11.6 COMPETITIVE SCENARIO
- 11.6.1 PRODUCT LAUNCHES
- 11.6.2 DEALS
- 11.6.3 OTHER DEVELOPMENTS
12 COMPANY PROFILES
- 12.1 KEY PLAYERS
- 12.1.1 VISION-BOX
- 12.1.1.1 Business overview
- 12.1.1.2 Products/Solutions/Services offered
- 12.1.1.3 Recent developments
- 12.1.1.3.1 Product launches
- 12.1.1.3.2 Deals
- 12.1.1.4 MnM view
- 12.1.1.4.1 Key strengths/Right to win
- 12.1.1.4.2 Strategic choices
- 12.1.1.4.3 Weaknesses and competitive threats
- 12.1.2 SITA
- 12.1.2.1 Business overview
- 12.1.2.2 Products/Solutions/Services offered
- 12.1.2.3 Recent developments
- 12.1.2.3.1 Deals
- 12.1.2.3.2 Other developments
- 12.1.2.4 MnM view
- 12.1.2.4.1 Key strengths/Right to win
- 12.1.2.4.2 Strategic choices
- 12.1.2.4.3 Weaknesses and competitive threats
- 12.1.3 SECUNET SECURITY NETWORKS AG
- 12.1.3.1 Business overview
- 12.1.3.2 Products/Solutions/Services offered
- 12.1.3.3 Recent developments
- 12.1.3.3.1 Deals
- 12.1.3.3.2 Other developments
- 12.1.3.4 MnM view
- 12.1.3.4.1 Key strengths/Right to win
- 12.1.3.4.2 Strategic choices
- 12.1.3.4.3 Weaknesses and competitive threats
- 12.1.4 IDEMIA
- 12.1.4.1 Business overview
- 12.1.4.2 Products/Solutions/Services offered
- 12.1.4.3 Recent developments
- 12.1.4.3.1 Product launches
- 12.1.4.3.2 Deals
- 12.1.4.3.3 Other developments
- 12.1.4.4 MnM view
- 12.1.4.4.1 Key strengths/Right to win
- 12.1.4.4.2 Strategic choices
- 12.1.4.4.3 Weaknesses and competitive threats
- 12.1.5 THALES
- 12.1.5.1 Business overview
- 12.1.5.2 Products/Solutions/Services offered
- 12.1.5.3 Recent developments
- 12.1.5.3.1 Product launches
- 12.1.5.3.2 Deals
- 12.1.5.3.3 Other developments
- 12.1.5.4 MnM view
- 12.1.5.4.1 Key strengths/Right to win
- 12.1.5.4.2 Strategic choices
- 12.1.5.4.3 Weaknesses and competitive threats
- 12.1.6 NEC CORPORATION
- 12.1.6.1 Business overview
- 12.1.6.2 Products/Solutions/Services offered
- 12.1.6.3 Recent developments
- 12.1.6.3.1 Product launches
- 12.1.6.3.2 Deals
- 12.1.6.3.3 Other developments
- 12.1.7 INDRA SISTEMAS, S.A.
- 12.1.7.1 Business overview
- 12.1.7.2 Products/Solutions/Services offered
- 12.1.8 GUNNEBO AB
- 12.1.8.1 Business overview
- 12.1.8.2 Products/Solutions/Services offered
- 12.1.8.3 Recent developments
- 12.1.8.3.1 Deals
- 12.1.9 HID GLOBAL CORPORATIONS
- 12.1.9.1 Business overview
- 12.1.9.2 Products/Solutions/Services offered
- 12.1.9.3 Recent developments
- 12.1.9.3.1 Deals
- 12.1.10 ATOS SE
- 12.1.10.1 Business overview
- 12.1.10.2 Products/Solutions/Services offered
- 12.1.11 DORMAKABA GROUP
- 12.1.11.1 Business overview
- 12.1.11.2 Products/Solutions/Services offered
- 12.1.12 UNISYS
- 12.1.12.1 Business overview
- 12.1.12.2 Products/Solutions/Services offered
- 12.1.12.3 Recent developments
- 12.1.12.3.1 Developments
- 12.1.1 VISION-BOX
- 12.2 OTHER PLAYERS
- 12.2.1 BIOLINK SOLUTIONS
- 12.2.2 BIOID
- 12.2.3 COGNITEC SYSTEMS GMBH
- 12.2.4 DERMALOG IDENTIFICATION SYSTEM GMBH
- 12.2.5 IER
- 12.2.6 INTERNATIONAL SECURITY TECHNOLOGY LTD.
- 12.2.7 M2SYS TECHNOLOGY
- 12.2.8 MAGNETIC AUTOCONTROL GMBH
- 12.2.9 MUHLBAUER GROUP
- 12.2.10 SECURIPORT
- 12.2.11 VERIDOS GMBH
- 12.2.12 ZETES
- 12.2.13 MORPHO DYS
13 APPENDIX
- 13.1 INSIGHTS FROM INDUSTRY EXPERTS
- 13.2 DISCUSSION GUIDE
- 13.3 KNOWLEDGESTORE: MARKETSANDMARKETS' SUBSCRIPTION PORTAL
- 13.4 CUSTOMIZATION OPTIONS
- 13.5 RELATED REPORTS
- 13.6 AUTHOR DETAILS
List of Tables
- TABLE 1 RESEARCH ASSUMPTIONS IN AUTOMATED BORDER CONTROL MARKET
- TABLE 2 RESEARCH LIMITATIONS IN AUTOMATED BORDER CONTROL MARKET
- TABLE 3 RISKS ASSOCIATED WITH STUDY
- TABLE 4 AUTOMATED BORDER CONTROL MARKET: ECOSYSTEM ANALYSIS
- TABLE 5 PRICING RANGE OF ABC SYSTEMS OFFERED BY KEY PLAYERS, BY SOLUTION TYPE, 2024 (USD)
- TABLE 6 PRICING RANGE OF ABC SYSTEMS, BY SOLUTION TYPE, 2024 (USD)
- TABLE 7 INFLUENCE OF STAKEHOLDERS ON BUYING PROCESS FOR APPLICATIONS (%)
- TABLE 8 KEY BUYING CRITERIA FOR TOP 3 APPLICATIONS
- TABLE 9 LIST OF MAJOR PATENTS, 2020-2022
- TABLE 10 AUTOMATED BORDER CONTROL MARKET: LIST OF KEY CONFERENCES AND EVENTS, 2025-2026
- TABLE 11 NORTH AMERICA: LIST OF REGULATORY BODIES, GOVERNMENT AGENCIES, AND OTHER ORGANIZATIONS
- TABLE 12 EUROPE: LIST OF REGULATORY BODIES, GOVERNMENT AGENCIES, AND OTHER ORGANIZATIONS
- TABLE 13 ASIA PACIFIC: LIST OF REGULATORY BODIES, GOVERNMENT AGENCIES, AND OTHER ORGANIZATIONS
- TABLE 14 ROW: LIST OF REGULATORY BODIES, GOVERNMENT AGENCIES, AND OTHER ORGANIZATIONS
- TABLE 15 REGULATIONS AND STANDARDS FOR AUTOMATED BORDER CONTROL MARKET
- TABLE 16 AUTOMATED BORDER CONTROL MARKET, BY SOLUTION TYPE, 2021-2024 (USD MILLION)
- TABLE 17 AUTOMATED BORDER CONTROL MARKET, BY SOLUTION TYPE, 2025-2030 (USD MILLION)
- TABLE 18 AUTOMATED BORDER CONTROL MARKET, BY SOLUTION TYPE, 2021-2024 (THOUSAND UNITS)
- TABLE 19 AUTOMATED BORDER CONTROL MARKET, BY SOLUTION TYPE, 2025-2030 (THOUSAND UNITS)
- TABLE 20 ABC E-GATES: AUTOMATED BORDER CONTROL MARKET, BY APPLICATION, 2021-2024 (USD MILLION)
- TABLE 21 ABC E-GATES: AUTOMATED BORDER CONTROL MARKET, BY APPLICATION, 2025-2030 (USD MILLION)
- TABLE 22 ABC KIOSKS: AUTOMATED BORDER CONTROL MARKET, BY APPLICATION, 2021-2024 (USD MILLION)
- TABLE 23 ABC KIOSKS: AUTOMATED BORDER CONTROL MARKET, BY APPLICATION, 2025-2030 (USD MILLION)
- TABLE 24 AUTOMATED BORDER CONTROL MARKET, BY OFFERING, 2021-2024 (USD MILLION)
- TABLE 25 AUTOMATED BORDER CONTROL MARKET, BY OFFERING, 2025-2030 (USD MILLION)
- TABLE 26 AUTOMATED BORDER CONTROL MARKET, BY HARDWARE TYPE, 2021-2024 (USD MILLION)
- TABLE 27 AUTOMATED BORDER CONTROL MARKET, BY HARDWARE TYPE, 2025-2030 (USD MILLION)
- TABLE 28 HARDWARE: AUTOMATED BORDER CONTROL MARKET, BY BIOMETRIC VERIFICATION SYSTEM TYPE, 2021-2024 (USD MILLION)
- TABLE 29 HARDWARE: AUTOMATED BORDER CONTROL MARKET, BY BIOMETRIC VERIFICATION SYSTEM TYPE, 2025-2030 (USD MILLION)
- TABLE 30 HARDWARE: AUTOMATED BORDER CONTROL MARKET, BY APPLICATION, 2021-2024 (USD MILLION)
- TABLE 31 HARDWARE: AUTOMATED BORDER CONTROL MARKET, BY APPLICATION, 2025-2030 (USD MILLION)
- TABLE 32 SOFTWARE: AUTOMATED BORDER CONTROL MARKET, BY APPLICATION, 2021-2024 (USD MILLION)
- TABLE 33 SOFTWARE: AUTOMATED BORDER CONTROL MARKET, BY APPLICATION, 2025-2030 (USD MILLION)
- TABLE 34 AUTOMATED BORDER CONTROL MARKET, BY SERVICE TYPE, 2021-2024 (USD MILLION)
- TABLE 35 AUTOMATED BORDER CONTROL MARKET, BY SERVICE TYPE, 2025-2030 (USD MILLION)
- TABLE 36 SERVICES: AUTOMATED BORDER CONTROL MARKET, BY APPLICATION, 2021-2024 (USD MILLION)
- TABLE 37 SERVICES: AUTOMATED BORDER CONTROL MARKET, BY APPLICATION, 2025-2030 (USD MILLION)
- TABLE 38 AUTOMATED BORDER CONTROL MARKET, BY APPLICATION, 2021-2024 (USD MILLION)
- TABLE 39 AUTOMATED BORDER CONTROL MARKET, BY APPLICATION, 2025-2030 (USD MILLION)
- TABLE 40 AIRPORTS: AUTOMATED BORDER CONTROL MARKET, BY SOLUTION TYPE, 2021-2024 (USD MILLION)
- TABLE 41 AIRPORTS: AUTOMATED BORDER CONTROL MARKET, BY SOLUTION, 2025-2030 (USD MILLION)
- TABLE 42 AIRPORTS: AUTOMATED BORDER CONTROL MARKET, BY OFFERING, 2021-2024 (USD MILLION)
- TABLE 43 AIRPORTS: AUTOMATED BORDER CONTROL MARKET, BY OFFERING, 2025-2030 (USD MILLION)
- TABLE 44 AIRPORTS: AUTOMATED BORDER CONTROL MARKET, BY REGION, 2021-2024 (USD MILLION)
- TABLE 45 AIRPORTS: AUTOMATED BORDER CONTROL MARKET, BY REGION, 2025-2030 (USD MILLION)
- TABLE 46 AIRPORTS: AUTOMATED BORDER CONTROL MARKET IN NORTH AMERICA, BY COUNTRY, 2021-2024 (USD MILLION)
- TABLE 47 AIRPORTS: AUTOMATED BORDER CONTROL MARKET IN NORTH AMERICA, BY COUNTRY, 2025-2030 (USD MILLION)
- TABLE 48 AIRPORTS: AUTOMATED BORDER CONTROL MARKET IN EUROPE, BY COUNTRY, 2021-2024 (USD MILLION)
- TABLE 49 AIRPORTS: AUTOMATED BORDER CONTROL MARKET IN EUROPE, BY COUNTRY, 2025-2030 (USD MILLION)
- TABLE 50 AIRPORTS: AUTOMATED BORDER CONTROL MARKET IN ASIA PACIFIC, BY COUNTRY, 2021-2024 (USD MILLION)
- TABLE 51 AIRPORTS: AUTOMATED BORDER CONTROL MARKET IN ASIA PACIFIC, BY COUNTRY, 2025-2030 (USD MILLION)
- TABLE 52 AIRPORTS: AUTOMATED BORDER CONTROL MARKET IN ROW, BY REGION, 2021-2024 (USD MILLION)
- TABLE 53 AIRPORTS: AUTOMATED BORDER CONTROL MARKET IN ROW, BY REGION, 2025-2030 (USD MILLION)
- TABLE 54 SEAPORTS: AUTOMATED BORDER CONTROL MARKET, BY SOLUTION TYPE, 2021-2024 (USD MILLION)
- TABLE 55 SEAPORTS: AUTOMATED BORDER CONTROL MARKET, BY SOLUTION TYPE, 2025-2030 (USD MILLION)
- TABLE 56 SEAPORTS: AUTOMATED BORDER CONTROL MARKET, BY OFFERING, 2021-2024 (USD MILLION)
- TABLE 57 SEAPORTS: AUTOMATED BORDER CONTROL MARKET, BY OFFERING, 2025-2030 (USD MILLION)
- TABLE 58 SEAPORTS: AUTOMATED BORDER CONTROL MARKET, BY REGION, 2021-2024 (USD MILLION)
- TABLE 59 SEAPORTS: AUTOMATED BORDER CONTROL MARKET, BY REGION, 2025-2030 (USD MILLION)
- TABLE 60 SEAPORTS: AUTOMATED BORDER CONTROL MARKET IN NORTH AMERICA, BY COUNTRY, 2021-2024 (USD MILLION)
- TABLE 61 SEAPORTS: AUTOMATED BORDER CONTROL MARKET IN NORTH AMERICA, BY COUNTRY, 2025-2030 (USD MILLION)
- TABLE 62 SEAPORTS: AUTOMATED BORDER CONTROL MARKET IN EUROPE, BY COUNTRY, 2021-2024 (USD MILLION)
- TABLE 63 SEAPORTS: AUTOMATED BORDER CONTROL MARKET IN EUROPE, BY COUNTRY, 2025-2030 (USD MILLION)
- TABLE 64 SEAPORTS: AUTOMATED BORDER CONTROL MARKET IN ASIA PACIFIC, BY COUNTRY, 2021-2024 (USD MILLION)
- TABLE 65 SEAPORTS: AUTOMATED BORDER CONTROL MARKET IN ASIA PACIFIC, BY COUNTRY, 2025-2030 (USD MILLION)
- TABLE 66 SEAPORTS: AUTOMATED BORDER CONTROL MARKET IN ROW, BY REGION, 2021-2024 (USD MILLION)
- TABLE 67 SEAPORTS: AUTOMATED BORDER CONTROL MARKET IN ROW, BY REGION, 2025-2030 (USD MILLION)
- TABLE 68 LAND PORTS: AUTOMATED BORDER CONTROL MARKET, BY SOLUTION TYPE, 2021-2024 (USD MILLION)
- TABLE 69 LAND PORTS: AUTOMATED BORDER CONTROL MARKET, BY SOLUTION TYPE, 2025-2030 (USD MILLION)
- TABLE 70 LAND PORTS: AUTOMATED BORDER CONTROL MARKET, BY OFFERING, 2021-2024 (USD MILLION)
- TABLE 71 LAND PORTS: AUTOMATED BORDER CONTROL MARKET, BY OFFERING, 2025-2030 (USD MILLION)
- TABLE 72 LAND PORTS: AUTOMATED BORDER CONTROL MARKET, BY REGION, 2021-2024 (USD MILLION)
- TABLE 73 LAND PORTS: AUTOMATED BORDER CONTROL MARKET, BY REGION, 2025-2030 (USD MILLION)
- TABLE 74 LAND PORTS: AUTOMATED BORDER CONTROL MARKET IN NORTH AMERICA, BY COUNTRY, 2021-2024 (USD MILLION)
- TABLE 75 LAND PORTS: AUTOMATED BORDER CONTROL MARKET IN NORTH AMERICA, BY COUNTRY, 2025-2030 (USD MILLION)
- TABLE 76 LAND PORTS: AUTOMATED BORDER CONTROL MARKET IN EUROPE, BY COUNTRY, 2021-2024 (USD MILLION)
- TABLE 77 LAND PORTS: AUTOMATED BORDER CONTROL MARKET IN EUROPE, BY COUNTRY, 2025-2030 (USD MILLION)
- TABLE 78 LAND PORTS: AUTOMATED BORDER CONTROL MARKET IN ASIA PACIFIC, BY COUNTRY, 2021-2024 (USD MILLION)
- TABLE 79 LAND PORTS: AUTOMATED BORDER CONTROL MARKET IN ASIA PACIFIC, BY COUNTRY, 2025-2030 (USD MILLION)
- TABLE 80 LAND PORTS: AUTOMATED BORDER CONTROL MARKET IN ROW, BY REGION, 2021-2024 (USD MILLION)
- TABLE 81 LAND PORTS: AUTOMATED BORDER CONTROL MARKET IN ROW, BY REGION, 2025-2030 (USD MILLION)
- TABLE 82 AUTOMATED BORDER CONTROL MARKET, BY REGION, 2021-2024 (USD MILLION)
- TABLE 83 AUTOMATED BORDER CONTROL MARKET, BY REGION, 2025-2030 (USD MILLION)
- TABLE 84 NORTH AMERICA: AUTOMATED BORDER CONTROL MARKET, BY COUNTRY, 2021-2024 (USD MILLION)
- TABLE 85 NORTH AMERICA: AUTOMATED BORDER CONTROL MARKET, BY COUNTRY, 2025-2030 (USD MILLION)
- TABLE 86 NORTH AMERICA: AUTOMATED BORDER CONTROL MARKET, BY APPLICATION, 2021-2024 (USD MILLION)
- TABLE 87 NORTH AMERICA: AUTOMATED BORDER CONTROL MARKET, BY APPLICATION, 2025-2030 (USD MILLION)
- TABLE 88 US: AUTOMATED BORDER CONTROL MARKET, BY APPLICATION, 2021-2024 (USD MILLION)
- TABLE 89 US: AUTOMATED BORDER CONTROL MARKET, BY APPLICATION, 2025-2030 (USD MILLION)
- TABLE 90 CANADA: AUTOMATED BORDER CONTROL MARKET, BY APPLICATION, 2021-2024 (USD MILLION)
- TABLE 91 CANADA: AUTOMATED BORDER CONTROL MARKET, BY APPLICATION, 2025-2030 (USD MILLION)
- TABLE 92 MEXICO: AUTOMATED BORDER CONTROL MARKET, BY APPLICATION, 2021-2024 (USD MILLION)
- TABLE 93 MEXICO: AUTOMATED BORDER CONTROL MARKET, BY APPLICATION, 2025-2030 (USD MILLION)
- TABLE 94 EUROPE: AUTOMATED BORDER CONTROL, BY COUNTRY, 2021-2024 (USD MILLION)
- TABLE 95 EUROPE: AUTOMATED BORDER CONTROL, BY COUNTRY, 2025-2030 (USD MILLION)
- TABLE 96 EUROPE: AUTOMATED BORDER CONTROL MARKET, BY APPLICATION, 2021-2024 (USD MILLION)
- TABLE 97 EUROPE: AUTOMATED BORDER CONTROL MARKET, BY APPLICATION, 2025-2030 (USD MILLION)
- TABLE 98 GERMANY: AUTOMATED BORDER CONTROL MARKET, BY APPLICATION, 2021-2024 (USD MILLION)
- TABLE 99 GERMANY: AUTOMATED BORDER CONTROL MARKET, BY APPLICATION, 2025-2030 (USD MILLION)
- TABLE 100 UK: AUTOMATED BORDER CONTROL MARKET, BY APPLICATION, 2021-2024 (USD MILLION)
- TABLE 101 UK: AUTOMATED BORDER CONTROL MARKET, BY APPLICATION, 2025-2030 (USD MILLION)
- TABLE 102 FRANCE: AUTOMATED BORDER CONTROL MARKET, BY APPLICATION, 2021-2024 (USD MILLION)
- TABLE 103 FRANCE: AUTOMATED BORDER CONTROL MARKET, BY APPLICATION, 2025-2030 (USD MILLION)
- TABLE 104 ITALY: AUTOMATED BORDER CONTROL MARKET, BY APPLICATION, 2021-2024 (USD MILLION)
- TABLE 105 ITALY: AUTOMATED BORDER CONTROL MARKET, BY APPLICATION, 2025-2030 (USD MILLION)
- TABLE 106 SPAIN: AUTOMATED BORDER CONTROL MARKET, BY APPLICATION, 2021-2024 (USD MILLION)
- TABLE 107 SPAIN: AUTOMATED BORDER CONTROL MARKET, BY APPLICATION, 2025-2030 (USD MILLION)
- TABLE 108 POLAND: AUTOMATED BORDER CONTROL MARKET, BY APPLICATION, 2021-2024 (USD MILLION)
- TABLE 109 POLAND: AUTOMATED BORDER CONTROL MARKET, BY APPLICATION, 2025-2030 (USD MILLION)
- TABLE 110 NORDICS: AUTOMATED BORDER CONTROL MARKET, BY APPLICATION, 2021-2024 (USD MILLION)
- TABLE 111 NORDICS: AUTOMATED BORDER CONTROL MARKET, BY APPLICATION, 2025-2030 (USD MILLION)
- TABLE 112 REST OF EUROPE: AUTOMATED BORDER CONTROL MARKET, BY APPLICATION, 2021-2024 (USD MILLION)
- TABLE 113 REST OF EUROPE: AUTOMATED BORDER CONTROL MARKET BY APPLICATION, 2025-2030 (USD MILLION)
- TABLE 114 ASIA PACIFIC: AUTOMATED BORDER CONTROL MARKET, BY COUNTRY, 2021-2024 (USD MILLION)
- TABLE 115 ASIA PACIFIC: AUTOMATED BORDER CONTROL MARKET, BY COUNTRY, 2025-2030 (USD MILLION)
- TABLE 116 ASIA PACIFIC: AUTOMATED BORDER CONTROL MARKET, BY APPLICATION, 2021-2024 (USD MILLION)
- TABLE 117 ASIA PACIFIC: AUTOMATED BORDER CONTROL MARKET, BY APPLICATION, 2025-2030 (USD MILLION)
- TABLE 118 CHINA: AUTOMATED BORDER CONTROL MARKET, BY APPLICATION, 2021-2024 (USD MILLION)
- TABLE 119 CHINA: AUTOMATED BORDER CONTROL MARKET, BY APPLICATION, 2025-2030 (USD MILLION)
- TABLE 120 JAPAN: AUTOMATED BORDER CONTROL MARKET, BY APPLICATION, 2021-2024 (USD MILLION)
- TABLE 121 JAPAN: AUTOMATED BORDER CONTROL MARKET, BY APPLICATION, 2025-2030 (USD MILLION)
- TABLE 122 SOUTH KOREA: AUTOMATED BORDER CONTROL MARKET, BY APPLICATION, 2021-2024 (USD MILLION)
- TABLE 123 SOUTH KOREA: AUTOMATED BORDER CONTROL MARKET, BY APPLICATION, 2025-2030 (USD MILLION)
- TABLE 124 INDIA: AUTOMATED BORDER CONTROL MARKET, BY APPLICATION, 2021-2024 (USD MILLION)
- TABLE 125 INDIA: AUTOMATED BORDER CONTROL MARKET, BY APPLICATION, 2025-2030 (USD MILLION)
- TABLE 126 INDONESIA: AUTOMATED BORDER CONTROL MARKET, BY APPLICATION, 2021-2024 (USD MILLION)
- TABLE 127 INDONESIA: AUTOMATED BORDER CONTROL MARKET, BY APPLICATION, 2025-2030 (USD MILLION)
- TABLE 128 AUSTRALIA: AUTOMATED BORDER CONTROL MARKET, BY APPLICATION, 2021-2024 (USD MILLION)
- TABLE 129 AUSTRALIA: AUTOMATED BORDER CONTROL MARKET, BY APPLICATION, 2025-2030 (USD MILLION)
- TABLE 130 MALAYSIA: AUTOMATED BORDER CONTROL MARKET, BY APPLICATION, 2021-2024 (USD MILLION)
- TABLE 131 MALAYSIA: AUTOMATED BORDER CONTROL MARKET, BY APPLICATION, 2025-2030 (USD MILLION)
- TABLE 132 THAILAND: AUTOMATED BORDER CONTROL MARKET, BY APPLICATION, 2021-2024 (USD MILLION)
- TABLE 133 THAILAND: AUTOMATED BORDER CONTROL MARKET, BY APPLICATION, 2025-2030 (USD MILLION)
- TABLE 134 VIETNAM: AUTOMATED BORDER CONTROL MARKET, BY APPLICATION, 2021-2024 (USD MILLION)
- TABLE 135 VIETNAM: AUTOMATED BORDER CONTROL MARKET, BY APPLICATION, 2025-2030 (USD MILLION)
- TABLE 136 REST OF ASIA PACIFIC: AUTOMATED BORDER CONTROL MARKET, BY APPLICATION, 2021-2024 (USD MILLION)
- TABLE 137 REST OF ASIA PACIFIC: AUTOMATED BORDER CONTROL MARKET, BY APPLICATION, 2025-2030 (USD MILLION)
- TABLE 138 ROW: AUTOMATED BORDER CONTROL MARKET, BY REGION, 2021-2024 (USD MILLION)
- TABLE 139 ROW: AUTOMATED BORDER CONTROL MARKET, BY REGION, 2025-2030 (USD MILLION)
- TABLE 140 ROW: AUTOMATED BORDER CONTROL MARKET, BY APPLICATION, 2021-2024 (USD MILLION)
- TABLE 141 ROW: AUTOMATED BORDER CONTROL MARKET, BY APPLICATION, 2025-2030 (USD MILLION)
- TABLE 142 MIDDLE EAST: AUTOMATED BORDER CONTROL MARKET, BY APPLICATION, 2021-2024 (USD MILLION)
- TABLE 143 MIDDLE EAST: AUTOMATED BORDER CONTROL MARKET, BY APPLICATION, 2025-2030 (USD MILLION)
- TABLE 144 AFRICA: AUTOMATED BORDER CONTROL MARKET, BY APPLICATION, 2021-2024 (USD MILLION)
- TABLE 145 AFRICA: AUTOMATED BORDER CONTROL MARKET, BY APPLICATION, 2025-2030 (USD MILLION)
- TABLE 146 SOUTH AMERICA: AUTOMATED BORDER CONTROL MARKET, BY APPLICATION, 2021-2024 (USD MILLION)
- TABLE 147 SOUTH AMERICA: AUTOMATED BORDER CONTROL MARKET, BY APPLICATION, 2025-2030 (USD MILLION)
- TABLE 148 KEY DEVELOPMENTS IN AUTOMATED BORDER CONTROL MARKET, 2020-2025
- TABLE 149 AUTOMATED BORDER CONTROL MARKET: DEGREE OF COMPETITION
- TABLE 150 COMPANY FOOTPRINT
- TABLE 151 AUTOMATED BORDER CONTROL MARKET: REGION FOOTPRINT
- TABLE 152 COMPANY FOOTPRINT, BY SOLUTION TYPE
- TABLE 153 COMPANY FOOTPRINT, BY APPLICATION
- TABLE 154 AUTOMATED BORDER CONTROL MARKET: LIST OF KEY STARTUPS/SMES
- TABLE 155 AUTOMATED BORDER CONTROL MARKET: COMPETITIVE BENCHMARKING OF KEY STARTUPS/SMES
- TABLE 156 AUTOMATED BORDER CONTROL MARKET: PRODUCT LAUNCHES, JANUARY 2021-JUNE 2025
- TABLE 157 AUTOMATED BORDER CONTROL MARKET: DEALS, JANUARY 2021-JUNE 2025
- TABLE 158 AUTOMATED BORDER CONTROL MARKET: OTHER DEVELOPMENTS, JANUARY 2021-JUNE 2025
- TABLE 159 VISION-BOX: COMPANY OVERVIEW
- TABLE 160 VISION-BOX: PRODUCT/SOLUTION/SERVICE OFFERINGS
- TABLE 161 VISION-BOX: PRODUCT LAUNCHES
- TABLE 162 VISION-BOX: DEALS
- TABLE 163 SITA: COMPANY OVERVIEW
- TABLE 164 SITA: PRODUCT/SOLUTION/SERVICE OFFERINGS
- TABLE 165 SITA: DEALS
- TABLE 166 SITA: OTHER DEVELOPMENTS
- TABLE 167 SECUNET SECURITY NETWORKS AG: COMPANY OVERVIEW
- TABLE 168 SECUNET SECURITY NETWORKS AG: PRODUCT/SOLUTION/SERVICE OFFERINGS
- TABLE 169 SECUNET SECURITY NETWORKS AG: DEALS
- TABLE 170 SECUNET SECURITY NETWORKS AG: OTHER DEVELOPMENTS
- TABLE 171 IDEMIA: COMPANY OVERVIEW
- TABLE 172 IDEMIA: PRODUCT/SOLUTION/SERVICE OFFERINGS
- TABLE 173 IDEMIA: PRODUCT LAUNCHES
- TABLE 174 IDEMIA: DEALS
- TABLE 175 IDEMIA: OTHER DEVELOPMENTS
- TABLE 176 THALES: COMPANY OVERVIEW
- TABLE 177 THALES: PRODUCTS/SOLUTIONS/SERVICES OFFERED
- TABLE 178 THALES: PRODUCT LAUNCHES
- TABLE 179 THALES: DEALS
- TABLE 180 THALES: OTHER DEVELOPMENTS
- TABLE 181 NEC CORPORATION: COMPANY OVERVIEW
- TABLE 182 NEC CORPORATION: PRODUCT/SOLUTION/SERVICE OFFERINGS
- TABLE 183 NEC CORPORATION: PRODUCT LAUNCHES
- TABLE 184 NEC CORPORATION: DEALS
- TABLE 185 NEC CORPORATION: OTHER DEVELOPMENTS
- TABLE 186 INDRA SISTEMAS, S.A.: COMPANY OVERVIEW
- TABLE 187 INDRA SISTEMAS, S.A.: PRODUCT/SOLUTION/SERVICE OFFERINGS
- TABLE 188 GUNNEBO AB: COMPANY OVERVIEW
- TABLE 189 GUNNEBO AB: PRODUCT/SOLUTION/SERVICE OFFERINGS
- TABLE 190 GUNNEBO AB: DEALS
- TABLE 191 HID GLOBAL CORPORATION: COMPANY OVERVIEW
- TABLE 192 HID GLOBAL CORPORATION: PRODUCT/SOLUTION/SERVICE OFFERINGS
- TABLE 193 HID GLOBAL CORPORATION: DEALS
- TABLE 194 ATOS SE: COMPANY OVERVIEW
- TABLE 195 ATOS SE: PRODUCT/SOLUTION/SERVICE OFFERINGS
- TABLE 196 DORMAKABA GROUP: COMPANY OVERVIEW
- TABLE 197 DORMAKABA GROUP: PRODUCT/SOLUTION/SERVICE OFFERINGS
- TABLE 198 UNISYS: COMPANY OVERVIEW
- TABLE 199 UNISYS: PRODUCT/SOLUTION/SERVICE OFFERINGS
- TABLE 200 BIOLINK SOLUTIONS: COMPANY OVERVIEW
- TABLE 201 BIOID: COMPANY OVERVIEW
- TABLE 202 COGNITEC SYSTEMS GMBH: COMPANY OVERVIEW
- TABLE 203 DERMALOG IDENTIFICATION SYSTEM GMBH: COMPANY OVERVIEW
- TABLE 204 IER: COMPANY OVERVIEW
- TABLE 205 INTERNATIONAL SECURITY TECHNOLOGY LTD.: COMPANY OVERVIEW
- TABLE 206 M2SYS TECHNOLOGY: COMPANY OVERVIEW
- TABLE 207 MAGNETIC AUTOCONTROL GMBH: COMPANY OVERVIEW
- TABLE 208 MUHLBAUER GROUP: COMPANY OVERVIEW
- TABLE 209 SECURIPORT: COMPANY OVERVIEW
- TABLE 210 VERIDOS GMBH: COMPANY OVERVIEW
- TABLE 211 ZETES: COMPANY OVERVIEW
- TABLE 212 MORPHO DYS: COMPANY OVERVIEW
List of Figures
- FIGURE 1 AUTOMATED BORDER CONTROL MARKET: MARKET SEGMENTATION AND REGIONAL SCOPE
- FIGURE 2 AUTOMATED BORDER CONTROL MARKET: RESEARCH DESIGN
- FIGURE 3 APPROACH (SUPPLY SIDE): REVENUE GENERATED THROUGH SALES OF AUTOMATED BORDER CONTROL PRODUCTS/SOLUTIONS/SERVICES
- FIGURE 4 MARKET SIZE ESTIMATION METHODOLOGY: BOTTOM-UP APPROACH
- FIGURE 5 MARKET SIZE ESTIMATION METHODOLOGY: TOP-DOWN APPROACH
- FIGURE 6 AUTOMATED BORDER CONTROL MARKET: DATA TRIANGULATION
- FIGURE 7 ABC E-GATES SEGMENT TO HOLD LARGER MARKET SHARE IN 2030
- FIGURE 8 HARDWARE SEGMENT TO CAPTURE LARGEST MARKET SHARE IN 2030
- FIGURE 9 AIRPORTS SEGMENT TO DOMINATE AUTOMATED BORDER CONTROL MARKET IN 2030
- FIGURE 10 EUROPE HELD MOST SIGNIFICANT SHARE OF AUTOMATED BORDER CONTROL MARKET IN 2024
- FIGURE 11 RISING NUMBER OF INTERNATIONAL TRAVELERS TO DRIVE IMPLEMENTATION OF AUTOMATED BORDER CONTROL SYSTEMS
- FIGURE 12 ABC E-GATES TO HOLD MAJORITY OF MARKET SHARE IN 2025
- FIGURE 13 HARDWARE SEGMENT TO COMMAND AUTOMATED BORDER CONTROL MARKET IN 2025
- FIGURE 14 AIRPORTS SEGMENT TO LEAD AUTOMATED BORDER CONTROL MARKET IN 2025
- FIGURE 15 INDIA TO RECORD HIGHEST CAGR IN GLOBAL MARKET DURING FORECAST PERIOD
- FIGURE 16 AUTOMATED BORDER CONTROL MARKET DYNAMICS
- FIGURE 17 IMPACT OF DRIVERS ON AUTOMATED BORDER CONTROL MARKET
- FIGURE 18 IMPACT OF RESTRAINTS ON AUTOMATED BORDER CONTROL MARKET
- FIGURE 19 IMPACT OF OPPORTUNITIES ON AUTOMATED BORDER CONTROL MARKET
- FIGURE 20 IMPACT OF CHALLENGES ON AUTOMATED BORDER CONTROL MARKET
- FIGURE 21 AUTOMATED BORDER CONTROL MARKET: SUPPLY CHAIN ANALYSIS
- FIGURE 22 AUTOMATED BORDER CONTROL ECOSYSTEM ANALYSIS
- FIGURE 23 TRENDS/DISRUPTIONS INFLUENCING CUSTOMER BUSINESS
- FIGURE 24 AUTOMATED BORDER CONTROL MARKET: PORTER'S FIVE FORCES ANALYSIS
- FIGURE 25 INFLUENCE OF STAKEHOLDERS ON BUYING PROCESS FOR APPLICATIONS
- FIGURE 26 KEY BUYING CRITERIA FOR APPLICATIONS
- FIGURE 27 IMPORT SCENARIO FOR HS CODE 8471-COMPLIANT PRODUCTS, BY COUNTRY, 2020-2024 (USD MILLION)
- FIGURE 28 EXPORT SCENARIO FOR HS CODE 8471-COMPLIANT PRODUCTS, BY COUNTRY, 2020-2024 (USD MILLION)
- FIGURE 29 NUMBER OF PATENTS GRANTED IN AUTOMATED BORDER CONTROL MARKET, 2015-2024
- FIGURE 30 AUTOMATED BORDER CROSSING PROCEDURES
- FIGURE 31 AUTOMATED BORDER CONTROL MARKET, BY SOLUTION TYPE
- FIGURE 32 ABC E-GATES DOMINATED MARKET IN 2024
- FIGURE 33 AUTOMATED BORDER CONTROL MARKET, BY OFFERING
- FIGURE 34 HARDWARE SEGMENT DOMINATED AUTOMATED BORDER CONTROL MARKET IN 2024
- FIGURE 35 AUTOMATED BORDER CONTROL MARKET, BY APPLICATION
- FIGURE 36 AIRPORTS TO RECORD HIGHEST CAGR IN AUTOMATED BORDER CONTROL MARKET DURING FORECAST PERIOD
- FIGURE 37 ASIA PACIFIC TO BE FASTEST-GROWING MARKET FROM 2025 TO 2030
- FIGURE 38 NORTH AMERICA: AUTOMATED BORDER CONTROL MARKET SNAPSHOT
- FIGURE 39 EUROPE: AUTOMATED BORDER CONTROL MARKET SNAPSHOT
- FIGURE 40 ASIA PACIFIC: AUTOMATED BORDER CONTROL MARKET SNAPSHOT
- FIGURE 41 AUTOMATED BORDER CONTROL MARKET: REVENUE OF KEY COMPANIES, 2020-2024
- FIGURE 42 SHARE OF KEY PLAYERS IN AUTOMATED BORDER CONTROL MARKET, 2024
- FIGURE 43 AUTOMATED BORDER CONTROL MARKET: COMPANY EVALUATION MATRIX (KEY PLAYERS), 2024
- FIGURE 44 AUTOMATED BORDER CONTROL MARKET: COMPANY EVALUATION MATRIX (STARTUPS/SMES), 2024
- FIGURE 45 SECUNET SECURITY NETWORKS AG: COMPANY SNAPSHOT
- FIGURE 46 THALES: COMPANY SNAPSHOT
- FIGURE 47 NEC CORPORATION: COMPANY SNAPSHOT
- FIGURE 48 INDRA SISTEMAS, S.A.: COMPANY SNAPSHOT
- FIGURE 49 GUNNEBO AB: COMPANY SNAPSHOT
- FIGURE 50 ATOS SE: COMPANY SNAPSHOTS
- FIGURE 51 DORMAKABA GROUP: COMPANY SNAPSHOT
- FIGURE 52 UNISYS: COMPANY SNAPSHOT

