
PUBLISHER: MarketsandMarkets | PRODUCT CODE: 1782042

PUBLISHER: MarketsandMarkets | PRODUCT CODE: 1782042
3D Weaving Market by Glass Fiber, Composite Textile, Spacer, Carbon Fiber, Customized 3D Weaving, Structural Components, Protective Materials, Reinforcements, Insulation, Thermal Protective Applications - Global Forecast to 2030
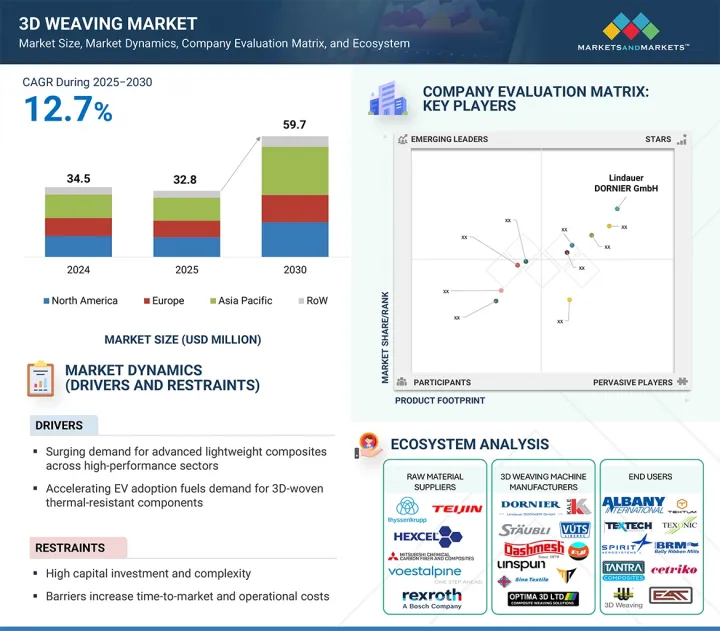
The 3D weaving market is projected to grow from USD 32.8 million in 2025 to USD 59.7 million by 2030, at a CAGR of 12.7%. The increasing demand for lightweight and high-strength materials is a major factor driving the adoption of 3D weaving machines. In aerospace, defense, and automotive sectors, reducing structural weight while maintaining or improving mechanical strength is essential for better fuel efficiency, higher payload capacity, and improved overall system performance. Traditional composite manufacturing approaches often face challenges in producing complex, multi-directional reinforcements.
| Scope of the Report | |
|---|---|
| Years Considered for the Study | 2021-2030 |
| Base Year | 2024 |
| Forecast Period | 2025-2030 |
| Units Considered | Value (USD Billion) |
| Segments | By product type, end-use industry, application, and region |
| Regions covered | North America, Europe, APAC, RoW |
However, 3D weaving machines enable the creation of fully integrated, multilayer woven structures that offer excellent strength-to-weight ratios, delamination resistance, and load-bearing capabilities. These features are especially valuable in aerospace components like wing spars, fuselage sections, military armor systems, and automotive body structures. As these industries continue to focus on performance and sustainability, the ability of 3D weaving machines to produce advanced, near-net-shape preforms efficiently and cost-effectively makes them a crucial technology for next-generation material manufacturing.
"Glass fiber weaving machines accounted for the largest market share in 2024"
In 2024, glass fiber weaving machines held the largest market share, driven by their wide industrial use, cost efficiency, and favorable material qualities. Glass fiber combines strength, durability, thermal stability, and lightness, making it ideal for automotive, construction, marine, and renewable energy sectors. Its ability to produce complex, high-performance composites at lower costs than carbon or aramid fibers has boosted adoption. Technological advances, like multi-axis control, automation, and improved precision, have increased efficiency and scalability, meeting the global demand for lightweight, sustainable materials. In regions like the Asia Pacific, with rapid industrial and infrastructure growth, the demand for affordable composite solutions sustains the dominance of glass fiber weaving machines.
"Aerospace & defense end-use industry is projected to register the highest CAGR during the forecast period."
The aerospace and defense end-use industry is expected to see the highest CAGR during the forecast period in the 3D weaving market, driven by the sector's increasing dependence on advanced composite materials for high-performance and safety-critical applications. As aircraft manufacturers and defense contractors aim to improve structural efficiency, reduce weight, and enhance fuel economy, the demand for 3D woven composites has risen significantly. These materials provide superior mechanical properties, such as high strength-to-weight ratios, impact resistance, and reduced delamination, making them ideal for components like fuselage panels, wing spars, turbine blades, and ballistic armor.
3D weaving machines are essential for creating complex, multi-directional fiber structures with high precision and consistency. They support near-net-shape manufacturing and help reduce material waste. Additionally, increased investments in defense upgrades, growing production of next-generation aircraft, and a rising global focus on lightweight military gear further boost demand for specialized 3D weaving technology. As aerospace and defense fields expand material capabilities, the industry is expected to remain the most dynamic and fastest-growing segment for 3D weaving machine adoption in the coming years.
"China is estimated to lead growth in the Asia Pacific 3D weaving market during the forecast period."
China is expected to dominate the growth of the Asia Pacific 3D weaving market during the forecast period, thanks to its robust industrial foundation, cost-effective manufacturing, and strategic investments in advanced sectors like aerospace, defense, automotive, and energy. Government initiatives such as "Made in China 2025" are boosting domestic innovation and the adoption of high-performance composite technologies. With increasing demand for lightweight, durable materials and a growing emphasis on R&D in material science and textile engineering, China remains well-positioned to be the leading force behind regional market growth.
Breakdown of Primaries
Various executives from key organizations operating in the 3D weaving market, including CEOs, marketing directors, and innovation and technology directors, were interviewed.
- By Company Type: Tier 1-35%, Tier 2- 40%, and Tier 3-25%
- By Designation: C-level Executives-30%, Directors-40%, and Others-30%
- By Region: North America-40%, Asia Pacific-32%, Europe-23%, and RoW-5%
The 3D weaving market is led by globally established players such as Lindauer DORNIER GmbH (Germany), Staubli International AG (Switzerland), Unspun (US), Dashmesh Jacquard and Powerloom Pvt. Ltd. (India), VUTS a.s. (Czech Republic), Hefei Fanyuan Instrument Co., Ltd. (China), Sino Textile Machinery (China), Optima 3D Ltd (UK), Kale Texnique (India), Marjan Polymer Industries (Pakistan), Albany International Corp. (US), Tex Tech Industries (US), Texonic (Canada), Textum OPCO, LLC (US), Spirit AeroSystems, Inc. (US), Bally Ribbon Mills (US), Tantra Composite Technologies Pvt. Ltd. (India), Cetriko (Spain), EAT GmbH (Germany), and 3D Weaving (Belgium). The study provides an in-depth competitive analysis of these key players in the 3D weaving market, including their company profiles, recent developments, and major market strategies.
Study Coverage
The report segments the 3D weaving market and forecasts its size by product type, end-use industries, application, and region. It also discusses the drivers, restraints, opportunities, and challenges related to the market. Additionally, it provides a detailed view of the market across four main regions-North America, Europe, Asia Pacific, and RoW. A supply chain analysis is included, along with key players and their competitive analysis of the 3D weaving ecosystem.
Key Benefits of Buying the Report
- Analysis of key drivers (enhanced structural integrity and minimized material waste), restraints (high capital investment and operational complexity), opportunities (emergence of hybrid composites and smart textiles), and challenges (extended product development and qualification cycles) influencing the growth of the 3D weaving market
- Products/Solution/Service Development/Innovation: Detailed insights into upcoming technologies and R&D activities in the 3D weaving market
- Market Development: Comprehensive information about lucrative markets-the report analyses the 3D weaving market across varied regions
- Market Diversification: Exhaustive information about new products/solutions/services, untapped geographies, recent developments, and investments in the 3D weaving market
- Competitive Assessment: In-depth assessment of market shares, growth strategies, and service offerings of leading players such as Lindauer DORNIER GmbH (Germany), Staubli International AG (Switzerland), Unspun (US), Hefei Fanyuan Instrument Co., Ltd (China), and VUTS a.s. (Czech Republic) among others
TABLE OF CONTENTS
1 INTRODUCTION
- 1.1 STUDY OBJECTIVES
- 1.2 MARKET DEFINITION
- 1.3 STUDY SCOPE
- 1.3.1 MARKETS COVERED AND REGIONAL SCOPE
- 1.3.2 INCLUSIONS AND EXCLUSIONS
- 1.3.3 YEARS CONSIDERED
- 1.3.4 CURRENCY CONSIDERED
- 1.4 STAKEHOLDERS
2 RESEARCH METHODOLOGY
- 2.1 RESEARCH DATA
- 2.1.1 SECONDARY DATA
- 2.1.1.1 Key data from secondary sources
- 2.1.1.2 List of key secondary sources
- 2.1.2 PRIMARY DATA
- 2.1.2.1 Key data from primary sources
- 2.1.2.2 List of primary interview participants
- 2.1.2.3 Breakdown of primaries
- 2.1.2.4 Key industry insights
- 2.1.3 SECONDARY AND PRIMARY RESEARCH
- 2.1.1 SECONDARY DATA
- 2.2 MARKET SIZE ESTIMATION METHODOLOGY
- 2.2.1 BOTTOM-UP APPROACH
- 2.2.1.1 Approach to arrive at market size using bottom-up analysis (demand side)
- 2.2.2 TOP-DOWN APPROACH
- 2.2.2.1 Approach to arrive at market size using top-down analysis (supply side)
- 2.2.1 BOTTOM-UP APPROACH
- 2.3 MARKET BREAKDOWN AND DATA TRIANGULATION
- 2.4 RISK ANALYSIS
- 2.5 RESEARCH ASSUMPTIONS
- 2.6 RESEARCH LIMITATIONS
3 EXECUTIVE SUMMARY
4 PREMIUM INSIGHTS
- 4.1 ATTRACTIVE OPPORTUNITIES FOR PLAYERS IN 3D WEAVING MARKET
- 4.2 3D WEAVING MARKET, BY END-USE INDUSTRY
- 4.3 3D WEAVING MARKET, BY REGION
5 MARKET OVERVIEW
- 5.1 INTRODUCTION
- 5.2 MARKET DYNAMICS
- 5.2.1 DRIVERS
- 5.2.1.1 Surging demand for advanced lightweight composites across high-performance sectors
- 5.2.1.2 Accelerating EV adoption fuels demand for 3D-woven thermal-resistant components
- 5.2.1.3 Customization and complex geometry capabilities
- 5.2.1.4 Enhanced structural integrity and minimized material waste
- 5.2.2 RESTRAINTS
- 5.2.2.1 High capital investment and operational complexity
- 5.2.2.2 Regulatory and certification barriers increase time-to-market and operational costs
- 5.2.3 OPPORTUNITIES
- 5.2.3.1 Emergence of hybrid composites and smart textiles
- 5.2.3.2 Sustainable production through advanced 3D weaving technology
- 5.2.3.3 Rising demand for customized military and tactical gear
- 5.2.3.4 Expansion into marine and subsea engineering applications
- 5.2.4 CHALLENGES
- 5.2.4.1 Cybersecurity vulnerabilities threaten operational continuity in digitized 3D weaving environments
- 5.2.4.2 Intensifying competition, market saturation, profitability, and differentiation
- 5.2.4.3 Extended product development and qualification cycles
- 5.2.1 DRIVERS
- 5.3 TRENDS/DISRUPTIONS IMPACTING CUSTOMER BUSINESS
- 5.4 SUPPLY CHAIN ANALYSIS
- 5.5 ECOSYSTEM ANALYSIS
- 5.6 TECHNOLOGY ANALYSIS
- 5.6.1 KEY TECHNOLOGIES
- 5.6.1.1 Real-Time Monitoring & Feedback Control
- 5.6.1.2 Computer-Aided Design & Manufacturing (CAD/CAM)
- 5.6.2 COMPLEMENTARY TECHNOLOGIES
- 5.6.2.1 Simulation & Digital Twin Technology
- 5.6.2.2 AI & Machine Learning Algorithms
- 5.6.3 ADJACENT TECHNOLOGIES
- 5.6.3.1 Braiding Machines
- 5.6.1 KEY TECHNOLOGIES
- 5.7 PATENT ANALYSIS
- 5.8 TRADE ANALYSIS
- 5.8.1 IMPORT DATA FOR HS CODE 8446
- 5.8.2 EXPORT DATA FOR HS CODE 8446
- 5.9 TARIFF AND REGULATORY LANDSCAPE
- 5.9.1 TARIFF ANALYSIS
- 5.9.2 REGULATORY BODIES, GOVERNMENT AGENCIES, AND OTHER ORGANIZATIONS
- 5.9.3 KEY REGULATIONS
- 5.10 PORTER'S FIVE FORCE ANALYSIS
- 5.10.1 INTENSITY OF COMPETITIVE RIVALRY
- 5.10.2 THREAT OF SUBSTITUTES
- 5.10.3 BARGAINING POWER OF BUYERS
- 5.10.4 BARGAINING POWER OF SUPPLIERS
- 5.10.5 THREAT OF NEW ENTRANTS
- 5.11 KEY STAKEHOLDERS AND BUYING CRITERIA
- 5.11.1 KEY STAKEHOLDERS IN BUYING PROCESS
- 5.11.2 BUYING CRITERIA
- 5.12 IMPACT OF GEN AI/AI ON 3D WEAVING MARKET
- 5.13 IMPACT OF 2025 US TARIFFS-3D WEAVING MARKET
- 5.13.1 INTRODUCTION
- 5.13.2 KEY TARIFF RATES
- 5.13.3 PRICE IMPACT ANALYSIS
- 5.13.4 IMPACT ON COUNTRIES/REGIONS
- 5.13.4.1 US
- 5.13.4.2 Europe
- 5.13.4.3 Asia Pacific
- 5.13.5 IMPACT ON END-USE INDUSTRIES
6 3D WEAVING MARKET, BY PRODUCT TYPE
- 6.1 INTRODUCTION
- 6.2 GLASS FIBER WEAVING MACHINES
- 6.2.1 COST-EFFECTIVENESS, DURABILITY, AND SUSTAINABLE COMPOSITES TO DRIVE ADOPTION
- 6.3 COMPOSITE TEXTILE WEAVING MACHINES
- 6.3.1 VERSATLIITY AND MULTI-FIBER 3D FABRIC PRODUCTION TO DRIVE GROWTH
- 6.4 SPACER WEAVING MACHINES
- 6.4.1 SPACER WEAVING MACHINES OFFER BREATHABLE, CUSHIONED, AND STRUCTURALLY ADAPTIVE 3D FABRICS
- 6.5 CARBON FIBER WEAVING MACHINES
- 6.5.1 HIGH-PRECISION CARBON FIBER WEAVING MACHINES FOR LIGHTWEIGHT AND HIGH STRENGTH 3D STRUCTURES
- 6.6 CUSTOMIZED 3D WEAVING MACHINES
- 6.6.1 CUSTOMIZED MACHINES MEET COMPLEX, SPECIALIZED, AND HIGH PRECISION FABRICATION NEEDS
7 3D WEAVING MARKET, BY APPLICATION
- 7.1 INTRODUCTION
- 7.2 STRUCTURAL COMPONENTS
- 7.2.1 PRECISION-ENGINEERED 3D WOVEN PREFORMS FOR HIGH STRENGTH STRUCTURAL COMPONENT APPLICATIONS ACROSS CRITICAL INDUSTRIES
- 7.3 PROTECTIVE MATERIALS
- 7.3.1 3D WOVEN PROTECTIVE MATERIALS FOR IMPACT AND SAFETY APPLICATIONS
- 7.4 REINFORCEMENTS
- 7.4.1 REINFORCEMENT FABRICS MADE WITH 3D WEAVING FOR STRONGER COMPOSITES
- 7.5 INSULATION
- 7.5.1 3D WOVEN MATERIALS FOR THERMAL AND SOUND INSULATION USES
- 7.6 LOAD-BEARING COMPOSITES
- 7.6.1 DURABLE 3D WOVEN COMPOSITES FOR SUPPORTING HEAVY LOADS
- 7.7 DECORATIVE/DESIGN APPLICATIONS
- 7.7.1 CUSTOM 3D WOVEN FABRICS FOR AESTHETIC AND FUNCTIONAL DESIGN NEEDS
- 7.8 THERMAL PROTECTION APPLICATIONS
- 7.8.1 HEAT-RESISTANT 3D WOVEN MATERIALS FOR HIGH TEMPERATURE ENVIRONMENTS
8 3D WEAVING MARKET, BY END-USE INDUSTRY
- 8.1 INTRODUCTION
- 8.2 AEROSPACE & DEFENSE
- 8.2.1 LEADING DEMAND FOR LIGHTWEIGHT AND HIGH-STRENGTH COMPOSITE STRUCTURES
- 8.3 AUTOMOTIVE
- 8.3.1 ACCELERATING ADOPTION OF 3D WOVEN COMPONENTS IN LIGHTWEIGHT VEHICLE PLATFORMS
- 8.4 CONSTRUCTION & INFRASTRUCTURE
- 8.4.1 ENHANCING STRUCTURAL DURABILITY WITH 3D WOVEN REINFORCEMENTS
- 8.5 SPORTING GOODS
- 8.5.1 SUPPORTING PERFORMANCE AND SAFETY IN LIGHTWEIGHT EQUIPMENT DESIGN
- 8.6 ENERGY & GOODS
- 8.6.1 DELIVERING DURABLE COMPOSITES FOR WIND AND THERMAL APPLICATIONS
- 8.7 HEALTHCARE
- 8.7.1 ENABLING ERGONOMIC, BREATHABLE, AND BIOCOMPATIBLE COMPOSITE PRODUCTS
- 8.8 OTHER END-USE INDUSTRIES
9 3D WEAVING MARKET, BY REGION
- 9.1 INTRODUCTION
- 9.2 NORTH AMERICA
- 9.2.1 MACROECONOMIC OUTLOOK FOR NORTH AMERICA
- 9.2.2 US
- 9.2.2.1 Technological leadership and high-value application demand
- 9.2.3 CANADA
- 9.2.3.1 Emerging market with R&D-driven growth showcases opportunities
- 9.2.4 MEXICO
- 9.2.4.1 Industrial expansion and localization of composite manufacturing
- 9.3 EUROPE
- 9.3.1 MACROECONOMIC OUTLOOK FOR EUROPE
- 9.3.2 UK
- 9.3.2.1 Advanced R&D and aerospace-centric adoption
- 9.3.3 GERMANY
- 9.3.3.1 Automotive lightweighting and infrastructure composites
- 9.3.4 FRANCE
- 9.3.4.1 Energy sector composites and advanced protective materials
- 9.3.5 SPAIN
- 9.3.5.1 Renewable energy infrastructure and technical construction materials
- 9.3.6 ITALY
- 9.3.6.1 Design-centric innovation and marine industry adoption to support demand
- 9.3.7 REST OF EUROPE
- 9.4 ASIA PACIFIC
- 9.4.1 MACROECONOMIC OUTLOOK FOR ASIA PACIFIC
- 9.4.2 CHINA
- 9.4.2.1 Industrial scaling and infrastructure-based demand
- 9.4.3 JAPAN
- 9.4.3.1 Precision engineering and consumer electronics applications
- 9.4.4 INDIA
- 9.4.4.1 Defense innovation and infrastructure growth to propel adoption
- 9.4.5 REST OF ASIA PACIFIC
- 9.5 REST OF THE WORLD
- 9.5.1 MIDDLE EAST & AFRICA
- 9.5.1.1 Emerging applications and strategic infrastructure focus driving market growth
- 9.5.2 SOUTH AMERICA
- 9.5.2.1 Localized innovation and sustainable manufacturing drive adoption
- 9.5.1 MIDDLE EAST & AFRICA
10 COMPETITIVE LANDSCAPE
- 10.1 OVERVIEW
- 10.2 KEY PLAYER STRATEGIES/RIGHT TO WIN, 2024-2025
- 10.3 MARKET SHARE ANALYSIS, 2024
- 10.4 PRODUCT/BRAND COMPARISON
- 10.5 COMPANY EVALUATION MATRIX: KEY PLAYERS, 2024
- 10.5.1 STARS
- 10.5.2 EMERGING LEADERS
- 10.5.3 PERVASIVE PLAYERS
- 10.5.4 PARTICIPANTS
- 10.5.5 COMPANY FOOTPRINT: KEY PLAYERS, 2024
- 10.5.5.1 Company footprint
- 10.5.5.2 Region Footprint
- 10.5.5.3 Product Type Footprint
- 10.5.5.4 Application Footprint
- 10.5.5.5 End-use Industry footprint
- 10.6 COMPETITIVE SCENARIO
- 10.6.1 DEALS
11 COMPANY PROFILES
- 11.1 INTRODUCTION
- 11.2 KEY PLAYERS
- 11.2.1 LINDAUER DORNIER GMBH
- 11.2.1.1 Business overview
- 11.2.1.2 Products/Solutions/Services offered
- 11.2.1.3 MnM view
- 11.2.1.3.1 Key strengths/Right to win
- 11.2.1.3.2 Strategic choices
- 11.2.1.3.3 Weaknesses/Competitive threats
- 11.2.2 STAUBLI INTERNATIONAL AG
- 11.2.2.1 Business overview
- 11.2.2.2 Products/Solutions/Services offered
- 11.2.2.3 MnM view
- 11.2.2.3.1 Key strengths/Right to win
- 11.2.2.3.2 Strategic choices
- 11.2.2.3.3 Weaknesses/Competitive threats
- 11.2.3 UNSPUN
- 11.2.3.1 Business overview
- 11.2.3.2 Products/Solutions/Services offered
- 11.2.3.3 Recent developments
- 11.2.3.3.1 Deals
- 11.2.3.4 MnM view
- 11.2.3.4.1 Key strengths/Right to win
- 11.2.3.4.2 Strategic choices
- 11.2.3.4.3 Weaknesses/Competitive threats
- 11.2.4 DASHMESH JACQUARD AND POWERLOOM PVT. LTD.
- 11.2.4.1 Business overview
- 11.2.4.2 Products/Solutions/Services offered
- 11.2.4.3 MnM view
- 11.2.4.3.1 Key strengths/Right to win
- 11.2.4.3.2 Strategic choices
- 11.2.4.3.3 Weaknesses/Competitive threats
- 11.2.5 VUTS A.S.
- 11.2.5.1 Business overview
- 11.2.5.2 Products/Solutions/Services offered
- 11.2.5.3 MnM view
- 11.2.5.3.1 Key strengths/Right to win
- 11.2.5.3.2 Strategic choices
- 11.2.5.3.3 Weaknesses/Competitive threats
- 11.2.6 HEFEI FANYUAN INSTRUMENT CO., LTD.
- 11.2.6.1 Business overview
- 11.2.6.2 Products/Solutions/Services offered
- 11.2.7 SINO TEXTILE MACHINERY
- 11.2.7.1 Business overview
- 11.2.7.2 Products/Solutions/Services offered
- 11.2.8 OPTIMA 3D LTD
- 11.2.8.1 Business overview
- 11.2.8.2 Products/Solutions/Services offered
- 11.2.9 KALE TEXNIQUE
- 11.2.9.1 Business overview
- 11.2.9.2 Products/Solutions/Services offered
- 11.2.10 MARJAN POLYMER INDUSTRIES
- 11.2.10.1 Business overview
- 11.2.10.2 Products/Solutions/Services offered
- 11.2.1 LINDAUER DORNIER GMBH
- 11.3 OTHER PLAYERS
- 11.3.1 ALBANY INTERNATIONAL CORP.
- 11.3.2 TEX TECH INDUSTRIES
- 11.3.3 TEXONIC
- 11.3.4 TEXTUM OPCO, LLC
- 11.3.5 SPIRIT AEROSYSTEMS, INC.
- 11.3.6 BALLY RIBBON MILLS
- 11.3.7 TANTRA COMPOSITE TECHNOLOGIES PVT. LTD.
- 11.3.8 CETRIKO
- 11.3.9 EAT GMBH
- 11.3.10 3D WEAVING
12 APPENDIX
- 12.1 INSIGHTS FROM INDUSTRY EXPERTS
- 12.2 DISCUSSION GUIDE
- 12.3 KNOWLEDGESTORE: MARKETSANDMARKETS' SUBSCRIPTION PORTAL
- 12.4 CUSTOMIZATION OPTIONS
- 12.5 RELATED REPORTS
- 12.6 AUTHOR DETAILS
List of Tables
- TABLE 1 3D WEAVING MARKET: RISK ANALYSIS
- TABLE 2 ROLE OF KEY PLAYERS IN 3D WEAVING ECOSYSTEM
- TABLE 3 LIST OF KEY PATENTS IN 3D WEAVING MARKET, 2022-2025
- TABLE 4 IMPORT DATA FOR PRODUCTS COVERED UNDER HS CODE 8446, BY COUNTRY, 2020-2024 (USD MILLION)
- TABLE 5 EXPORT DATA FOR PRODUCTS COVERED UNDER HS CODE 8446, BY COUNTRY, 2020-2024 (USD MILLION)
- TABLE 6 MFN TARIFF FOR HS CODE 8446-COMPLIANT PRODUCTS EXPORTED BY CHINA, 2025
- TABLE 7 NORTH AMERICA: REGULATORY BODIES, GOVERNMENT AGENCIES, AND OTHER ORGANIZATIONS
- TABLE 8 EUROPE: REGULATORY BODIES, GOVERNMENT AGENCIES, AND OTHER ORGANIZATIONS
- TABLE 9 ASIA PACIFIC: REGULATORY BODIES, GOVERNMENT AGENCIES, AND OTHER ORGANIZATIONS
- TABLE 10 REST OF THE WORLD: REGULATORY BODIES, GOVERNMENT AGENCIES, AND OTHER ORGANIZATIONS
- TABLE 11 3D WEAVING MARKET: REGULATORY LANDSCAPE
- TABLE 12 3D WEAVING MARKET: PORTER'S FIVE FORCES ANALYSIS
- TABLE 13 INFLUENCE OF STAKEHOLDERS ON BUYING PROCESS FOR TOP THREE APPLICATIONS
- TABLE 14 KEY BUYING CRITERIA, BY APPLICATION
- TABLE 15 US ADJUSTED RECIPROCAL TARIFF RATES
- TABLE 16 3D WEAVING MARKET, BY PRODUCT TYPE, 2021-2024 (USD THOUSAND)
- TABLE 17 3D WEAVING MARKET, BY PRODUCT TYPE, 2025-2030 (USD THOUSAND)
- TABLE 18 GLASS FIBER WEAVING MACHINES: 3D WEAVING MARKET, BY END-USE INDUSTRY, 2021-2024 (USD THOUSAND)
- TABLE 19 GLASS FIBER WEAVING MACHINES: 3D WEAVING MARKET, BY END-USE INDUSTRY, 2025-2030 (USD THOUSAND)
- TABLE 20 COMPOSITE TEXTILE WEAVING MACHINES: 3D WEAVING MARKET, BY END-USE INDUSTRY, 2021-2024 (USD THOUSAND)
- TABLE 21 COMPOSITE TEXTILE WEAVING MACHINES: 3D WEAVING MARKET, BY END-USE INDUSTRY, 2025-2030 (USD THOUSAND)
- TABLE 22 SPACER WEAVING MACHINES: 3D WEAVING MARKET, BY END-USE INDUSTRY, 2021-2024 (USD THOUSAND)
- TABLE 23 SPACER WEAVING MACHINES: 3D WEAVING MARKET, BY END-USE INDUSTRY, 2025-2030 (USD THOUSAND)
- TABLE 24 CARBON FIBER WEAVING MACHINES: 3D WEAVING MARKET, BY END-USE INDUSTRY, 2021-2024 (USD THOUSAND)
- TABLE 25 CARBON FIBER WEAVING MACHINES: 3D WEAVING MARKET, BY END-USE INDUSTRY, 2025-2030 (USD THOUSAND)
- TABLE 26 CUSTOMIZED 3D WEAVING MACHINES: 3D WEAVING MARKET, BY END-USE INDUSTRY, 2021-2024 (USD THOUSAND)
- TABLE 27 CUSTOMIZED 3D WEAVING MACHINES: 3D WEAVING MARKET, BY END-USE INDUSTRY, 2025-2030 (USD THOUSAND)
- TABLE 28 3D WEAVING MARKET, BY APPLICATION, 2021-2024 (USD THOUSAND)
- TABLE 29 3D WEAVING MARKET, BY APPLICATION, 2025-2030 (USD THOUSAND)
- TABLE 30 3D WEAVING MARKET, BY END-USE INDUSTRY, 2021-2024 (USD THOUSAND)
- TABLE 31 3D WEAVING MARKET, BY END-USE INDUSTRY, 2025-2030 (USD THOUSAND)
- TABLE 32 AEROSPACE & DEFENSE: 3D WEAVING MARKET, BY PRODUCT TYPE, 2021-2024 (USD THOUSAND)
- TABLE 33 AEROSPACE & DEFENSE: 3D WEAVING MARKET, BY PRODUCT TYPE, 2025-2030 (USD THOUSAND)
- TABLE 34 AUTOMOTIVE: 3D WEAVING MARKET, BY PRODUCT TYPE, 2021-2024 (USD THOUSAND)
- TABLE 35 AUTOMOTIVE: 3D WEAVING MARKET, BY PRODUCT TYPE, 2025-2030 (USD THOUSAND)
- TABLE 36 CONSTRUCTION & INFRASTRUCTURE: 3D WEAVING MARKET, BY PRODUCT TYPE, 2021-2024 (USD THOUSAND)
- TABLE 37 CONSTRUCTION & INFRASTRUCTURE: 3D WEAVING MARKET, BY PRODUCT TYPE, 2025-2030 (USD THOUSAND)
- TABLE 38 SPORTING GOODS: 3D WEAVING MARKET, BY PRODUCT TYPE, 2021-2024 (USD THOUSAND)
- TABLE 39 SPORTING GOODS: 3D WEAVING MARKET, BY PRODUCT TYPE, 2025-2030 (USD THOUSAND)
- TABLE 40 ENERGY & GOODS: 3D WEAVING MARKET, BY PRODUCT TYPE, 2021-2024 (USD THOUSAND)
- TABLE 41 ENERGY & GOODS: 3D WEAVING MARKET, BY PRODUCT TYPE, 2025-2030 (USD THOUSAND)
- TABLE 42 HEALTHCARE: 3D WEAVING MARKET, BY PRODUCT TYPE, 2021-2024 (USD THOUSAND)
- TABLE 43 HEALTHCARE: 3D WEAVING MARKET, BY PRODUCT TYPE, 2025-2030 (USD THOUSAND)
- TABLE 44 OTHER END-USE INDUSTRIES: 3D WEAVING MARKET, BY PRODUCT TYPE, 2021-2024 (USD THOUSAND)
- TABLE 45 OTHER END-USE INDUSTRIES: 3D WEAVING MARKET, BY PRODUCT TYPE, 2025-2030 (USD THOUSAND)
- TABLE 46 3D WEAVING MARKET, BY REGION, 2021-2024 (USD THOUSAND)
- TABLE 47 3D WEAVING MARKET, BY REGION, 2025-2030 (USD THOUSAND)
- TABLE 48 NORTH AMERICA: 3D WEAVING MARKET, BY COUNTRY, 2021-2024 (USD THOUSAND)
- TABLE 49 NORTH AMERICA: 3D WEAVING MARKET, BY COUNTRY, 2025-2030 (USD THOUSAND)
- TABLE 50 NORTH AMERICA: 3D WEAVING MARKET, BY END-USE INDUSTRY, 2021-2024 (USD THOUSAND)
- TABLE 51 NORTH AMERICA: 3D WEAVING MARKET, BY END-USE INDUSTRY, 2025-2030 (USD THOUSAND)
- TABLE 52 EUROPE: 3D WEAVING MARKET, BY COUNTRY, 2021-2024 (USD THOUSAND)
- TABLE 53 EUROPE: 3D WEAVING MARKET, BY COUNTRY, 2025-2030 (USD THOUSAND)
- TABLE 54 EUROPE: 3D WEAVING MARKET, BY END-USE INDUSTRY, 2021-2024 (USD THOUSAND)
- TABLE 55 EUROPE: 3D WEAVING MARKET, BY END-USE INDUSTRY, 2025-2030 (USD THOUSAND)
- TABLE 56 ASIA PACIFIC: 3D WEAVING MARKET, BY COUNTRY, 2021-2024 (USD THOUSAND)
- TABLE 57 ASIA PACIFIC: 3D WEAVING MARKET, BY COUNTRY, 2025-2030 (USD THOUSAND)
- TABLE 58 ASIA PACIFIC: 3D WEAVING MARKET, BY END-USE INDUSTRY, 2021-2024 (USD THOUSAND)
- TABLE 59 ASIA PACIFIC: 3D WEAVING MARKET, BY END-USE INDUSTRY, 2025-2030 (USD THOUSAND)
- TABLE 60 REST OF THE WORLD: 3D WEAVING MARKET, BY REGION, 2021-2024 (USD THOUSAND)
- TABLE 61 REST OF THE WORLD: 3D WEAVING MARKET, BY REGION, 2025-2030 (USD THOUSAND)
- TABLE 62 REST OF THE WORLD: 3D WEAVING MARKET, BY END-USE INDUSTRY, 2021-2024 (USD THOUSAND)
- TABLE 63 REST OF THE WORLD: 3D WEAVING MARKET, BY END-USE INDUSTRY, 2025-2030 (USD THOUSAND)
- TABLE 64 3D WEAVING MARKET: KEY PLAYER STRATEGIES/RIGHT TO WIN, 2024-2025
- TABLE 65 3D WEAVING MARKET: DEGREE OF COMPETITION
- TABLE 66 3D WEAVING MARKET: REGION FOOTPRINT
- TABLE 67 3D WEAVING MARKET: PRODUCT TYPE FOOTPRINT
- TABLE 68 3D WEAVING MARKET: APPLICATION FOOTPRINT
- TABLE 69 3D WEAVING MARKET: END-USE INDUSTRY FOOTPRINT
- TABLE 70 3D WEAVING: DEALS, JANUARY 2023-JUNE 2025
- TABLE 71 LINDAUER DORNIER GMBH: COMPANY OVERVIEW
- TABLE 72 LINDAUER DORNIER GMBH: PRODUCTS/SOLUTIONS/SERVICES OFFERED
- TABLE 73 STAUBLI INTERNATIONAL AG: COMPANY OVERVIEW
- TABLE 74 STAUBLI INTERNATIONAL AG: PRODUCTS/SOLUTIONS/SERVICES OFFERED
- TABLE 75 UNSPUN: COMPANY OVERVIEW
- TABLE 76 UNSPUN: PRODUCTS/SOLUTIONS/SERVICES OFFERED
- TABLE 77 UNSPUN: DEALS (JANUARY 2023- JUNE 2025)
- TABLE 78 DASHMESH JACQUARD AND POWERLOOM PVT. LTD.: COMPANY OVERVIEW
- TABLE 79 DASHMESH JACQUARD AND POWERLOOM PVT. LTD.: PRODUCTS/SOLUTIONS/SERVICES OFFERED
- TABLE 80 VUTS A.S.: COMPANY OVERVIEW
- TABLE 81 VUTS A.S.: PRODUCTS/SOLUTIONS/SERVICES OFFERED
- TABLE 82 HEFEI FANYUAN INSTRUMENT CO., LTD.: COMPANY OVERVIEW
- TABLE 83 HEFEI FANYUAN INSTRUMENT CO., LTD.: PRODUCTS/SOLUTIONS/SERVICES OFFERED
- TABLE 84 SINO TEXTILE MACHINERY: COMPANY OVERVIEW
- TABLE 85 SINO TEXTILE MACHINERY: PRODUCTS/SOLUTIONS/SERVICES OFFERED
- TABLE 86 OPTIMA 3D LTD: COMPANY OVERVIEW
- TABLE 87 OPTIMA 3D LTD: PRODUCTS/SOLUTIONS/SERVICES OFFERED
- TABLE 88 KALE TEXNIQUE: COMPANY OVERVIEW
- TABLE 89 KALE TEXNIQUE: PRODUCTS/SOLUTIONS/SERVICES OFFERED
- TABLE 90 MARJAN POLYMER INDUSTRIES: COMPANY OVERVIEW
- TABLE 91 MARJAN POLYMER INDUSTRIES: PRODUCTS/SOLUTIONS/SERVICES OFFERED
- TABLE 92 ALBANY INTERNATIONAL CORP.: COMPANY OVERVIEW
- TABLE 93 TEX TECH INDUSTRIES: COMPANY OVERVIEW
- TABLE 94 TEXONIC: COMPANY OVERVIEW
- TABLE 95 TEXTUM OPCO, LLC: COMPANY OVERVIEW
- TABLE 96 SPIRIT AEROSYSTEMS, INC.: COMPANY OVERVIEW
- TABLE 97 BALLY RIBBON MILLS: COMPANY OVERVIEW
- TABLE 98 TANTRA COMPOSITE TECHNOLOGIES PVT. LTD.: COMPANY OVERVIEW
- TABLE 99 CETRIKO: COMPANY OVERVIEW
- TABLE 100 EAT GMBH: COMPANY OVERVIEW
- TABLE 101 3D WEAVING: COMPANY OVERVIEW
List of Figures
- FIGURE 1 3D WEAVING MARKET SEGMENTATION AND REGIONAL SCOPE
- FIGURE 2 3D WEAVING MARKET: RESEARCH DESIGN
- FIGURE 3 3D WEAVING MARKET SIZE ESTIMATION METHODOLOGY-APPROACH 1 (SUPPLY SIDE)
- FIGURE 4 3D WEAVING MARKET SIZE ESTIMATION METHODOLOGY-APPROACH 2 (DEMAND SIDE)
- FIGURE 5 3D WEAVING MARKET: BOTTOM-UP APPROACH
- FIGURE 6 3D WEAVING MARKET: TOP-DOWN APPROACH
- FIGURE 7 3D WEAVING MARKET: DATA TRIANGULATION
- FIGURE 8 3D WEAVING MARKET: RESEARCH ASSUMPTIONS
- FIGURE 9 3D WEAVING MARKET: RESEARCH LIMITATIONS
- FIGURE 10 3D WEAVING MARKET SIZE PROJECTIONS, 2021-2030 (USD THOUSAND)
- FIGURE 11 CARBON FIBER WEAVING MACHINES TO DOMINATE MARKET BETWEEN 2025 AND 2030
- FIGURE 12 STRUCTURAL COMPONENTS TO HOLD LARGEST SHARE, BY APPLICATION, IN 2025
- FIGURE 13 ASIA PACIFIC TO EXHIBIT HIGHEST CAGR IN 3D WEAVING MARKET FROM 2025 TO 2030
- FIGURE 14 GROWTH OF AEROSPACE AND AUTOMOTIVE SECTORS TO PROVIDE LUCRATIVE OPPORTUNITIES IN 3D WEAVING MARKET
- FIGURE 15 AEROSPACE & DEFENSE SEGMENT TO DOMINATE MARKET FROM 2025 TO 2030
- FIGURE 16 ASIA PACIFIC TO DOMINATE 3D WEAVING MARKET FROM 2025 TO 2030
- FIGURE 17 3D WEAVING MARKET: DRIVERS, RESTRAINTS, OPPORTUNITIES, AND CHALLENGES
- FIGURE 18 DRIVERS: 3D WEAVING MARKET
- FIGURE 19 RESTRAINTS: 3D WEAVING MARKET
- FIGURE 20 OPPORTUNITIES: 3D WEAVING MARKET
- FIGURE 21 CHALLENGES: 3D WEAVING MARKET
- FIGURE 22 REVENUE SHIFT AND NEW REVENUE POCKETS FOR PLAYERS IN 3D WEAVING MARKET
- FIGURE 23 3D WEAVING MARKET: SUPPLY CHAIN ANALYSIS
- FIGURE 24 KEY PLAYERS IN 3D WEAVING ECOSYSTEM
- FIGURE 25 NUMBER OF PATENTS GRANTED IN 3D WEAVING MARKET, 2015-2024
- FIGURE 26 IMPORT DATA FOR PRODUCTS COVERED UNDER HS CODE 8446, BY COUNTRY, 2020-2024 (USD MILLION)
- FIGURE 27 EXPORT DATA FOR PRODUCTS COVERED UNDER HS CODE 8446, BY COUNTRY, 2020-2024 (USD MILLION)
- FIGURE 28 3D WEAVING MARKET: PORTER'S FIVE FORCES ANALYSIS
- FIGURE 29 INFLUENCE OF STAKEHOLDERS ON BUYING PROCESS FOR TOP THREE APPLICATIONS
- FIGURE 30 KEY BUYING CRITERIA FOR TOP THREE APPLICATIONS
- FIGURE 31 IMPACT OF GEN AI/AI ON 3D WEAVING MARKET
- FIGURE 32 CARBON FIBER WEAVING MACHINES SEGMENT TO ACCOUNT FOR LARGEST MARKET SHARE IN 2030
- FIGURE 33 STRUCTURAL COMPONENTS SEGMENT TO ACCOUNT FOR LARGEST MARKET SHARE IN 2030
- FIGURE 34 AEROSPACE & DEFENSE SEGMENT TO ACCOUNT FOR LARGEST MARKET SHARE IN 2030
- FIGURE 35 ASIA PACIFIC TO RECORD HIGHEST CAGR BETWEEN 2025 AND 2030
- FIGURE 36 NORTH AMERICA: 3D WEAVING MARKET SNAPSHOT
- FIGURE 37 EUROPE: 3D WEAVING MARKET SNAPSHOT
- FIGURE 38 ASIA PACIFIC: 3D WEAVING MARKET SNAPSHOT
- FIGURE 39 MIDDLE EAST & AFRICA TO HOLD LARGEST SHARE OF 3D WEAVING MARKET IN 2025
- FIGURE 40 MARKET SHARE ANALYSIS OF COMPANIES OFFERING 3D WEAVING MACHINES, 2024
- FIGURE 41 3D WEAVING MARKET: PRODUCT/ BRAND COMPARISON
- FIGURE 42 3D WEAVING MARKET: COMPANY EVALUATION MATRIX (KEY PLAYERS), 2024
- FIGURE 43 3D WEAVING MARKET: COMPANY FOOTPRINT

