
PUBLISHER: MarketsandMarkets | PRODUCT CODE: 1783247

PUBLISHER: MarketsandMarkets | PRODUCT CODE: 1783247
SCADA Market by Component (Programmable Logic Controllers, Remote Terminal Units, Human-machine Interfaces, Communication Systems, Input/Output Devices, Sensors, Actuators, Terminal Blocks, Connectors) - Global Forecast to 2030
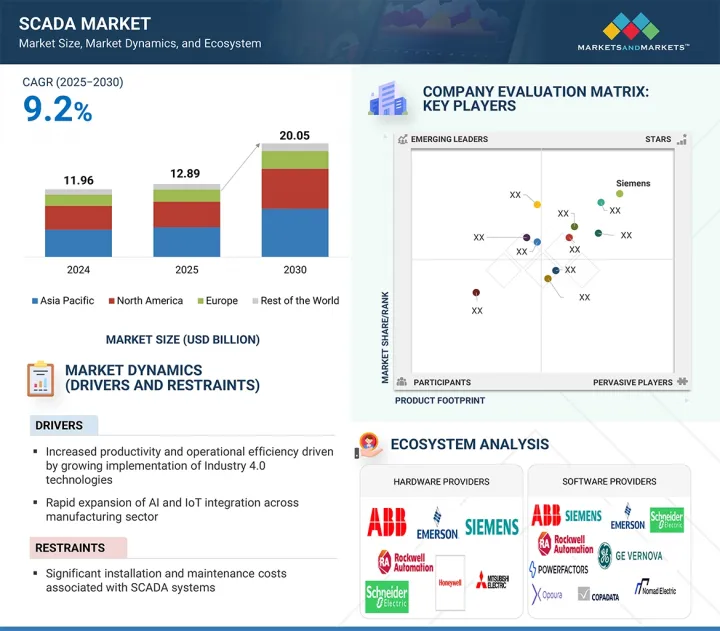
With a CAGR of 9.2%, the global SCADA market is expected to grow from USD 12.89 billion in 2025 to USD 20.05 billion by 2030. Growth will be driven by increasing automation across utilities, discrete manufacturing, and process industries, along with rising investments in infrastructure digitalization. As industries seek to improve real-time visibility, operational efficiency, and system resilience, SCADA solutions are playing a key role in enabling centralized monitoring and intelligent control. Utility sectors such as power, water and wastewater treatment, transportation, and telecommunications are implementing SCADA systems to modernize legacy networks and ensure service continuity.
| Scope of the Report | |
|---|---|
| Years Considered for the Study | 2021-2030 |
| Base Year | 2024 |
| Forecast Period | 2025-2030 |
| Units Considered | Value (USD Billion) |
| Segments | By Offering, End User, and Region |
| Regions covered | North America, Europe, APAC, RoW |
Discrete industries like electronics and semiconductors are using SCADA for precise manufacturing, while process sectors such as food & beverage depend on it for quality assurance and regulatory compliance. The integration of SCADA with industrial IoT, AI-based analytics, and cloud platforms is further transforming its capabilities, supporting predictive maintenance, data-driven decisions, and scalable deployment models. As global industries pursue smarter operations and digital infrastructure, the demand for advanced SCADA systems is expected to grow rapidly across key application sectors.
" Rising demand for operational support to drive growth of services segment in the SCADA market."
The services segment is expected to grow at a significant CAGR in the SCADA market, driven by increasing demand for system integration, remote support, and lifecycle maintenance across industrial and utility operations. As SCADA systems become more complex and essential for real-time decision-making, organizations are emphasizing service offerings that ensure system reliability, cybersecurity, and performance optimization. The shift toward cloud-based SCADA, remote monitoring, and predictive maintenance is further increasing the need for professional and managed services. Additionally, as industries pursue digital transformation strategies, the demand for technical consulting, system upgrades, and training services continues to grow. These services not only help reduce downtime but also maximize the value of SCADA infrastructure investments. With the rising focus on efficiency, safety, and regulatory compliance, the services segment is set to play a key role in supporting the long-term growth and expansion of SCADA deployments across various sectors.
" Discrete manufacturing to emerge as the fastest growing end-use segment in the SCADA market "
The discrete manufacturing segment is expected to experience the highest CAGR in the SCADA market during the forecast period, driven by the rapid adoption of smart factory frameworks and industrial automation technologies. Industries such as automotive, semiconductor, and electronics are increasingly investing in SCADA solutions to optimize operations, enable real-time data-driven decisions, and maintain product quality in highly competitive markets. Among these, the semiconductor and electronics industry is projected to grow the fastest, due to the need for precise control, advanced monitoring capabilities, and greater production flexibility. The integration of SCADA systems helps manufacturers improve process transparency, reduce downtime, and support predictive maintenance strategies. As discrete manufacturers focus on operational efficiency and digital transformation, SCADA is becoming a vital component for scalable, agile, and cost-effective production environments.
" Industrial automation and smart infrastructure initiatives to accelerate SCADA market growth in Asia Pacific "
Asia Pacific is expected to have the highest CAGR in the SCADA market during the forecast period, driven by rapid industrial growth, increasing infrastructure investments, and the faster adoption of automation across key sectors. Countries like China, India, Japan, and South Korea are improving their smart manufacturing capabilities and modernizing utility networks, which increases demand for SCADA systems. Government efforts focused on digital transformation, smart grid development, and intelligent transportation further support market growth. Additionally, the region's strong presence in electronics and automotive manufacturing is boosting the adoption of SCADA solutions to improve productivity, ensure operational continuity, and enhance asset performance. As the need for scalable, real-time control systems grows across industries, Asia Pacific is expected to become the fastest-growing region in the global SCADA market.
Breakdown of primaries
A variety of executives from key organizations operating in the SCADA market were interviewed in-depth, including CEOs, marketing directors, and innovation and technology directors.
- By Company Type: Tier 1 -45%, Tier 2 - 35%, and Tier 3 - 20%
- By Designation: Directors - 45%, C-level - 30%, and Others - 25%
- By Region: North America - 45%, Europe - 25%, Asia Pacific - 20%, and RoW - 10%
Note: Other designations include sales and product managers and project engineers. The three tiers of the companies are defined based on their total revenue in 2024: Tier 1 - revenue greater than or equal to USD 1 billion; Tier 2 - revenue between USD 100 million and USD 1 billion; and Tier 3 revenue less than or equal to USD 100 million.
Major players featured in this report include: Rockwell Automation (US), ABB (Switzerland), Schneider Electric (France), Emerson Electric Co. (US), Siemens (Germany), GE Vernova (US), Honeywell International Inc. (US), Mitsubishi Electric Corporation (Japan), OMRON Corporation (Japan), Yokogawa Electric Corporation (Japan), Capula Ltd (UK), Ing. Punzenberger COPA-DATA GmbH (Austria), Data Flow Systems (US), Power Factors (US), eLynx Technologies, LLC. (US), EMR Integrated Solutions (Ireland), Inductive Automation, LLC. (US), JFE Engineering Corporation (Japan), Ovak Technologies (Armenia), Pilz GmbH & Co. KG (Germany), Sprecher Automation GmbH (Austria), Survalent Technology Corporation (Canada), Willowglen Systems (Canada), and Trihedral Engineering Limited (Canada). These leading companies have a broad product portfolio and maintain a strong presence in both established and emerging markets.
The study provides a detailed competitive analysis of these key players in the SCADA market, presenting their company profiles, most recent developments, and key market strategies.
Research Coverage
In this report, the SCADA market is segmented by offering, end user, and region. The offer segment includes hardware, software, and services. The end user segment covers process industries, discrete manufacturing, and utilities. The market is divided into four regions - North America, Asia Pacific, Europe, and Rest of the World (RoW).
Reasons to Buy the Report
The report will assist leaders and new entrants in this market by providing estimated revenue figures for the overall market and its sub-segments. It will help stakeholders understand the competitive landscape and gain insights to better position their businesses and develop appropriate go-to-market strategies. Additionally, the report offers insights into the SCADA market's current state and highlights key market drivers, restraints, challenges, and opportunities.
Key Benefits of Buying the Report
- Analysis of key drivers (increased productivity and operational efficiency driven by growing implementation of Industry 4.0 technologies, rapid expansion of AI and IoT integration across the manufacturing sector, increasing adoption of industrial mobility solutions fueled by rising market demand, increasing rollout of smart city developments, growing governmental backing for the adoption of SCADA systems and unprecedented scale of renewable energy deployment, distributed and remote nature of renewable energy sources), restraints (significant installation and maintenance costs associated with SCADA systems and high complexity and extensive customization requirements of SCADA systems), opportunities (swift progress in wireless sensor network development, shift from on-premise SCADA infrastructure to cloud-based solutions, leveraging SCADA-big data integration for enhanced operational intelligence and growing implementation of SCADA systems across transportation, smart buildings, and agricultural sectors, floating solar SCADA solutions), and challenges (vulnerability of SCADA systems to cybersecurity threats and incompatibility between communication protocols in SCADA systems) influencing the growth of the SCADA market.
- Product Development/Innovation: Detailed insights on upcoming technologies, research & development activities, and new product launches in the SCADA market
- Market Development: Comprehensive information about lucrative markets - the report analyzes the SCADA market across varied regions
- Market Diversification: Exhaustive information about new products/services, untapped geographies, recent developments, and investments in the SCADA market
- Competitive Assessment: In-depth assessment of market share, growth strategies, and service offerings of leading players such as Rockwell Automation (US), Schneider Electric (France), ABB (Switzerland), Siemens (Germany), Emerson Electric Co. (US) , and others.
TABLE OF CONTENTS
1 INTRODUCTION
- 1.1 STUDY OBJECTIVES
- 1.2 MARKET DEFINITION
- 1.3 STUDY SCOPE
- 1.3.1 MARKETS COVERED
- 1.3.2 INCLUSIONS AND EXCLUSIONS
- 1.3.3 YEARS CONSIDERED
- 1.4 CURRENCY CONSIDERED
- 1.5 UNITS CONSIDERED
- 1.6 STAKEHOLDERS
- 1.7 LIMITATIONS
- 1.8 SUMMARY OF CHANGES
2 RESEARCH METHODOLOGY
- 2.1 INTRODUCTION
- 2.1.1 SECONDARY AND PRIMARY RESEARCH
- 2.1.2 SECONDARY DATA
- 2.1.2.1 Major secondary sources
- 2.1.2.2 Key data from secondary sources
- 2.1.3 PRIMARY DATA
- 2.1.3.1 Key primary interviews with experts
- 2.1.3.2 Key data from primary sources
- 2.1.3.3 Key industry insights
- 2.1.3.4 Breakdown of primary interviews
- 2.2 MARKET SIZE ESTIMATION
- 2.2.1 BOTTOM-UP APPROACH
- 2.2.1.1 Market size estimation using bottom-up approach (demand side)
- 2.2.2 TOP-DOWN APPROACH
- 2.2.2.1 Market size estimation using top-down approach (supply side)
- 2.2.1 BOTTOM-UP APPROACH
- 2.3 DATA TRIANGULATION
- 2.4 RESEARCH ASSUMPTIONS AND LIMITATIONS
- 2.4.1 RESEARCH ASSUMPTIONS
- 2.4.2 RESEARCH LIMITATIONS
- 2.5 RISK ASSESSMENT
3 EXECUTIVE SUMMARY
4 PREMIUM INSIGHTS
- 4.1 ASIA PACIFIC TO CREATE LUCRATIVE OPPORTUNITIES FOR PLAYERS IN SCADA MARKET
- 4.2 SCADA MARKET, BY OFFERING
- 4.3 SCADA MARKET, BY END USER
- 4.4 SCADA MARKET, BY REGION/COUNTRY
5 MARKET OVERVIEW
- 5.1 INTRODUCTION
- 5.2 MARKET DYNAMICS
- 5.2.1 DRIVERS
- 5.2.1.1 Increased productivity and operational efficiency due to growing implementation of Industry 4.0
- 5.2.1.2 Rapid expansion of AI and IoT integration across manufacturing sector
- 5.2.1.3 Increasing adoption of industrial mobility solutions
- 5.2.1.4 Increasing rollout of smart city developments
- 5.2.1.5 Growing governmental backing for adoption of SCADA systems
- 5.2.1.6 Unprecedented scale of renewable energy deployment
- 5.2.1.7 Distributed and remote nature of renewable energy sources
- 5.2.2 RESTRAINTS
- 5.2.2.1 Significant installation and maintenance costs associated with SCADA systems
- 5.2.2.2 High complexity and extensive customization requirements of SCADA systems
- 5.2.3 OPPORTUNITIES
- 5.2.3.1 Rapid progress in wireless sensor network development
- 5.2.3.2 Shift from on-premise SCADA infrastructure to cloud-based solutions
- 5.2.3.3 Leveraging SCADA-big data integration for enhanced operational intelligence
- 5.2.3.4 Increasing implementation of SCADA systems across transportation, smart buildings, and agricultural sectors
- 5.2.3.5 Floating solar SCADA solutions
- 5.2.4 CHALLENGES
- 5.2.4.1 Vulnerability of SCADA systems to cybersecurity threats
- 5.2.4.2 Incompatibility between communication protocols in SCADA systems
- 5.2.1 DRIVERS
- 5.3 VALUE CHAIN ANALYSIS
- 5.4 ECOSYSTEM ANALYSIS
- 5.5 INVESTMENT AND FUNDING SCENARIO
- 5.6 PRICING ANALYSIS
- 5.6.1 INDICATIVE PRICING OF PLCS OFFERED BY KEY PLAYERS
- 5.6.2 AVERAGE SELLING PRICE FOR RTUS
- 5.6.3 PRICING OF SCADA SOFTWARE OFFERED BY KEY PLAYERS, 2025
- 5.6.4 AVERAGE SELLING PRICE OF RTUS, BY REGION
- 5.7 TRENDS/DISRUPTIONS IMPACTING CUSTOMER BUSINESS
- 5.8 TECHNOLOGY ANALYSIS
- 5.8.1 KEY TECHNOLOGIES
- 5.8.1.1 IoT
- 5.8.2 COMPLEMENTARY TECHNOLOGIES
- 5.8.2.1 Cloud computing
- 5.8.2.2 Edge computing
- 5.8.2.3 AI
- 5.8.3 ADJACENT TECHNOLOGIES
- 5.8.3.1 5G
- 5.8.3.2 Cybersecurity
- 5.8.1 KEY TECHNOLOGIES
- 5.9 PORTER'S FIVE FORCES ANALYSIS
- 5.9.1 BARGAINING POWER OF SUPPLIERS
- 5.9.2 BARGAINING POWER OF BUYERS
- 5.9.3 THREAT OF NEW ENTRANTS
- 5.9.4 THREAT OF SUBSTITUTES
- 5.9.5 INTENSITY OF COMPETITIVE RIVALRY
- 5.10 KEY STAKEHOLDERS AND BUYING CRITERIA
- 5.10.1 KEY STAKEHOLDERS IN BUYING PROCESS
- 5.10.2 BUYING CRITERIA
- 5.11 CASE STUDY ANALYSIS
- 5.11.1 EMERSON ELECTRIC CO.'S SCADA DEPLOYED AT SHOPPING MALL IN ITALY
- 5.11.2 MADTREE BREWING COMPANY'S IMPLEMENTS IGNITION BY INDUCTIVE AUTOMATION, LLC. FOR SCADA AND HMI
- 5.11.3 OVARRO HELPS ENVIRONMENTAL MONITORING SOLUTIONS (EMS) IN IMPROVING DATA PRESENTATION TO CLIENTS
- 5.11.4 INDIAN OIL'S GUJARAT REFINERY AUTOMATES PLANT WITH HONEYWELL'S SCADA SOLUTION
- 5.11.5 MICRON TECHNOLOGY ENHANCES SEMICONDUCTOR PRODUCTION WITH GENERAL CONTROL SYSTEM'S SCADA SYSTEM
- 5.11.6 SCADA & WATER LEAK SOFTWARE FOR MCWD WATER NETWORK STABILITY AND EFFICIENCY
- 5.11.7 DEPCOM POWER ENHANCES SOLAR OPERATIONS WITH IGNITION
- 5.12 TRADE ANALYSIS
- 5.12.1 IMPORT SCENARIO (HS CODE 903289)
- 5.12.2 EXPORT SCENARIO (HS CODE 903289)
- 5.13 PATENT ANALYSIS
- 5.14 KEY CONFERENCES AND EVENTS, 2025-2026
- 5.15 REGULATORY LANDSCAPE
- 5.15.1 NORTH AMERICA
- 5.15.1.1 US
- 5.15.1.2 Canada
- 5.15.2 EUROPE
- 5.15.2.1 European Union
- 5.15.2.2 Germany
- 5.15.2.3 Russia
- 5.15.3 ASIA PACIFIC
- 5.15.3.1 China
- 5.15.3.2 Japan
- 5.15.3.3 Australia
- 5.15.4 REST OF THE WORLD
- 5.15.4.1 Brazil
- 5.15.4.2 Kenya
- 5.15.5 REGULATORY BODIES, GOVERNMENT AGENCIES, AND OTHER ORGANIZATIONS RELATED TO SCADA MARKET
- 5.15.6 MAJOR STANDARDS RELATED TO SCADA MARKET
- 5.15.1 NORTH AMERICA
- 5.16 IMPACT OF AI ON SCADA MARKET
- 5.16.1 INTRODUCTION
- 5.16.2 IMPACT OF AI ON KEY END-USE INDUSTRIES
- 5.16.2.1 Utilities
- 5.16.2.2 Water & wastewater
- 5.16.3 USE CASES
- 5.16.4 FUTURE OF AI/GEN AI IN SCADA ECOSYSTEM
- 5.17 IMPACT OF US TARIFFS ON SCADA MARKET
- 5.17.1 INTRODUCTION
- 5.17.2 KEY TARIFF RATES
- 5.17.3 IMPACT ON DIFFERENT COUNTRIES/REGIONS
6 IMPORTANT FEATURES OF LATEST SCADA SYSTEMS
- 6.1 INTRODUCTION
- 6.2 HIGH PERFORMANCE AND RAPID DATA COLLECTION CAPACITY
- 6.3 LIVE AND SELF-SERVICE DASHBOARDS
- 6.4 PREDICTIVE ANALYTICS IN FAULT DETECTION
- 6.5 UNIVERSAL CONNECTIVITY AND IOT-READY OPERATIONS
- 6.6 2D AND 3D VISUALIZATION
- 6.7 UP-TO-DATE ALARMING
- 6.8 INDUSTRY-SPECIFIC CUSTOMIZATION AND BEST PRACTICES
- 6.9 MISSION-CRITICAL REDUNDANCY
- 6.10 EXPANDABILITY AND SCALABILITY
- 6.11 INTEGRATED SMS/E-MAIL ALERTS
- 6.12 CYBERSECURITY AND ZERO TRUST ARCHITECTURE
7 TYPES AND CYBERSECURITY-RELATED THREATS AND COUNTERMEASURES
- 7.1 INTRODUCTION
- 7.2 TYPES OF SCADA SYSTEMS
- 7.2.1 FIRST GENERATION
- 7.2.2 SECOND GENERATION
- 7.2.3 THIRD GENERATION
- 7.2.4 FOURTH GENERATION
- 7.3 CYBERSECURITY RISKS ASSOCIATED WITH SCADA SYSTEMS AND COUNTERMEASURES
- 7.3.1 CYBER THREATS
- 7.3.1.1 Hacking
- 7.3.1.2 Malware
- 7.3.1.3 Inside errors
- 7.3.2 ROOT CAUSES OF CYBERATTACKS
- 7.3.2.1 Software development loopholes
- 7.3.2.2 Monitoring issues
- 7.3.2.3 Poor training and maintenance
- 7.3.3 PROTECTION SOLUTIONS
- 7.3.3.1 Software management
- 7.3.3.2 Network management
- 7.3.3.3 User access management
- 7.3.1 CYBER THREATS
8 TOP USE CASES/APPLICATIONS IN SCADA MARKET
- 8.1 INTRODUCTION
- 8.2 REAL-TIME MONITORING
- 8.3 REMOTE ACCESSIBILITY AND CONTROL
- 8.4 GRID INTEGRATION
- 8.5 DATA ANALYSIS AND OPTIMIZATION
- 8.6 FAULT DETECTION AND PREDICTIVE MAINTENANCE
9 SCADA MARKET, BY OFFERING
- 9.1 INTRODUCTION
- 9.2 HARDWARE
- 9.2.1 DIRECT COMMUNICATION WITH INDUSTRIAL DEVICES TO ENABLE EFFICIENT CONTROL AND DRIVE MARKET GROWTH
- 9.2.2 COMPONENT
- 9.2.2.1 Programmable logic controller
- 9.2.2.1.1 Safe and efficient plant operations to accelerate segment expansion
- 9.2.2.2 Remote terminal unit
- 9.2.2.2.1 Rising demand for real-time data acquisition and remote monitoring to drive segment growth
- 9.2.2.3 Human-machine interface
- 9.2.2.3.1 Growing need for clear graphical representation of critical data to support timely decision-making
- 9.2.2.3.2 Communication systems
- 9.2.2.3.3 Wired communication systems
- 9.2.2.3.4 Wireless communication systems
- 9.2.2.4 Other components
- 9.2.2.1 Programmable logic controller
- 9.3 SOFTWARE
- 9.3.1 NEED FOR DATA ACQUISITION, VISUALIZATION, AND ANALYSIS TO SUPPORT EFFICIENT MONITORING AND CONTROL OF SCADA SYSTEMS
- 9.3.2 SOFTWARE DEPLOYMENT MODES
- 9.3.2.1 On-premises deployment
- 9.3.2.2 Cloud deployment
- 9.4 SERVICES
- 9.4.1 RISING DEMAND FOR INSTALLATION, MAINTENANCE, CONFIGURATION, AND TRAINING SERVICES TO PROPEL MARKET GROWTH
- 9.4.2 PROFESSIONAL SERVICES
- 9.4.3 MANAGED SERVICES
10 SCADA MARKET, BY END USER
- 10.1 INTRODUCTION
- 10.2 PROCESS INDUSTRIES
- 10.2.1 CHEMICALS
- 10.2.1.1 Enhanced reliability and advanced safety features in oil & gas facilities to drive market expansion
- 10.2.2 PHARMACEUTICALS
- 10.2.2.1 Strict compliance standards and safety to unlock growth potential for SCADA solution providers
- 10.2.3 FOOD & BEVERAGE
- 10.2.3.1 Quality enhancement and reduced downtime to drive segment growth
- 10.2.4 OIL & GAS
- 10.2.4.1 Rising need for SCADA solutions to manage intricate processes to fuel market growth
- 10.2.5 OTHER PROCESS INDUSTRIES
- 10.2.1 CHEMICALS
- 10.3 DISCRETE MANUFACTURING
- 10.3.1 AUTOMOTIVE
- 10.3.1.1 Real-time monitoring and process optimization drive market expansion
- 10.3.2 SEMICONDUCTOR & ELECTRONICS
- 10.3.2.1 Emerging technologies and increasing production intricacies to boost SCADA adoption
- 10.3.3 OTHER DISCRETE MANUFACTURING
- 10.3.1 AUTOMOTIVE
- 10.4 UTILITIES
- 10.4.1 POWER
- 10.4.1.1 Rising adoption of SCADA to enhance stability and reliability of power distribution
- 10.4.2 WATER & WASTEWATER TREATMENT
- 10.4.2.1 Adoption of Water 4.0 to drive demand for SCADA systems
- 10.4.3 TRANSPORTATION
- 10.4.3.1 Increasing adoption for advanced network monitoring and control in sector
- 10.4.3.2 Traffic signals
- 10.4.3.3 Mass transit systems and railway traction systems
- 10.4.4 TELECOMMUNICATION
- 10.4.4.1 Remote monitoring and management of network infrastructure, along with growing adoption of 5G, to drive market growth
- 10.4.1 POWER
11 SCADA MARKET, BY REGION
- 11.1 INTRODUCTION
- 11.2 NORTH AMERICA
- 11.2.1 US
- 11.2.1.1 Government initiatives to enhance SCADA cybersecurity and support market growth
- 11.2.2 CANADA
- 11.2.2.1 Rapid expansion of utility applications to accelerate demand for SCADA systems
- 11.2.3 MEXICO
- 11.2.3.1 SCADA adoption across electric grids to propel market growth
- 11.2.1 US
- 11.3 EUROPE
- 11.3.1 UK
- 11.3.1.1 Rising demand for efficient asset management in wind power sector to drive market growth
- 11.3.2 GERMANY
- 11.3.2.1 Increasing integration of automation solutions in automotive industry to drive market growth
- 11.3.3 FRANCE
- 11.3.3.1 Advancements in transportation systems and industrial automation to propel market growth
- 11.3.4 ITALY
- 11.3.4.1 Growing focus on digital automation and smart utilities to propel SCADA demand
- 11.3.5 SPAIN
- 11.3.5.1 Infrastructure modernization and renewable energy expansion driving SCADA adoption
- 11.3.6 REST OF EUROPE
- 11.3.1 UK
- 11.4 ASIA PACIFIC
- 11.4.1 CHINA
- 11.4.1.1 Rapid adoption of SCADA in power and electronics to drive market growth
- 11.4.2 JAPAN
- 11.4.2.1 Rising investments in wind energy and renewable energy to fuel market expansion
- 11.4.3 SOUTH KOREA
- 11.4.3.1 Flourishing manufacturing industry to drive market growth
- 11.4.4 INDIA
- 11.4.4.1 Digital India initiative and urban infrastructure development to drive SCADA growth
- 11.4.5 AUSTRALIA
- 11.4.5.1 Emphasis on remote operations and critical infrastructure automation to boost SCADA usage
- 11.4.6 REST OF ASIA PACIFIC
- 11.4.1 CHINA
- 11.5 REST OF THE WORLD
- 11.5.1 MIDDLE EAST
- 11.5.1.1 Need for efficient and secure monitoring and control solutions in industries to drive market growth
- 11.5.1.2 GCC countries
- 11.5.1.3 Rest of Middle East
- 11.5.2 AFRICA
- 11.5.2.1 Increased focus on energy production and expansion to support market growth
- 11.5.3 SOUTH AMERICA
- 11.5.3.1 Rising investments in energy sector to drive market growth
- 11.5.1 MIDDLE EAST
12 COMPETITIVE LANDSCAPE
- 12.1 OVERVIEW
- 12.2 KEY STRATEGIES ADOPTED BY MAJOR PLAYERS, 2021-2024
- 12.3 MARKET SHARE ANALYSIS, 2024
- 12.4 REVENUE ANALYSIS OF KEY COMPANIES, 2020-2024
- 12.5 COMPANY VALUATION AND FINANCIAL METRICS
- 12.6 BRAND/PRODUCT COMPARISON
- 12.7 COMPANY EVALUATION MATRIX: KEY PLAYERS, 2024
- 12.7.1 STARS
- 12.7.2 EMERGING LEADERS
- 12.7.3 PERVASIVE PLAYERS
- 12.7.4 PARTICIPANTS
- 12.7.5 COMPANY FOOTPRINT, 2024
- 12.7.5.1 Overall footprint
- 12.7.5.2 Region footprint
- 12.7.5.3 Offering footprint
- 12.7.5.4 End user footprint
- 12.8 COMPANY EVALUATION MATRIX: STARTUPS/SMES, 2024
- 12.8.1 PROGRESSIVE COMPANIES
- 12.8.2 RESPONSIVE COMPANIES
- 12.8.3 DYNAMIC COMPANIES
- 12.8.4 STARTING BLOCKS
- 12.8.5 COMPETITIVE BENCHMARKING: STARTUPS/SMES IN ECOSYSTEM, 2024
- 12.8.5.1 Detailed list of key startups/SMEs in ecosystem
- 12.9 COMPETITIVE SCENARIO
- 12.9.1 PRODUCT LAUNCHES
- 12.9.2 DEALS
- 12.9.3 EXPANSIONS
13 COMPANY PROFILES
- 13.1 KEY PLAYERS
- 13.1.1 SCHNEIDER ELECTRIC
- 13.1.1.1 Business overview
- 13.1.1.2 Products/Solutions/Services offered
- 13.1.1.3 Recent developments
- 13.1.1.3.1 Product launches
- 13.1.1.3.2 Deals
- 13.1.1.4 MnM view
- 13.1.1.4.1 Key strengths
- 13.1.1.4.2 Strategic choices
- 13.1.1.4.3 Weaknesses and competitive threats
- 13.1.2 SIEMENS
- 13.1.2.1 Business overview
- 13.1.2.2 Products/Solutions/Services offered
- 13.1.2.3 MnM view
- 13.1.2.3.1 Key strengths
- 13.1.2.3.2 Strategic choices
- 13.1.2.3.3 Weaknesses and competitive threats
- 13.1.3 ABB
- 13.1.3.1 Business overview
- 13.1.3.2 Products/Solutions/Services offered
- 13.1.3.3 Recent developments
- 13.1.3.3.1 Product launches
- 13.1.3.3.2 Deals
- 13.1.3.3.3 Expansions
- 13.1.3.3.4 Other developments
- 13.1.3.4 MnM view
- 13.1.3.4.1 Key strengths
- 13.1.3.4.2 Strategic choices
- 13.1.3.4.3 Weaknesses and competitive threats
- 13.1.4 ROCKWELL AUTOMATION
- 13.1.4.1 Business overview
- 13.1.4.2 Products/Solutions/Services offered
- 13.1.4.3 Recent developments
- 13.1.4.3.1 Product launches
- 13.1.4.3.2 Deals
- 13.1.4.4 MnM view
- 13.1.4.4.1 Key strengths
- 13.1.4.4.2 Strategic choices
- 13.1.4.4.3 Weaknesses and competitive threats
- 13.1.5 EMERSON ELECTRIC CO.
- 13.1.5.1 Business overview
- 13.1.5.2 Products/Solutions/Services offered
- 13.1.5.3 Recent developments
- 13.1.5.3.1 Product launches
- 13.1.5.3.2 Deals
- 13.1.5.4 MnM view
- 13.1.5.4.1 Key strengths
- 13.1.5.4.2 Strategic choices
- 13.1.5.4.3 Weaknesses and competitive threats
- 13.1.6 GE VERNOVA
- 13.1.6.1 Business overview
- 13.1.6.2 Products/Solutions/Services offered
- 13.1.6.3 Recent developments
- 13.1.6.3.1 Product launches
- 13.1.6.3.2 Deals
- 13.1.7 HONEYWELL INTERNATIONAL INC.
- 13.1.7.1 Business overview
- 13.1.7.2 Products/Solutions/Services offered
- 13.1.7.3 Recent developments
- 13.1.7.3.1 Product launches
- 13.1.7.3.2 Deals
- 13.1.8 MITSUBISHI ELECTRIC CORPORATION
- 13.1.8.1 Business overview
- 13.1.8.2 Products/Solutions/Services offered
- 13.1.8.3 Recent developments
- 13.1.8.3.1 Product launches
- 13.1.8.3.2 Deals
- 13.1.9 OMRON CORPORATION
- 13.1.9.1 Business overview
- 13.1.9.2 Products/Solutions/Services offered
- 13.1.10 YOKOGAWA ELECTRIC CORPORATION
- 13.1.10.1 Business overview
- 13.1.10.2 Products/Solutions/Services offered
- 13.1.10.3 Recent developments
- 13.1.10.3.1 Product launches
- 13.1.10.3.2 Deals
- 13.1.11 HITACHI ENERGY LTD
- 13.1.11.1 Business overview
- 13.1.11.2 Products/Solutions/Services offered
- 13.1.1 SCHNEIDER ELECTRIC
- 13.2 OTHER PLAYERS
- 13.2.1 CAPULA LTD
- 13.2.2 ING. PUNZENBERGER COPA-DATA GMBH
- 13.2.3 DATA FLOW SYSTEMS
- 13.2.4 OPOURA
- 13.2.5 POWER FACTORS
- 13.2.6 ELYNX TECHNOLOGIES, LLC.
- 13.2.7 EMR INTEGRATED SOLUTIONS
- 13.2.8 INDUCTIVE AUTOMATION, LLC.
- 13.2.9 JFE ENGINEERING CORPORATION
- 13.2.10 OVAK TECHNOLOGIES
- 13.2.11 PILZ GMBH & CO. KG
- 13.2.12 SPRECHER AUTOMATION GMBH
- 13.2.13 SURVALENT TECHNOLOGY CORPORATION
- 13.2.14 WILLOWGLEN SYSTEMS
- 13.2.15 TRIHEDRAL ENGINEERING LIMITED
14 APPENDIX
- 14.1 DISCUSSION GUIDE
- 14.2 KNOWLEDGESTORE: MARKETSANDMARKETS' SUBSCRIPTION PORTAL
- 14.3 CUSTOMIZATION OPTIONS
- 14.4 RELATED REPORTS
- 14.5 AUTHOR DETAILS
List of Tables
- TABLE 1 SCADA MARKET: ECOSYSTEM
- TABLE 2 INDICATIVE PRICING OF PLCS OFFERED BY KEY PLAYERS, 2024 (USD)
- TABLE 3 AVERAGE SELLING PRICE TREND FOR RTUS, 2021-2024 (USD)
- TABLE 4 PRICING ANALYSIS OF RTUS
- TABLE 5 VTSCADA PRICING - PRICING BREAKDOWN (USD)
- TABLE 6 INDUCTIVE AUTOMATION: IGNITION ENTERPRISE SCADA PACKAGE - PRICING BREAKDOWN (USD)
- TABLE 7 AVERAGE SELLING PRICES RTUS, BY REGION, 2021-2024 (USD)
- TABLE 8 SCADA MARKET: PORTER'S FIVE FORCES ANALYSIS
- TABLE 9 INFLUENCE OF STAKEHOLDERS ON BUYING PROCESS FOR TOP END USERS (%)
- TABLE 10 KEY BUYING CRITERIA FOR TOP END USERS
- TABLE 11 IMPLEMENTATION OF SCADA SYSTEM TO MONITOR AND CONTROL SHOPPING MALLS AND HYPERMARKETS
- TABLE 12 IMPLEMENTATION OF INDUCTIVE AUTOMATION, LLC'S SCADA BY MADTREE BREWING COMPANY
- TABLE 13 IMPLEMENTATION OF OVARRO'S SCADA IN WATER SUPPLY SYSTEM BY EMS
- TABLE 14 INDIAN OIL CORPORATION DEPLOYS HONEYWELL INTERNATIONAL INC.'S SCADA SOLUTION
- TABLE 15 MICRON TECHNOLOGY IMPLEMENTS GENERAL CONTROL SYSTEM'S SCADA SYSTEMS FOR MANASSAS FACILITY
- TABLE 16 CEBU CITY ADOPTS YOKOGAWA ELECTRIC CORPORATION'S SCADA SYSTEMS TO ENSURE OPTIMUM WATER USE
- TABLE 17 DEPCOM POWER DEPLOYS IGNITION BY INDUCTIVE AUTOMATION TO OPTIMIZE SOLAR FLEET OPERATIONS AND ENHANCE SCADA PERFORMANCE
- TABLE 18 IMPORT DATA FOR HS CODE 903289-COMPLIANT PRODUCTS, BY COUNTRY, 2020-2024 (USD MILLION)
- TABLE 19 EXPORT DATA FOR HS CODE 903289-COMPLIANT PRODUCTS, BY COUNTRY, 2020-2024 (USD MILLION)
- TABLE 20 SCADA MARKET: LIST OF KEY PATENTS, 2021-2024
- TABLE 21 SCADA MARKET: CONFERENCES AND EVENTS, 2025-2026
- TABLE 22 NORTH AMERICA: REGULATORY BODIES, GOVERNMENT AGENCIES, AND OTHER ORGANIZATIONS
- TABLE 23 EUROPE: REGULATORY BODIES, GOVERNMENT AGENCIES, AND OTHER ORGANIZATIONS
- TABLE 24 ASIA PACIFIC: REGULATORY BODIES, GOVERNMENT AGENCIES, AND OTHER ORGANIZATIONS
- TABLE 25 ROW: REGULATORY BODIES, GOVERNMENT AGENCIES, AND OTHER ORGANIZATIONS
- TABLE 26 MAJOR COMMUNICATION STANDARDS FOR SCADA SYSTEMS
- TABLE 27 US ADJUSTED RECIPROCAL TARIFF RATES
- TABLE 28 SCADA MARKET, BY OFFERING, 2021-2024 (USD MILLION)
- TABLE 29 SCADA MARKET, BY OFFERING, 2025-2030 (USD MILLION)
- TABLE 30 HARDWARE: SCADA MARKET, BY REGION, 2021-2024 (USD MILLION)
- TABLE 31 HARDWARE: SCADA MARKET, BY REGION, 2025-2030 (USD MILLION)
- TABLE 32 HARDWARE: SCADA MARKET, BY COMPONENT, 2021-2024 (USD MILLION)
- TABLE 33 HARDWARE: SCADA MARKET, BY COMPONENT, 2025-2030 (USD MILLION)
- TABLE 34 RTU: SCADA MARKET, BY HARDWARE TYPE, 2021-2024 (THOUSAND UNITS)
- TABLE 35 RTU: SCADA MARKET, BY HARDWARE TYPE, 2025-2030 (THOUSAND UNITS)
- TABLE 36 ADVANTAGES AND DISADVANTAGES OF WIRED COMMUNICATION SYSTEMS
- TABLE 37 ADVANTAGES AND DISADVANTAGES OF WIRELESS COMMUNICATION SYSTEMS
- TABLE 38 SCADA MARKET, BY SOFTWARE, 2021-2024 (USD MILLION)
- TABLE 39 SCADA MARKET, BY SOFTWARE, 2025-2030 (USD MILLION)
- TABLE 40 SOFTWARE: SCADA MARKET, BY REGION, 2021-2024 (USD MILLION)
- TABLE 41 SOFTWARE: SCADA MARKET, BY REGION, 2025-2030 (USD MILLION)
- TABLE 42 SCADA MARKET, BY SERVICE, 2021-2024 (USD MILLION)
- TABLE 43 SCADA MARKET, BY SERVICE, 2025-2030 (USD MILLION)
- TABLE 44 SERVICES: SCADA MARKET, BY REGION, 2021-2024 (USD MILLION)
- TABLE 45 SERVICES: SCADA MARKET, BY REGION, 2025-2030 (USD MILLION)
- TABLE 46 SCADA MARKET, BY END USER, 2021-2024 (USD MILLION)
- TABLE 47 SCADA MARKET, BY END USER, 2025-2030 (USD MILLION)
- TABLE 48 SCADA MARKET, BY PROCESS INDUSTRIES, 2021-2024 (USD MILLION)
- TABLE 49 SCADA MARKET, BY PROCESS INDUSTRIES, 2025-2030 (USD MILLION)
- TABLE 50 PROCESS INDUSTRIES: SCADA MARKET, BY REGION, 2021-2024 (USD MILLION)
- TABLE 51 PROCESS INDUSTRIES: SCADA MARKET, BY REGION, 2025-2030 (USD MILLION)
- TABLE 52 CHEMICALS: SCADA MARKET, BY REGION, 2021-2024 (USD MILLION)
- TABLE 53 CHEMICALS: SCADA MARKET, BY REGION, 2025-2030 (USD MILLION)
- TABLE 54 PHARMACEUTICALS: SCADA MARKET, BY REGION, 2021-2024 (USD MILLION)
- TABLE 55 PHARMACEUTICALS: SCADA MARKET, BY REGION, 2025-2030 (USD MILLION)
- TABLE 56 SCADA SOFTWARE USED IN FOOD & BEVERAGE INDUSTRY
- TABLE 57 FOOD & BEVERAGE: SCADA MARKET, BY REGION, 2021-2024 (USD MILLION)
- TABLE 58 FOOD & BEVERAGE: SCADA MARKET, BY REGION, 2025-2030 (USD MILLION)
- TABLE 59 OIL & GAS: SCADA MARKET, BY REGION, 2021-2024 (USD MILLION)
- TABLE 60 OIL & GAS: SCADA MARKET, BY REGION, 2025-2030 (USD MILLION)
- TABLE 61 OTHER PROCESS INDUSTRIES: SCADA MARKET, BY REGION, 2021-2024 (USD MILLION)
- TABLE 62 OTHER PROCESS INDUSTRIES: SCADA MARKET, BY REGION, 2025-2030 (USD MILLION)
- TABLE 63 SCADA MARKET: BY DISCRETE MANUFACTURING, 2021-2024 (USD MILLION)
- TABLE 64 SCADA MARKET: BY DISCRETE MANUFACTURING, 2025-2030 (USD MILLION)
- TABLE 65 DISCRETE MANUFACTURING: SCADA MARKET, BY REGION, 2021-2024 (USD MILLION)
- TABLE 66 DISCRETE MANUFACTURING: SCADA MARKET, BY REGION, 2025-2030 (USD MILLION)
- TABLE 67 AUTOMOTIVE: SCADA MARKET, BY REGION, 2021-2024 (USD MILLION)
- TABLE 68 AUTOMOTIVE: SCADA MARKET, BY REGION, 2025-2030 (USD MILLION)
- TABLE 69 SEMICONDUCTOR & ELECTRONICS: SCADA MARKET, BY REGION, 2021-2024 (USD MILLION)
- TABLE 70 SEMICONDUCTOR & ELECTRONICS: SCADA MARKET, BY REGION, 2025-2030 (USD MILLION)
- TABLE 71 OTHER DISCRETE MANUFACTURING: SCADA MARKET, BY REGION, 2021-2024 (USD MILLION)
- TABLE 72 OTHER DISCRETE MANUFACTURING: SCADA MARKET, BY REGION, 2025-2030 (USD MILLION)
- TABLE 73 SCADA MARKET, BY UTILITIES, 2021-2024 (USD MILLION)
- TABLE 74 SCADA MARKET, BY UTILITIES, 2025-2030 (USD MILLION)
- TABLE 75 UTILITIES: SCADA MARKET, BY REGION, 2021-2024 (USD MILLION)
- TABLE 76 UTILITIES: SCADA MARKET, BY REGION, 2025-2030 (USD MILLION)
- TABLE 77 POWER: SCADA MARKET, BY REGION, 2021-2024 (USD MILLION)
- TABLE 78 POWER: SCADA MARKET, BY REGION, 2025-2030 (USD MILLION)
- TABLE 79 WATER & WASTEWATER TREATMENT: SCADA MARKET, BY REGION, 2021-2024 (USD MILLION)
- TABLE 80 WATER & WASTEWATER TREATMENT: SCADA MARKET, BY REGION, 2025-2030 (USD MILLION)
- TABLE 81 TRANSPORTATION: SCADA MARKET, BY REGION, 2021-2024 (USD MILLION)
- TABLE 82 TRANSPORTATION: SCADA MARKET, BY REGION, 2025-2030 (USD MILLION)
- TABLE 83 TELECOMMUNICATION: SCADA MARKET, BY REGION, 2021-2024 (USD MILLION)
- TABLE 84 TELECOMMUNICATION: SCADA MARKET, BY REGION, 2025-2030 (USD MILLION)
- TABLE 85 SCADA MARKET, BY REGION, 2021-2024 (USD MILLION)
- TABLE 86 SCADA MARKET, BY REGION, 2025-2030 (USD MILLION)
- TABLE 87 NORTH AMERICA: SCADA MARKET, BY COUNTRY, 2021-2024 (USD MILLION)
- TABLE 88 NORTH AMERICA: SCADA MARKET, BY COUNTRY, 2025-2030 (USD MILLION)
- TABLE 89 NORTH AMERICA: SCADA MARKET, BY OFFERING, 2021-2024 (USD MILLION)
- TABLE 90 NORTH AMERICA: SCADA MARKET, BY OFFERING, 2025-2030 (USD MILLION)
- TABLE 91 NORTH AMERICA: SCADA MARKET, BY END USER, 2021-2024 (USD MILLION)
- TABLE 92 NORTH AMERICA: SCADA MARKET, BY END USER, 2025-2030 (USD MILLION)
- TABLE 93 NORTH AMERICA: SCADA MARKET, BY PROCESS INDUSTRIES, 2021-2024 (USD MILLION)
- TABLE 94 NORTH AMERICA: SCADA MARKET, BY PROCESS INDUSTRIES, 2025-2030 (USD MILLION)
- TABLE 95 NORTH AMERICA: SCADA MARKET, BY DISCRETE MANUFACTURING, 2021-2024 (USD MILLION)
- TABLE 96 NORTH AMERICA: SCADA MARKET, BY DISCRETE MANUFACTURING, 2025-2030 (USD MILLION)
- TABLE 97 NORTH AMERICA: SCADA MARKET, BY UTILITIES, 2021-2024 (USD MILLION)
- TABLE 98 NORTH AMERICA: SCADA MARKET, BY UTILITIES, 2025-2030 (USD MILLION)
- TABLE 99 US: SCADA MARKET, BY END USER, 2021-2024 (USD MILLION)
- TABLE 100 US: SCADA MARKET, BY END USER, 2025-2030 (USD MILLION)
- TABLE 101 CANADA: SCADA MARKET, BY END USER, 2021-2024 (USD MILLION)
- TABLE 102 CANADA: SCADA MARKET, BY END USER, 2025-2030 (USD MILLION)
- TABLE 103 MEXICO: SCADA MARKET, BY END USER, 2021-2024 (USD MILLION)
- TABLE 104 MEXICO: SCADA MARKET, BY END USER, 2025-2030 (USD MILLION)
- TABLE 105 EUROPE: SCADA MARKET, BY COUNTRY, 2021-2024 (USD MILLION)
- TABLE 106 EUROPE: SCADA MARKET, BY COUNTRY, 2025-2030 (USD MILLION)
- TABLE 107 EUROPE: SCADA MARKET, BY OFFERING, 2021-2024 (USD MILLION)
- TABLE 108 EUROPE: SCADA MARKET, BY OFFERING, 2025-2030 (USD MILLION)
- TABLE 109 EUROPE: SCADA MARKET, BY END USER, 2021-2024 (USD MILLION)
- TABLE 110 EUROPE: SCADA MARKET, BY END USER, 2025-2030 (USD MILLION)
- TABLE 111 EUROPE: SCADA MARKET, BY PROCESS INDUSTRIES, 2021-2024 (USD MILLION)
- TABLE 112 EUROPE: SCADA MARKET, BY PROCESS INDUSTRIES, 2025-2030 (USD MILLION)
- TABLE 113 EUROPE: SCADA MARKET, BY DISCRETE MANUFACTURING, 2021-2024 (USD MILLION)
- TABLE 114 EUROPE: SCADA MARKET, BY DISCRETE MANUFACTURING, 2025-2030 (USD MILLION)
- TABLE 115 EUROPE: SCADA MARKET, BY UTILITIES, 2021-2024 (USD MILLION)
- TABLE 116 EUROPE: SCADA MARKET, BY UTILITIES, 2025-2030 (USD MILLION)
- TABLE 117 UK: SCADA MARKET, BY END USER, 2021-2024 (USD MILLION)
- TABLE 118 UK: SCADA MARKET, BY END USER, 2025-2030 (USD MILLION)
- TABLE 119 GERMANY: SCADA MARKET, BY END USER, 2021-2024 (USD MILLION)
- TABLE 120 GERMANY: SCADA MARKET, BY END USER, 2025-2030 (USD MILLION)
- TABLE 121 FRANCE: SCADA MARKET, BY END USER, 2021-2024 (USD MILLION)
- TABLE 122 FRANCE: SCADA MARKET, BY END USER, 2025-2030 (USD MILLION)
- TABLE 123 ITALY: SCADA MARKET, BY END USER, 2021-2024 (USD MILLION)
- TABLE 124 ITALY: SCADA MARKET, BY END USER, 2025-2030 (USD MILLION)
- TABLE 125 SPAIN: SCADA MARKET, BY END USER, 2021-2024 (USD MILLION)
- TABLE 126 SPAIN: SCADA MARKET, BY END USER, 2025-2030 (USD MILLION)
- TABLE 127 REST OF EUROPE: SCADA MARKET, BY END USER, 2021-2024 (USD MILLION)
- TABLE 128 REST OF EUROPE: SCADA MARKET, BY END USER, 2025-2030 (USD MILLION)
- TABLE 129 ASIA PACIFIC: SCADA MARKET, BY COUNTRY, 2021-2024 (USD MILLION)
- TABLE 130 ASIA PACIFIC: SCADA MARKET, BY COUNTRY, 2025-2030 (USD MILLION)
- TABLE 131 ASIA PACIFIC: SCADA MARKET, BY OFFERING, 2021-2024 (USD MILLION)
- TABLE 132 ASIA PACIFIC: SCADA MARKET, BY OFFERING, 2025-2030 (USD MILLION)
- TABLE 133 ASIA PACIFIC: SCADA MARKET, BY END USER, 2021-2024 (USD MILLION)
- TABLE 134 ASIA PACIFIC: SCADA MARKET, BY END USER, 2025-2030 (USD MILLION)
- TABLE 135 ASIA PACIFIC: SCADA MARKET, BY PROCESS INDUSTRIES, 2021-2024 (USD MILLION)
- TABLE 136 ASIA PACIFIC: SCADA MARKET, BY PROCESS INDUSTRIES, 2025-2030 (USD MILLION)
- TABLE 137 ASIA PACIFIC: SCADA MARKET, BY DISCRETE MANUFACTURING, 2021-2024 (USD MILLION)
- TABLE 138 ASIA PACIFIC: SCADA MARKET, BY DISCRETE MANUFACTURING, 2025-2030 (USD MILLION)
- TABLE 139 ASIA PACIFIC: SCADA MARKET, BY UTILITIES, 2021-2024 (USD MILLION)
- TABLE 140 ASIA PACIFIC: SCADA MARKET, BY UTILITIES, 2025-2030 (USD MILLION)
- TABLE 141 CHINA: SCADA MARKET, BY END USER, 2021-2024 (USD MILLION)
- TABLE 142 CHINA: SCADA MARKET, BY END USER, 2025-2030 (USD MILLION)
- TABLE 143 JAPAN: SCADA MARKET, BY END USER, 2021-2024 (USD MILLION)
- TABLE 144 JAPAN: SCADA MARKET, BY END USER, 2025-2030 (USD MILLION)
- TABLE 145 SOUTH KOREA: SCADA MARKET, BY END USER, 2021-2024 (USD MILLION)
- TABLE 146 SOUTH KOREA: SCADA MARKET, BY END USER, 2025-2030 (USD MILLION)
- TABLE 147 INDIA: SCADA MARKET, BY END USER, 2021-2024 (USD MILLION)
- TABLE 148 INDIA: SCADA MARKET, BY END USER, 2025-2030 (USD MILLION)
- TABLE 149 AUSTRALIA: SCADA MARKET, BY END USER, 2021-2024 (USD MILLION)
- TABLE 150 AUSTRALIA: SCADA MARKET, BY END USER, 2025-2030 (USD MILLION)
- TABLE 151 REST OF ASIA PACIFIC: SCADA MARKET, BY END USER, 2021-2024 (USD MILLION)
- TABLE 152 REST OF ASIA PACIFIC: SCADA MARKET, BY END USER, 2025-2030 (USD MILLION)
- TABLE 153 ROW: SCADA MARKET, BY REGION, 2021-2024 (USD MILLION)
- TABLE 154 ROW: SCADA MARKET, BY REGION, 2025-2030 (USD MILLION)
- TABLE 155 ROW: SCADA MARKET, BY OFFERING, 2021-2024 (USD MILLION)
- TABLE 156 ROW: SCADA MARKET, BY OFFERING, 2025-2030 (USD MILLION)
- TABLE 157 ROW: SCADA MARKET, BY END USER, 2021-2024 (USD MILLION)
- TABLE 158 ROW: SCADA MARKET, BY END USER, 2025-2030 (USD MILLION)
- TABLE 159 ROW: SCADA MARKET, BY PROCESS INDUSTRIES, 2021-2024 (USD MILLION)
- TABLE 160 ROW: SCADA MARKET, BY PROCESS INDUSTRIES, 2025-2030 (USD MILLION)
- TABLE 161 ROW: SCADA MARKET, BY DISCRETE MANUFACTURING, 2021-2024 (USD MILLION)
- TABLE 162 ROW: SCADA MARKET, BY DISCRETE MANUFACTURING, 2025-2030 (USD MILLION)
- TABLE 163 ROW: SCADA MARKET, BY UTILITIES, 2021-2024 (USD MILLION)
- TABLE 164 ROW: SCADA MARKET, BY UTILITIES, 2025-2030 (USD MILLION)
- TABLE 165 MIDDLE EAST: SCADA MARKET, BY END USER, 2021-2024 (USD MILLION)
- TABLE 166 MIDDLE EAST: SCADA MARKET, BY END USER, 2025-2030 (USD MILLION)
- TABLE 167 MIDDLE EAST: SCADA MARKET, BY REGION, 2021-2024 (USD MILLION)
- TABLE 168 MIDDLE EAST: SCADA MARKET, BY REGION, 2025-2030 (USD MILLION)
- TABLE 169 AFRICA: SCADA MARKET, BY END USER, 2021-2024 (USD MILLION)
- TABLE 170 AFRICA: SCADA MARKET, BY END USER, 2025-2030 (USD MILLION)
- TABLE 171 SOUTH AMERICA: SCADA MARKET, BY END USER, 2021-2024 (USD MILLION)
- TABLE 172 SOUTH AMERICA: SCADA MARKET, BY END USER, 2025-2030 (USD MILLION)
- TABLE 173 SCADA MARKET: OVERVIEW OF STRATEGIES ADOPTED BY KEY PLAYERS, 2021-2024
- TABLE 174 SCADA MARKET: DEGREE OF COMPETITION, 2024
- TABLE 175 SCADA MARKET: REGION FOOTPRINT
- TABLE 176 SCADA MARKET: OFFERING FOOTPRINT
- TABLE 177 SCADA MARKET: END USER FOOTPRINT
- TABLE 178 SCADA MARKET: KEY STARTUPS/SMES IN ECOSYSTEM
- TABLE 179 SCADA MARKET: COMPETITIVE BENCHMARKING OF KEY STARTUPS/SMES IN ECOSYSTEM, 2025
- TABLE 180 SCADA MARKET: PRODUCT LAUNCHES, JANUARY 2021-APRIL 2025
- TABLE 181 SCADA MARKET: DEALS, JANUARY 2021-APRIL 2025
- TABLE 182 SCADA MARKET: EXPANSIONS, JANUARY 2021-APRIL 2025
- TABLE 183 SCHNEIDER ELECTRIC: COMPANY OVERVIEW
- TABLE 184 SCHNEIDER ELECTRIC: PRODUCTS/SOLUTIONS/SERVICES OFFERED
- TABLE 185 SCHNEIDER ELECTRIC: PRODUCT LAUNCHES
- TABLE 186 SCHNEIDER ELECTRIC: DEALS
- TABLE 187 SIEMENS: COMPANY OVERVIEW
- TABLE 188 SIEMENS: PRODUCTS/SOLUTIONS/SERVICES OFFERED
- TABLE 189 ABB: COMPANY OVERVIEW
- TABLE 190 ABB: PRODUCTS/SOLUTIONS/SERVICES OFFERED
- TABLE 191 ABB: PRODUCT LAUNCHES
- TABLE 192 ABB: DEALS
- TABLE 193 ABB: EXPANSIONS
- TABLE 194 ABB: OTHER DEVELOPMENTS
- TABLE 195 ROCKWELL AUTOMATION: COMPANY OVERVIEW
- TABLE 196 ROCKWELL AUTOMATION: PRODUCTS/SOLUTIONS/SERVICES OFFERED
- TABLE 197 ROCKWELL AUTOMATION: PRODUCT LAUNCHES
- TABLE 198 ROCKWELL AUTOMATION: DEALS
- TABLE 199 EMERSON ELECTRIC CO.: COMPANY OVERVIEW
- TABLE 200 EMERSON ELECTRIC CO.: PRODUCTS/SOLUTIONS/SERVICES OFFERED
- TABLE 201 EMERSON ELECTRIC CO.: PRODUCT LAUNCHES
- TABLE 202 EMERSON ELECTRIC CO.: DEALS
- TABLE 203 GE VERNOVA: COMPANY OVERVIEW
- TABLE 204 GE VERNOVA: PRODUCTS/SOLUTIONS/SERVICES OFFERED
- TABLE 205 GE VERNOVA: PRODUCT LAUNCHES
- TABLE 206 GE VERNOVA: OTHER DEVELOPMENTS
- TABLE 207 HONEYWELL INTERNATIONAL INC.: COMPANY OVERVIEW
- TABLE 208 HONEYWELL INTERNATIONAL INC.: PRODUCTS/SOLUTIONS/SERVICES OFFERED
- TABLE 209 HONEYWELL INTERNATIONAL INC.: PRODUCT LAUNCHES
- TABLE 210 HONEYWELL INTERNATIONAL INC.: DEALS
- TABLE 211 MITSUBISHI ELECTRIC CORPORATION: COMPANY OVERVIEW
- TABLE 212 MITSUBISHI ELECTRIC CORPORATION: PRODUCTS/SOLUTIONS/SERVICES OFFERED
- TABLE 213 MITSUBISHI ELECTRIC CORPORATION: PRODUCT LAUNCHES
- TABLE 214 MITSUBISHI ELECTRIC CORPORATION: DEALS
- TABLE 215 OMRON CORPORATION: COMPANY OVERVIEW
- TABLE 216 OMRON CORPORATION: PRODUCTS/SOLUTIONS/SERVICES OFFERINGS
- TABLE 217 YOKOGAWA ELECTRIC CORPORATION: COMPANY OVERVIEW
- TABLE 218 YOKOGAWA ELECTRIC CORPORATION: PRODUCTS/SOLUTIONS/SERVICES OFFERED
- TABLE 219 YOKOGAWA ELECTRIC CORPORATION: PRODUCT LAUNCHES
- TABLE 220 YOKOGAWA ELECTRIC CORPORATION: DEALS
- TABLE 221 HITACHI ENERGY LTD: COMPANY OVERVIEW
- TABLE 222 HITACHI ENERGY LTD: PRODUCTS/SOLUTIONS/SERVICES OFFERED
- TABLE 223 CAPULA LTD: COMPANY OVERVIEW
- TABLE 224 ING. PUNZENBERGER COPA-DATA GMBH: COMPANY OVERVIEW
- TABLE 225 DATA FLOW SYSTEMS: COMPANY OVERVIEW
- TABLE 226 OPOURA: COMPANY OVERVIEW
- TABLE 227 POWER FACTORS: COMPANY OVERVIEW
- TABLE 228 ELYNX TECHNOLOGIES, LLC.: COMPANY OVERVIEW
- TABLE 229 EMR INTEGRATED SOLUTIONS: COMPANY OVERVIEW
- TABLE 230 INDUCTIVE AUTOMATION, LLC.: COMPANY OVERVIEW
- TABLE 231 JFE ENGINEERING CORPORATION: COMPANY OVERVIEW
- TABLE 232 OVAK TECHNOLOGIES: COMPANY OVERVIEW
- TABLE 233 PILZ GMBH & CO. KG: COMPANY OVERVIEW
- TABLE 234 SPRECHER AUTOMATION GMBH: COMPANY OVERVIEW
- TABLE 235 SURVALENT TECHNOLOGY CORPORATION: COMPANY OVERVIEW
- TABLE 236 WILLOWGLEN SYSTEMS: COMPANY OVERVIEW
- TABLE 237 TRIHEDRAL ENGINEERING LIMITED: COMPANY OVERVIEW
List of Figures
- FIGURE 1 SCADA MARKET SEGMENTATION
- FIGURE 2 SCADA MARKET: PROCESS FLOW FOR MARKET SIZE ESTIMATION
- FIGURE 3 SCADA MARKET: RESEARCH DESIGN
- FIGURE 4 SCADA MARKET: BOTTOM-UP APPROACH
- FIGURE 5 SCADA MARKET: TOP-DOWN APPROACH
- FIGURE 6 MARKET SIZE ESTIMATION THROUGH SUPPLY-SIDE ANALYSIS
- FIGURE 7 SCADA MARKET: DATA TRIANGULATION
- FIGURE 8 SOFTWARE SEGMENT TO REGISTER HIGHEST CAGR DURING FORECAST PERIOD
- FIGURE 9 UTILITIES TO HAVE HIGHEST CAGR DURING FORECAST PERIOD
- FIGURE 10 ASIA PACIFIC TO REGISTER FASTEST GROWTH DURING FORECAST PERIOD
- FIGURE 11 ATTRACTIVE GROWTH OPPORTUNITIES FOR PLAYERS IN SCADA MARKET
- FIGURE 12 SERVICES TO BE LARGEST OFFERING SEGMENT IN 2025
- FIGURE 13 UTILITIES TO HOLD DOMINANT POSITION IN 2030
- FIGURE 14 CHINA TO EXHIBIT HIGHEST CAGR DURING FORECAST PERIOD
- FIGURE 15 SCADA MARKET: DRIVERS, RESTRAINTS, OPPORTUNITIES, AND CHALLENGES
- FIGURE 16 FACTORS PROPELLING DEMAND FOR INDUSTRIAL MOBILITY SOLUTIONS
- FIGURE 17 IMPLEMENTATION OF SCADA IN SMART CITIES
- FIGURE 18 ANNUAL RENEWABLE ENERGY CAPACITY ADDITIONS (2021-2024)
- FIGURE 19 SCADA MARKET: IMPACT ANALYSIS OF DRIVERS
- FIGURE 20 SCADA MARKET: IMPACT ANALYSIS OF RESTRAINTS
- FIGURE 21 BIG DATA ANALYTICS IN SCADA SYSTEMS
- FIGURE 22 SCADA MARKET: IMPACT ANALYSIS OF OPPORTUNITIES
- FIGURE 23 SCADA MARKET: IMPACT ANALYSIS OF CHALLENGES
- FIGURE 24 SCADA MARKET: VALUE CHAIN ANALYSIS
- FIGURE 25 ECOSYSTEM ANALYSIS
- FIGURE 26 INVESTMENT AND FUNDING SCENARIO (2021-2024)
- FIGURE 27 AVERAGE SELLING PRICE TREND FOR RTUS, 2021-2024 (USD)
- FIGURE 28 AVERAGE SELLING PRICE OF RTUS, BY REGION 2021-2024 (USD)
- FIGURE 29 TRENDS/DISRUPTIONS IMPACTING CUSTOMER BUSINESS
- FIGURE 30 SCADA MARKET: PORTER'S FIVE FORCES ANALYSIS
- FIGURE 31 INFLUENCE OF STAKEHOLDERS ON BUYING PROCESS FOR TOP END USERS
- FIGURE 32 KEY BUYING CRITERIA FOR TOP END USERS
- FIGURE 33 IMPORT DATA FOR HS CODE 903289-COMPLIANT PRODUCTS: TOP FIVE COUNTRIES, 2020-2024
- FIGURE 34 EXPORT DATA FOR HS CODE 903289-COMPLIANT PRODUCTS: TOP FIVE COUNTRIES, 2020-2024
- FIGURE 35 SCADA MARKET: PATENT ANALYSIS, 2014-2024
- FIGURE 36 AI USE CASES IN SCADA
- FIGURE 37 TYPES OF SCADA SYSTEMS
- FIGURE 38 ARCHITECTURE OF FIRST-GENERATION SCADA SYSTEMS
- FIGURE 39 CYBERSECURITY LANDSCAPE OF SCADA SYSTEMS
- FIGURE 40 TOP USE CASES/APPLICATIONS IN SCADA MARKET
- FIGURE 41 TOP USE CASES OF SCADA SYSTEMS
- FIGURE 42 SCADA MARKET, BY OFFERING
- FIGURE 43 SERVICES SEGMENT TO HOLD DOMINANT POSITION IN 2030
- FIGURE 44 HARDWARE COMPONENTS OF SCADA SYSTEM
- FIGURE 45 PLC HARDWARE SYSTEM
- FIGURE 46 OPERATING CYCLE OF PLC
- FIGURE 47 BENEFITS OF PLC
- FIGURE 48 ARCHITECTURE OF RTU
- FIGURE 49 ADVANTAGES OF SOFTWARE-INTEGRATED SCADA SYSTEMS
- FIGURE 50 SOFTWARE DEPLOYMENT MODES
- FIGURE 51 LIMITATIONS OF ON-PREMISES SCADA SYSTEMS
- FIGURE 52 ADVANTAGES OF CLOUD-BASED SCADA SYSTEMS
- FIGURE 53 ADVANTAGES OF SCADA SYSTEM SERVICES
- FIGURE 54 SCADA MARKET, BY END USER
- FIGURE 55 UTILITIES TO GROW AT HIGHEST CAGR DURING FORECAST PERIOD
- FIGURE 56 IMPORTANCE OF SCADA SYSTEMS IN FOOD & BEVERAGES INDUSTRY
- FIGURE 57 KEY DESIGN PARAMETERS OF SCADA SYSTEMS FOR UPSTREAM SECTOR
- FIGURE 58 BENEFITS OF SCADA IN MANUFACTURING INDUSTRY
- FIGURE 59 ADVANTAGES OF USING SCADA IN POWER UTILITIES
- FIGURE 60 INFRASTRUCTURE OF POWER GENERATION STATIONS USING SCADA SOLUTIONS
- FIGURE 61 PARAMETERS CONTROLLED AND MONITORED BY SCADA SYSTEMS IN WATER & WASTEWATER TREATMENT PLANTS
- FIGURE 62 APPLICATIONS OF SCADA SYSTEMS IN TRANSPORTATION
- FIGURE 63 ADVANTAGES OF SCADA SYSTEMS IN TRAFFIC SIGNALS
- FIGURE 64 SCADA MARKET IN CHINA TO WITNESS HIGHEST CAGR FROM 2025 TO 2030
- FIGURE 65 ASIA PACIFIC TO HOLD LARGEST SHARE OF SCADA MARKET IN 2030
- FIGURE 66 NORTH AMERICA: SCADA MARKET SNAPSHOT
- FIGURE 67 EUROPE: SCADA MARKET SNAPSHOT
- FIGURE 68 ASIA PACIFIC: SCADA MARKET SNAPSHOT
- FIGURE 69 SOUTH AMERICA TO REGISTER HIGHEST CAGR IN ROW DURING FORECAST PERIOD
- FIGURE 70 SCADA MARKET SHARE ANALYSIS, 2024
- FIGURE 71 SCADA MARKET: REVENUE ANALYSIS OF FIVE KEY PLAYERS, 2020-2024
- FIGURE 72 COMPANY VALUATION (USD MILLION)
- FIGURE 73 FINANCIAL METRICS (EV/EBITDA)
- FIGURE 74 SCADA MARKET: BRAND/ PRODUCT COMPARISON
- FIGURE 75 SCADA MARKET: COMPANY EVALUATION MATRIX, 2024
- FIGURE 76 SCADA MARKET: COMPANY OVERALL FOOTPRINT
- FIGURE 77 SCADA MARKET: STARTUP/SME EVALUATION MATRIX, 2024
- FIGURE 78 SCHNEIDER ELECTRIC: COMPANY SNAPSHOT
- FIGURE 79 SIEMENS: COMPANY SNAPSHOT
- FIGURE 80 ABB: COMPANY SNAPSHOT
- FIGURE 81 ROCKWELL AUTOMATION: COMPANY SNAPSHOT
- FIGURE 82 EMERSON ELECTRIC CO.: COMPANY SNAPSHOT
- FIGURE 83 GE VERNOVA: COMPANY SNAPSHOT
- FIGURE 84 HONEYWELL INTERNATIONAL INC.: COMPANY SNAPSHOT
- FIGURE 85 MITSUBISHI ELECTRIC CORPORATION: COMPANY SNAPSHOT
- FIGURE 86 OMRON CORPORATION: COMPANY SNAPSHOT
- FIGURE 87 YOKOGAWA ELECTRIC CORPORATION: COMPANY SNAPSHOT

