
PUBLISHER: MarketsandMarkets | PRODUCT CODE: 1796190

PUBLISHER: MarketsandMarkets | PRODUCT CODE: 1796190
Polypropylene Compounds Market by Product Type, Polymer Type, End-use Industry, Processing Method, and Region - Global Forecast to 2030
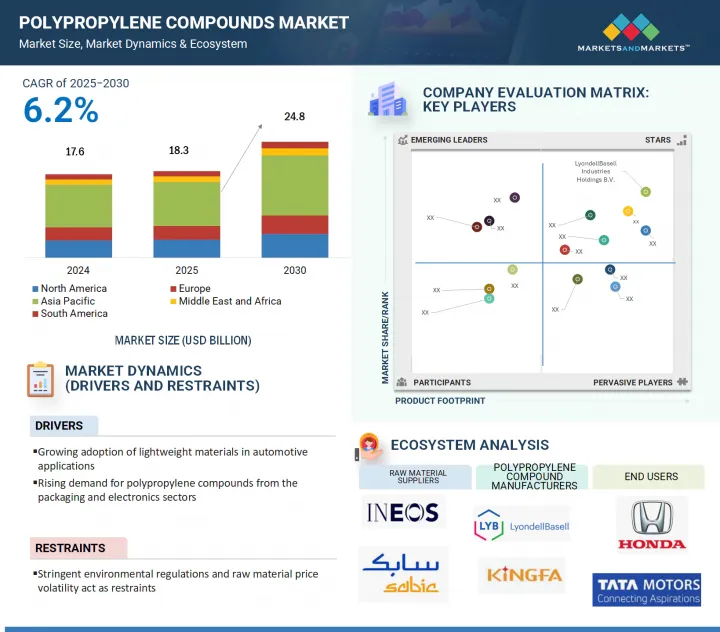
The polypropylene compounds market size is projected to grow from USD 17.6 billion in 2024 to USD 24.8 billion by 2030, registering a CAGR of 6.2% during the forecast period.
| Scope of the Report | |
|---|---|
| Years Considered for the Study | 2021-2030 |
| Base Year | 2024 |
| Forecast Period | 2025-2030 |
| Units Considered | Value (USD Million/Billion) |
| Segments | Product Type, Polymer Type, Processing Method, End-use Industry, and Region |
| Regions covered | Asia Pacific, North America, Europe, Middle East & Africa, South America |
Polypropylene compounds have become the preferred choice for industries because they provide cost-effective solutions with versatile applications. Polypropylene functions as a thermoplastic polymer which delivers optimal performance at affordable prices to support large-scale manufacturing in automotive, packaging, construction, and consumer goods industries. The flexibility of polypropylene to accept fillers, fibers, and additives allows producers to develop customized mechanical and thermal and esthetic properties for particular applications at low production expenditures. Through their budget-friendly nature, polypropylene compounds enable manufacturers to reduce weight while replacing materials in price-sensitive applications so they can meet performance requirements and regulations without exceeding their financial limits.
"Mineral-filled polypropylene compounds accounted for the largest growth in the product type segment of polypropylene compounds market in terms of value"
Mineral filled polypropylene are poised to be the largest type in the polypropylene compounds market due to their broad connection, cost-effectiveness, and enhanced mechanical properties. By incorporating minerals, such as talc, calcium carbonate, or mica, these composites show higher stiffness, dimensional stability, and thermal resistance - making them largely suitable for demanding operations. One of the crucial reasons for their dominance is their wide use in the automotive industry, wherein they are employed in interior and under-the-hood applications to meet lightweighting and cost-reduction requirements. Mineral filled polypropylene composites are used considerably in home appliances, construction, and consumer goods, due to their balance between performance and affordability. Their compatibility with injection molding and extrusion processes further enhances their appeal to manufacturers, enabling scalable and effective products. The global drive toward further sustainable and energy-effective transportation results has further amplified the demand for featherlight, high-performance accoutrements like mineral filled polypropylene composites. With growing industrialization, particularly across the Asia Pacific, the consumption of these accoutrements is anticipated to remain strong, buttressing their position as the largest product type in the polypropylene compounds market.
"Homopolymer accounted for the largest growth of the polymer type segment of the market in terms of volume"
Homopolymers hold the leading position in the polypropylene compounds market because of their better mechanical properties and industrial applicability. One source of monomer -known as propylene gives homopolymers of polypropylene really high tensile strength, stiffness, and excellent chemical resistance. Injection molding and extrusion are processes many other industries use to manufacture various underground automotive parts, household items, industrial containers, and textiles. Some applications demand sturdy qualities, while others need some weightlessness; considering this, it is the ability of being lightweight yet offering very good rigidity that best wins the job for them. These polypropylene types fill their niches in the broad automotive sector for the production of cells in battery hard cases, certain selections of under-the-hood parts, and interior trims. These operations are made easier and less expensive by these compounds. Homopolymers can also serve as a more basic type of compound, usually mineral filled or glass fiber-reinforced polypropylene, thereby expanding the versatility thereof. This factor will continue to foster demand, keeping them at the forefront in polypropylene compounds.
"Automotive & transportation accounted for the for the fastest-growing end-use industry segment of the polypropylene compounds market in terms of value"
The automotive sector is expected to be the fastest-growing end user segment, and this is attributed to the booming worldwide demand for lightweight, durable, and cost-efficient materials for vehicle manufacturing. Polypropylene compounds are increasingly being used in automobile applications in place of traditional metals that help in reducing vehicle weight and fuel efficiency or battery range extension in EVs, in particular, glass fiber-reinforced and mineral-filled types. These materials provide good mechanical strength, impact resistance, and dimensional stability, making them excellent choices for use in bumpers, dashboards, interior trims, under-the-hood parts, and structural components. The polypropylene compounds are sought by OEMs, who need the materials to be recyclable and highly design-flexible, due to stricter emission norms and the trend of consumers toward fuel-efficient and green vehicles. Faster growth in the market for electric vehicles is projected for polymers, in particular, in the Asia Pacific, Europe, and North America. As vehicle designing moves ahead, the demand for polypropylene compounds will witness sustained growth, being the fastest-growing and most vibrant end-use segment.
"Asia Pacific is projected to be the fastest-growing market for polypropylene compounds during the forecast period"
Asia Pacific will be the fastest-growing region in the polypropylene compounds market on account of its growing industrial base, urbanization, and growing consumption in major end-use industries, including automotive, electronics, construction, and packaging. The increasing move toward electric vehicles (EVs) in China and India continues to drive demand for high-performance polypropylene compounds in structural and interior usage.
Besides, Asia Pacific's low-cost labor, ready availability of raw materials, and favorable government initiatives position it as a manufacturing hub of the world, with investments flowing in from leading global players. Infrastructure expansion and construction growth, especially in Southeast Asia, increasingly drive demand for mineral-filled and glass-fiber-reinforced polypropylene compounds. With strong industrial growth and supportive economic conditions, the Asia Pacific will dominate the worldwide market for polypropylene compounds in terms of growth.
- By Company Type: Tier 1 - 40%, Tier 2 - 25%, and Tier 3 - 35%
- By Designation: Managers- 20%, Directors - 30%, and Others - 50%
- By Region: North America - 20%, Europe - 15%, APAC - 30%, South America-10%, Middle East & Africa- 25%
The polypropylene compounds market comprises major players like LyondellBasell Industries Holdings B.V. (US), Kingfa Sci.&Tech. Co.,Ltd. (China), LG Chem (South Korea), Mitsui Chemicals, Inc. (Japan), Washington Penn (US), Mitsubishi Chemical Group Corporation (Japan), SABIC (Saudi Arabia), Repsol (Spain), Sumitomo Chemical Co., Ltd. (Japan), Borealis GmbH (Austria), GS Caltex Corporation (South Korea), LOTTE Chemical Corporation (South Korea), TotalEnergies (France), and TASNEE (Saudi Arabia).
The study includes in-depth competitive analysis of these key players in the polypropylene compounds market, with their company profiles, recent developments, and key market strategies.
Research Coverage
This report segments the market for polypropylene compounds on the basis of product type, polymer type, processing method, end-use industry, and region and provides estimations for the overall value of the market across various regions. A detailed analysis of key industry players has been conducted to provide insights into their business overviews, products & services, key strategies, and expansions associated with the market for polypropylene compounds.
Key benefits of buying this report
This research report is focuses on various levels of analysis - industry analysis (industry trends), market ranking analysis of top players, and company profiles, which together provide an overall view of the competitive landscape; emerging and high-growth segments of the polypropylene compounds market; high-growth regions; and market drivers, restraints, opportunities, and challenges.
The report provides insights on the following pointers:
- Analysis of Drivers: (Growing adoption of lightweight materials in automotive applications), restraints ( Strict environmental regulations and raw material price volatility act as restraint ), opportunities (Increasing emphasis on sustainable and recyclable polypropylene compounds due to their environmental benefits), and challenges (High reliance on petroleum feedstocks and complex recycling needs pose key sustainability and waste management challenges) influencing the growth of the polypropylene compounds market.
- Market Penetration: Comprehensive information on the polypropylene compounds offered by top players in the global polypropylene compounds market.
- Product Development/Innovation: Detailed insights on upcoming technologies, research & development activities, product launches, expansions, and partnerships in the polypropylene compounds market.
- Market Development: Comprehensive information about lucrative emerging markets, the report analyzes the markets for polypropylene compounds across regions.
- Market Capacity: Production capacities of companies producing polypropylene compounds are provided wherever available with upcoming capacities for the polypropylene compounds market.
- Competitive Assessment: In-depth assessment of market shares, strategies, products, and manufacturing capabilities of leading players in the polypropylene compounds market.
TABLE OF CONTENTS
1 INTRODUCTION
- 1.1 STUDY OBJECTIVES
- 1.2 MARKET DEFINITION
- 1.3 STUDY SCOPE
- 1.3.1 MARKETS COVERED AND REGIONAL SNAPSHOT
- 1.3.2 INCLUSIONS & EXCLUSIONS
- 1.3.3 YEARS CONSIDERED
- 1.3.4 CURRENCY CONSIDERED
- 1.3.5 UNITS CONSIDERED
- 1.4 LIMITATIONS
- 1.5 STAKEHOLDERS
2 RESEARCH METHODOLOGY
- 2.1 RESEARCH DATA
- 2.1.1 SECONDARY DATA
- 2.1.1.1 Key data from secondary sources
- 2.1.2 PRIMARY DATA
- 2.1.2.1 Key data from primary sources
- 2.1.2.2 Key primary sources
- 2.1.2.3 Key interview participants
- 2.1.2.4 Breakdown of interviews with experts
- 2.1.2.5 Key industry insights
- 2.1.1 SECONDARY DATA
- 2.2 BASE NUMBER CALCULATION
- 2.2.1 SUPPLY-SIDE ANALYSIS
- 2.2.2 DEMAND-SIDE ANALYSIS
- 2.3 GROWTH FORECAST
- 2.3.1 SUPPLY SIDE
- 2.3.2 DEMAND SIDE
- 2.4 MARKET SIZE ESTIMATION
- 2.4.1 BOTTOM-UP APPROACH
- 2.4.2 TOP-DOWN APPROACH
- 2.5 DATA TRIANGULATION
- 2.6 RESEARCH ASSUMPTIONS
- 2.7 GROWTH FORECAST
- 2.8 RISK ASSESSMENT
- 2.9 FACTOR ANALYSIS
3 EXECUTIVE SUMMARY
4 PREMIUM INSIGHTS
- 4.1 ATTRACTIVE OPPORTUNITIES FOR PLAYERS IN POLYPROPYLENE COMPOUNDS MARKET
- 4.2 POLYPROPYLENE COMPOUNDS MARKET, BY POLYMER TYPE
- 4.3 POLYPROPYLENE COMPOUNDS MARKET, BY PRODUCT TYPE
- 4.4 POLYPROPYLENE COMPOUNDS MARKET, BY END-USE INDUSTRY
- 4.5 POLYPROPYLENE COMPOUNDS MARKET, BY PROCESSING METHOD
- 4.6 POLYPROPYLENE COMPOUNDS MARKET, BY COUNTRY
5 MARKET OVERVIEW
- 5.1 INTRODUCTION
- 5.2 MARKET DYNAMICS
- 5.2.1 DRIVERS
- 5.2.1.1 Rising demand for polypropylene compounds from packaging and electronics sectors
- 5.2.1.2 Growing adoption of lightweight materials in automotive applications
- 5.2.1.3 Low cost and versatility of polypropylene compounds
- 5.2.2 RESTRAINTS
- 5.2.2.1 Strict environmental regulations and raw material price volatility
- 5.2.3 OPPORTUNITIES
- 5.2.3.1 Growing focus on sustainable and recyclable polypropylene compounds due to their environmental benefits
- 5.2.3.2 Surging demand for polypropylene compounds in developing nations
- 5.2.4 CHALLENGES
- 5.2.4.1 Reliance on petroleum feedstocks causing sustainability and environmental concerns
- 5.2.1 DRIVERS
- 5.3 IMPACT OF GENERATIVE AI ON POLYPROPYLENE COMPOUNDS MARKET
- 5.3.1 INTRODUCTION
- 5.3.2 CHEMICAL COMPANIES EMBRACING AI ACROSS VARIOUS BUSINESS AREAS
- 5.3.3 USE OF GENERATIVE AI IN POLYPROPYLENE COMPOUNDS MARKET
- 5.3.4 IMPACT OF AI ON POLYPROPYLENE COMPOUNDS MARKET
6 INDUSTRY TRENDS
- 6.1 INTRODUCTION
- 6.2 TRENDS/DISRUPTIONS IMPACTING CUSTOMER BUSINESS
- 6.3 SUPPLY CHAIN ANALYSIS
- 6.4 IMPACT OF 2025 US TARIFF- POLYPROPYLENE COMPOUNDS MARKET
- 6.4.1 INTRODUCTION
- 6.4.2 KEY TARIFF RATES
- 6.4.3 PRICE IMPACT ANALYSIS
- 6.5 IMPACT ON COUNTRY/REGION
- 6.5.1 NORTH AMERICA
- 6.5.2 EUROPE
- 6.5.3 ASIA PACIFIC
- 6.6 IMPACT ON END-USE INDUSTRIES
- 6.7 INVESTMENT AND FUNDING SCENARIO
- 6.8 PRICING ANALYSIS
- 6.8.1 AVERAGE SELLING PRICE TREND OF POLYPROPYLENE COMPOUNDS, BY REGION
- 6.8.2 AVERAGE SELLING PRICE TREND, BY PRODUCT TYPE
- 6.8.3 AVERAGE SELLING PRICE TREND, BY END-USE INDUSTRY
- 6.8.4 AVERAGE SELLING PRICE TREND OF PRODUCT TYPE, BY KEY PLAYER
- 6.9 ECOSYSTEM ANALYSIS
- 6.10 TECHNOLOGY ANALYSIS
- 6.10.1 KEY TECHNOLOGIES
- 6.10.2 COMPLEMENTARY TECHNOLOGIES
- 6.11 PATENT ANALYSIS
- 6.11.1 METHODOLOGY
- 6.11.2 GRANTED PATENTS
- 6.11.2.1 Patent publication trends
- 6.11.3 INSIGHTS
- 6.11.4 LEGAL STATUS
- 6.11.5 JURISDICTION ANALYSIS
- 6.11.6 TOP APPLICANTS
- 6.12 TRADE ANALYSIS
- 6.12.1 IMPORT SCENARIO (HS CODE 390210)
- 6.12.2 EXPORT SCENARIO (HS CODE 390210)
- 6.13 KEY CONFERENCES AND EVENTS
- 6.14 TARIFF AND REGULATORY LANDSCAPE
- 6.14.1 TARIFF ANALYSIS
- 6.14.2 REGULATORY BODIES, GOVERNMENT AGENCIES, AND OTHER ORGANIZATIONS
- 6.14.3 STANDARDS AND REGULATIONS
- 6.15 PORTER'S FIVE FORCES ANALYSIS
- 6.15.1 THREAT OF NEW ENTRANTS
- 6.15.2 THREAT OF SUBSTITUTES
- 6.15.3 BARGAINING POWER OF SUPPLIERS
- 6.15.4 BARGAINING POWER OF BUYERS
- 6.15.5 INTENSITY OF COMPETITIVE RIVALRY
- 6.16 KEY STAKEHOLDERS AND BUYING CRITERIA
- 6.16.1 KEY STAKEHOLDERS IN BUYING PROCESS
- 6.16.2 BUYING CRITERIA
- 6.17 MACROECONOMIC OUTLOOK
- 6.17.1 GDP TRENDS AND FORECASTS, BY COUNTRY
- 6.18 CASE STUDY ANALYSIS
- 6.18.1 EXCEED TOUGH PP HELPS KINGFA DEVELOP HIGH-PERFORMANCE, LIGHTWEIGHT MATERIALS TO MEET VALUE CHAIN DEMANDS
- 6.18.2 MAKING CARD GAMES MORE CIRCULAR WITH BORCYCLE M
- 6.18.3 RECYCLING OF POLYPROPYLENE RECOVERED FROM A COMPOSTING PLANT: MECHANICAL BEHAVIOR OF COMPOUNDS WITH VIRGIN PLASTIC
7 POLYPROPYLENE COMPOUNDS MARKET, BY PRODUCT TYPE
- 7.1 INTRODUCTION
- 7.2 MINERAL-FILLED POLYPROPYLENE COMPOUNDS
- 7.2.1 REINFORCED WITH FILLERS LIKE TALC OR CALCIUM CARBONATE TO ENHANCE STIFFNESS, DIMENSIONAL STABILITY, AND HEAT RESISTANCE FOR AUTOMOTIVE, APPLIANCE, AND INDUSTRIAL APPLICATIONS
- 7.3 GLASS FIBER REINFORCED
- 7.3.1 OFFER HIGH STRENGTH, STIFFNESS, AND THERMAL STABILITY IDEAL FOR STRUCTURAL COMPONENTS IN AUTOMOTIVE, ELECTRICAL, AND INDUSTRIAL APPLICATIONS TO DRIVE MARKET
- 7.4 POLYPROPYLENE-BASED TPO
- 7.4.1 EXCELLENT IMPACT RESISTANCE, FLEXIBILITY, AND WEATHERABILITY TO MAKE THEM IDEAL FOR AUTOMOTIVE AND OUTDOOR APPLICATIONS
- 7.5 POLYPROPYLENE-BASED TPV
- 7.5.1 GROWING DEMAND FOR HIGH-PERFORMANCE ELASTOMERIC COMPOUNDS OFFERING RUBBER-LIKE FLEXIBILITY AND DURABILITY WITH THERMOPLASTIC PROCESSABILITY
- 7.6 ADDITIVE CONCENTRATES
- 7.6.1 POLYPROPYLENE MATERIALS WITH HIGH LEVELS OF FUNCTIONAL ADDITIVES LIKE UV STABILIZERS, FLAME RETARDANTS, OR ANTIMICROBIALS TO IMPROVE PERFORMANCE ACROSS DIVERSE APPLICATIONS
8 POLYPROPYLENE COMPOUNDS MARKET, BY POLYMER TYPE
- 8.1 INTRODUCTION
- 8.2 HOMOPOLYMER
- 8.2.1 RIGID, HIGH-STRENGTH POLYPROPYLENE IDEAL FOR STRUCTURAL APPLICATIONS REQUIRING STIFFNESS, CHEMICAL RESISTANCE, AND HEAT STABILITY
- 8.3 RANDOM COPOLYMER
- 8.3.1 ENHANCED CLARITY, FLEXIBILITY, AND LOW-TEMPERATURE IMPACT RESISTANCE MAKING THEM IDEAL FOR PACKAGING, MEDICAL, AND CONSUMER APPLICATIONS
- 8.4 IMPACT COPOLYMERS
- 8.4.1 HIGH TOUGHNESS AND LOW-TEMPERATURE IMPACT RESISTANCE MAKING THEM IDEAL FOR VARIOUS INDUSTRIAL APPLICATIONS
9 POLYPROPYLENE COMPOUNDS MARKET, BY PROCESSING METHOD
- 9.1 INTRODUCTION
- 9.2 INJECTION MOLDING
- 9.2.1 PRECISION, SCALABILITY, AND COMPATIBILITY WITH DIVERSE POLYPROPYLENE COMPOUND FORMULATIONS TO DRIVE SEGMENT
- 9.3 BLOW MOLDING
- 9.3.1 RISING DEMAND FOR LIGHTWEIGHT, HOLLOW, AND CHEMICALLY RESISTANT PARTS IN PACKAGING AND INDUSTRIAL SECTORS TO DRIVE SEGMENT
10 POLYPROPYLENE COMPOUNDS MARKET, BY END-USE INDUSTRY
- 10.1 INTRODUCTION
- 10.2 AUTOMOTIVE & TRANSPORTATION
- 10.2.1 RISING EV PRODUCTION AND LIGHTWEIGHTING INITIATIVES TO MEET FUEL EFFICIENCY AND EMISSION REGULATIONS
- 10.3 CONSTRUCTION
- 10.3.1 RISING INFRASTRUCTURE INVESTMENTS, URBANIZATION, AND DEMAND FOR DURABLE, COST-EFFECTIVE, AND SUSTAINABLE BUILDING MATERIALS TO DRIVE CONSTRUCTION MARKET
- 10.4 ELECTRICAL & ELECTRONICS
- 10.4.1 FLAME-RETARDANT AND INSULATING PROPERTIES ESSENTIAL FOR HOUSINGS, CONNECTORS, AND COMPONENT CASINGS TO DRIVE MARKET
- 10.5 PACKAGING
- 10.5.1 LOW WEIGHT, DURABILITY, AND RECYCLABILITY TO DRIVE APPLICATIONS IN CONTAINERS, CLOSURES, AND FLEXIBLE PACKAGING
- 10.6 MEDICAL
- 10.6.1 STERILE, LOW WEIGHT, AND CHEMICAL RESISTANCE TO DRIVE DEMAND IN DEVICES AND DIAGNOSTIC EQUIPMENT
- 10.7 TEXTILE
- 10.7.1 HIGH DEMAND FOR LIGHTWEIGHT, DURABLE, AND MOISTURE-RESISTANT FIBERS AND FABRICS FOR NON-WOVENS AND INDUSTRIAL TEXTILES TO DRIVE MARKET
- 10.8 OTHER END-USE INDUSTRIES
- 10.8.1 WATER INDUSTRY
- 10.8.2 ENERGY INDUSTRY
11 POLYPROPYLENE COMPOUNDS, BY REGION
- 11.1 INTRODUCTION
- 11.2 ASIA PACIFIC
- 11.2.1 CHINA
- 11.2.1.1 Increasing EV production, electronics manufacturing, and solar investments to drive market
- 11.2.2 JAPAN
- 11.2.2.1 Strong demand from semiconductors, electronics, automotive, and medical industries to drive market
- 11.2.3 INDIA
- 11.2.3.1 Growing automotive production, electronics manufacturing, and packaging sector to drive market
- 11.2.4 SOUTH KOREA
- 11.2.4.1 Rapid EV production, electronics manufacturing, and presence of major compound producers to drive market
- 11.2.5 REST OF ASIA PACIFIC
- 11.2.1 CHINA
- 11.3 NORTH AMERICA
- 11.3.1 US
- 11.3.1.1 Surging EV production, booming electronics exports, and growing demand for lightweight, sustainable materials to drive market
- 11.3.2 CANADA
- 11.3.2.1 Increasing investments in EVs, electronics manufacturing, and government-backed clean mobility initiatives to drive market
- 11.3.3 MEXICO
- 11.3.3.1 Rising EV production, strong FDI in electronics manufacturing, and expanding automotive industry to drive market
- 11.3.1 US
- 11.4 SOUTH AMERICA
- 11.4.1 BRAZIL
- 11.4.1.1 Rapid automotive production, infrastructure expansion, and booming electronics and appliance sectors to drive market
- 11.4.2 ARGENTINA
- 11.4.2.1 Automotive manufacturing strength, construction activity, and rising demand in packaging and appliances to drive market
- 11.4.3 REST OF SOUTH AMERICA
- 11.4.1 BRAZIL
- 11.5 EUROPE
- 11.5.1 GERMANY
- 11.5.1.1 Powerful automotive, medical, and electronics industries to drive market
- 11.5.2 FRANCE
- 11.5.2.1 Rapid automotive production, sustainable packaging laws, and globally competitive healthcare sector to drive market
- 11.5.3 ITALY
- 11.5.3.1 Luxury automotive production, advanced electronics manufacturing, robust medical device sector, and growing infrastructure development to drive market
- 11.5.4 UK
- 11.5.4.1 Strong automotive production, large-scale construction activities, and competitive medical technology sector to drive market
- 11.5.5 SPAIN
- 11.5.5.1 Rising demand in medical, packaging, and electronics applications to drive market
- 11.5.6 REST OF EUROPE
- 11.5.1 GERMANY
- 11.6 MIDDLE EAST & AFRICA
- 11.6.1 GCC COUNTRIES
- 11.6.1.1 Saudi Arabia
- 11.6.1.1.1 Rapid automotive production, booming construction projects, rising electronics consumption, and expanding packaging demand to drive market
- 11.6.1.2 UAE
- 11.6.1.2.1 Growth in manufacturing, construction, and automotive development to drive market
- 11.6.1.3 Rest of GCC countries
- 11.6.1.1 Saudi Arabia
- 11.6.2 EGYPT
- 11.6.2.1 Strategic investments and favorable trade positioning to drive market
- 11.6.3 TURKIYE
- 11.6.3.1 Growth in automotive manufacturing, construction development, white goods production, and presence of global compounders to drive market
- 11.6.4 SOUTH AFRICA
- 11.6.4.1 Automotive production, growing electronics consumption, and steady construction activities to drive market
- 11.6.5 REST OF MIDDLE EAST & AFRICA
- 11.6.1 GCC COUNTRIES
12 COMPETITIVE LANDSCAPE
- 12.1 INTRODUCTION
- 12.2 KEY PLAYER STRATEGIES/RIGHT TO WIN
- 12.3 MARKET SHARE ANALYSIS
- 12.3.1 MARKET SHARE OF KEY PLAYERS
- 12.4 REVENUE ANALYSIS, 2021-2025
- 12.5 BRAND/PRODUCT COMPARATIVE ANALYSIS
- 12.6 COMPANY EVALUATION MATRIX, KEY PLAYERS, 2024
- 12.6.1 STARS
- 12.6.2 EMERGING LEADERS
- 12.6.3 PERVASIVE PLAYERS
- 12.6.4 PARTICIPANTS
- 12.6.5 COMPANY FOOTPRINT
- 12.6.6 REGION FOOTPRINT
- 12.6.7 POLYMER TYPE FOOTPRINT
- 12.6.8 PRODUCT TYPE FOOTPRINT
- 12.6.9 END-USE INDUSTRY FOOTPRINT
- 12.7 COMPANY EVALUATION MATRIX, STARTUPS/SMES, 2024
- 12.7.1 PROGRESSIVE COMPANIES
- 12.7.2 RESPONSIVE COMPANIES
- 12.7.3 DYNAMIC COMPANIES
- 12.7.4 STARTING BLOCKS
- 12.7.5 COMPETITIVE BENCHMARKING
- 12.7.5.1 Detailed list of key startups/SMEs
- 12.7.5.2 Competitive benchmarking of key start-ups/SMEs
- 12.7.6 VALUATION AND FINANCIAL METRICS OF KEY POLYPROPYLENE COMPOUNDS VENDORS
- 12.8 COMPETITIVE SCENARIO
- 12.8.1 PRODUCT LAUNCHES
- 12.8.2 DEALS
- 12.8.3 EXPANSIONS
- 12.8.4 OTHERS
13 COMPANY PROFILES
- 13.1 KEY PLAYERS
- 13.1.1 LYONDELLBASELL INDUSTRIES HOLDINGS B.V.
- 13.1.1.1 Business overview
- 13.1.1.2 Products/Solutions/Services offered
- 13.1.1.3 Recent developments
- 13.1.1.3.1 Product launches
- 13.1.1.3.2 Deals
- 13.1.1.3.3 Expansions
- 13.1.1.4 MnM view
- 13.1.1.4.1 Right to win
- 13.1.1.4.2 Strategic choices
- 13.1.1.4.3 Weaknesses and competitive threats
- 13.1.2 SABIC
- 13.1.2.1 Business overview
- 13.1.2.2 Products/Solutions/Services offered
- 13.1.2.3 Recent developments
- 13.1.2.3.1 Product launches
- 13.1.2.3.2 Deals
- 13.1.2.3.3 Expansions
- 13.1.2.4 MnM view
- 13.1.2.4.1 Right to win
- 13.1.2.4.2 Strategic choices
- 13.1.2.4.3 Weaknesses and competitive threats
- 13.1.3 REPSOL
- 13.1.3.1 Business overview
- 13.1.3.2 Products/Solutions/Services offered
- 13.1.3.3 Recent developments
- 13.1.3.3.1 Product launches
- 13.1.3.3.2 Deals
- 13.1.3.3.3 Expansions
- 13.1.3.4 MnM view
- 13.1.3.4.1 Right to win
- 13.1.3.4.2 Strategic choices
- 13.1.3.4.3 Weaknesses and competitive threats
- 13.1.4 SUMITOMO CHEMICAL CO., LTD.
- 13.1.4.1 Business overview
- 13.1.4.2 Products/Solutions/Services offered
- 13.1.4.3 Recent developments
- 13.1.4.3.1 Deals
- 13.1.4.3.2 Expansions
- 13.1.4.4 MnM view
- 13.1.4.4.1 Right to win
- 13.1.4.4.2 Strategic choices
- 13.1.4.4.3 Weaknesses and competitive threats
- 13.1.5 BOREALIS GMBH
- 13.1.5.1 Business overview
- 13.1.5.2 Products/Solutions/Services offered
- 13.1.5.3 Recent developments
- 13.1.5.3.1 Product launches
- 13.1.5.3.2 Expansions
- 13.1.5.4 MnM view
- 13.1.5.4.1 Right to win
- 13.1.5.4.2 Strategic choices
- 13.1.5.4.3 Weaknesses and competitive threats
- 13.1.6 GS CALTEX CORPORATION
- 13.1.6.1 Business overview
- 13.1.6.2 Products/Solutions/Services offered
- 13.1.6.3 Recent developments
- 13.1.6.3.1 Others
- 13.1.6.4 MnM view
- 13.1.6.4.1 Right to win
- 13.1.6.4.2 Strategic choices
- 13.1.6.4.3 Weaknesses and competitive threats
- 13.1.7 LOTTE CHEMICAL CORPORATION
- 13.1.7.1 Business overview
- 13.1.7.2 Products/Solutions/Services offered
- 13.1.7.3 Recent developments
- 13.1.7.3.1 Product launches
- 13.1.7.4 MnM view
- 13.1.7.4.1 Right to win
- 13.1.7.4.2 Strategic choices
- 13.1.7.4.3 Weaknesses and competitive threats
- 13.1.8 TOTALENERGIES
- 13.1.8.1 Business overview
- 13.1.8.2 Products/Solutions/Services offered
- 13.1.8.3 Recent developments
- 13.1.8.3.1 Expansions
- 13.1.8.4 MnM view
- 13.1.8.4.1 Right to win
- 13.1.8.4.2 Strategic choices
- 13.1.8.4.3 Weaknesses and competitive threats
- 13.1.9 KINGFA SCI.&TECH. CO., LTD.
- 13.1.9.1 Business overview
- 13.1.9.2 Products/Solutions/Services offered
- 13.1.9.3 Recent developments
- 13.1.9.3.1 Expansions
- 13.1.9.4 MnM view
- 13.1.9.4.1 Right to win
- 13.1.9.4.2 Strategic choices
- 13.1.9.4.3 Weaknesses and competitive threats
- 13.1.10 LG CHEM
- 13.1.10.1 Business overview
- 13.1.10.2 Products/Solutions/Services offered
- 13.1.10.3 MnM view
- 13.1.10.3.1 Right to win
- 13.1.10.3.2 Strategic choices
- 13.1.10.3.3 Weaknesses and competitive threats
- 13.1.11 TASNEE
- 13.1.11.1 Business overview
- 13.1.11.2 Products/Solutions/Services offered
- 13.1.11.3 MnM view
- 13.1.11.3.1 Right to win
- 13.1.11.3.2 Strategic choices
- 13.1.11.3.3 Weaknesses and competitive threats
- 13.1.12 MITSUI CHEMICALS, INC.
- 13.1.12.1 Business overview
- 13.1.12.2 Products/Solutions/Services offered
- 13.1.12.3 Recent developments
- 13.1.12.3.1 Deals
- 13.1.12.3.2 Expansions
- 13.1.12.4 MnM view
- 13.1.12.4.1 Right to win
- 13.1.12.4.2 Strategic choices
- 13.1.12.4.3 Weaknesses and competitive threats
- 13.1.13 WASHINGTON PENN
- 13.1.13.1 Business overview
- 13.1.13.2 Products/Solutions/Services offered
- 13.1.13.3 Recent developments
- 13.1.13.3.1 Expansions
- 13.1.13.4 MnM view
- 13.1.13.4.1 Right to win
- 13.1.13.4.2 Strategic choices
- 13.1.13.4.3 Weaknesses and competitive threats
- 13.1.14 MITSUBISHI CHEMICAL GROUP CORPORATION
- 13.1.14.1 Business overview
- 13.1.14.2 Products/Solutions/Services offered
- 13.1.14.3 Recent developments
- 13.1.14.3.1 Deals
- 13.1.14.3.2 Expansions
- 13.1.14.4 MnM view
- 13.1.14.4.1 Right to win
- 13.1.14.4.2 Strategic choices
- 13.1.14.4.3 Weaknesses and competitive threats
- 13.1.1 LYONDELLBASELL INDUSTRIES HOLDINGS B.V.
- 13.2 OTHER PLAYERS
- 13.2.1 NATPET SCHULMAN SPECIALITY PLASTIC COMPOUNDS
- 13.2.2 CHEMSOURCE EGYPT
- 13.2.3 EUP EGYPT
- 13.2.4 RAVAGO
- 13.2.5 SILON
- 13.2.6 RTP COMPANY
- 13.2.7 ECOBAT
- 13.2.8 SHAMS JAVAID ARVAND
- 13.2.9 ARAD EXIR POLYMER COMPANY
- 13.2.10 INNO-COMP KFT.
- 13.2.11 A.D. COMPOUND S.P.A.
- 13.2.12 MACOMASS VERKAUFS AG
14 APPENDIX
- 14.1 DISCUSSION GUIDE
- 14.2 KNOWLEDGESTORE: MARKETSANDMARKETS' SUBSCRIPTION PORTAL
- 14.3 CUSTOMIZATION OPTIONS
- 14.4 RELATED REPORTS
- 14.5 AUTHOR DETAILS
List of Tables
- TABLE 1 AVERAGE SELLING PRICE OF POLYPROPYLENE COMPOUNDS, BY REGION, 2021-2024 (USD/KG)
- TABLE 2 AVERAGE SELLING PRICE, BY PRODUCT TYPE, 2021-2024 (USD/KG)
- TABLE 3 AVERAGE SELLING PRICE, BY END-USE INDUSTRY, 2021-2024 (USD/KG)
- TABLE 4 AVERAGE SELLING PRICE OF PRODUCT TYPE, BY KEY PLAYER, (USD/KG)
- TABLE 5 ROLE OF COMPANIES IN POLYPROPYLENE COMPOUNDS ECOSYSTEM
- TABLE 6 POLYPROPYLENE COMPOUNDS MARKET: KEY TECHNOLOGIES
- TABLE 7 POLYPROPYLENE COMPOUNDS MARKET: COMPLEMENTARY TECHNOLOGIES
- TABLE 8 TOTAL NUMBER OF PATENTS, 2015-2024
- TABLE 9 TOP OWNERS OF PATENTS RELATED TO POLYPROPYLENE COMPOUNDS, 2015-2024
- TABLE 10 POLYPROPYLENE COMPOUNDS MARKET: LIST OF KEY PATENTS, 2015-2024
- TABLE 11 POLYPROPYLENE COMPOUNDS MARKET: LIST OF KEY CONFERENCES AND EVENTS, 2025-2026
- TABLE 12 TARIFF DATA RELATED TO HS CODE 390210-COMPLIANT PRODUCTS, BY COUNTRY, 2024
- TABLE 13 NORTH AMERICA: REGULATORY BODIES, GOVERNMENT AGENCIES, AND OTHER ORGANIZATIONS
- TABLE 14 EUROPE: REGULATORY BODIES, GOVERNMENT AGENCIES, AND OTHER ORGANIZATIONS
- TABLE 15 ASIA PACIFIC: REGULATORY BODIES, GOVERNMENT AGENCIES, AND OTHER ORGANIZATIONS
- TABLE 16 SOUTH AMERICA: REGULATORY BODIES, GOVERNMENT AGENCIES, AND OTHER ORGANIZATIONS
- TABLE 17 MIDDLE EAST AND AFRICA: REGULATORY BODIES, GOVERNMENT AGENCIES, AND OTHER ORGANIZATIONS
- TABLE 18 POLYPROPYLENE COMPOUNDS MARKET: STANDARDS AND REGULATIONS
- TABLE 19 POLYPROPYLENE COMPOUNDS MARKET: PORTER'S FIVE FORCES ANALYSIS
- TABLE 20 INFLUENCE OF STAKEHOLDERS ON BUYING PROCESS, BY END-USE INDUSTRY
- TABLE 21 KEY BUYING CRITERIA, BY END-USE INDUSTRY
- TABLE 22 GDP TRENDS AND FORECASTS, BY COUNTRY, 2023-2025 (USD MILLION)
- TABLE 23 POLYPROPYLENE COMPOUNDS MARKET, BY PRODUCT TYPE, 2021-2024 (USD MILLION)
- TABLE 24 POLYPROPYLENE COMPOUNDS MARKET, BY PRODUCT TYPE, 2025-2030 (USD MILLION)
- TABLE 25 POLYPROPYLENE COMPOUNDS MARKET, BY PRODUCT TYPE, 2021-2024 (KILOTON)
- TABLE 26 POLYPROPYLENE COMPOUNDS MARKET, BY PRODUCT TYPE, 2025-2030 (KILOTON)
- TABLE 27 POLYPROPYLENE COMPOUNDS MARKET, BY POLYMER TYPE, 2021-2024 (USD MILLION)
- TABLE 28 POLYPROPYLENE COMPOUNDS MARKET, BY POLYMER TYPE, 2025-2030 (USD MILLION)
- TABLE 29 POLYPROPYLENE COMPOUNDS MARKET, BY POLYMER TYPE, 2021-2024 (KILOTON)
- TABLE 30 POLYPROPYLENE COMPOUNDS MARKET, BY POLYMER TYPE, 2025-2030 (KILOTON)
- TABLE 31 POLYPROPYLENE COMPOUNDS MARKET, BY PROCESSING METHOD, 2021-2024 (USD MILLION)
- TABLE 32 POLYPROPYLENE COMPOUNDS MARKET, BY PROCESSING METHOD, 2025-2030 (USD MILLION)
- TABLE 33 POLYPROPYLENE COMPOUNDS MARKET, BY END-USE INDUSTRY, 2021-2024 (USD MILLION)
- TABLE 34 POLYPROPYLENE COMPOUNDS MARKET, BY END-USE INDUSTRY, 2025-2030 (USD MILLION)
- TABLE 35 POLYPROPYLENE COMPOUNDS MARKET, BY END-USE INDUSTRY, 2021-2024 (KILOTON)
- TABLE 36 POLYPROPYLENE COMPOUNDS MARKET, BY END-USE INDUSTRY, 2025-2030 (KILOTON)
- TABLE 37 POLYPROPYLENE COMPOUNDS MARKET, BY REGION, 2021-2024 (USD MILLION)
- TABLE 38 POLYPROPYLENE COMPOUNDS MARKET, BY REGION, 2025-2030 (USD MILLION)
- TABLE 39 POLYPROPYLENE COMPOUNDS MARKET, BY REGION, 2021-2024 (KILOTON)
- TABLE 40 POLYPROPYLENE COMPOUNDS MARKET, BY REGION, 2025-2030 (KILOTON)
- TABLE 41 ASIA PACIFIC: POLYPROPYLENE COMPOUNDS MARKET, BY COUNTRY, 2021-2024 (USD MILLION)
- TABLE 42 ASIA PACIFIC: POLYPROPYLENE COMPOUNDS MARKET, BY COUNTRY, 2025-2030 (USD MILLION)
- TABLE 43 ASIA PACIFIC: POLYPROPYLENE COMPOUNDS MARKET, BY COUNTRY, 2021-2024 (KILOTON)
- TABLE 44 ASIA PACIFIC: POLYPROPYLENE COMPOUNDS MARKET, BY COUNTRY, 2025-2030 (KILOTON)
- TABLE 45 ASIA PACIFIC: POLYPROPYLENE COMPOUNDS MARKET, BY PRODUCT TYPE, 2021-2024 (USD MILLION)
- TABLE 46 ASIA PACIFIC: POLYPROPYLENE COMPOUNDS MARKET, BY PRODUCT TYPE, 2025-2030 (USD MILLION)
- TABLE 47 ASIA PACIFIC: POLYPROPYLENE COMPOUNDS MARKET, BY PRODUCT TYPE, 2021-2024 (KILOTON)
- TABLE 48 ASIA PACIFIC: POLYPROPYLENE COMPOUNDS MARKET, BY PRODUCT TYPE, 2025-2030 (KILOTON)
- TABLE 49 ASIA PACIFIC: POLYPROPYLENE COMPOUNDS MARKET, BY POLYMER TYPE, 2021-2024 (USD MILLION)
- TABLE 50 ASIA PACIFIC: POLYPROPYLENE COMPOUNDS MARKET, BY POLYMER TYPE, 2025-2030 (USD MILLION)
- TABLE 51 ASIA PACIFIC: POLYPROPYLENE COMPOUNDS MARKET, BY POLYMER TYPE, 2021-2024 (KILOTON)
- TABLE 52 ASIA PACIFIC: POLYPROPYLENE COMPOUNDS MARKET, BY POLYMER TYPE, 2025-2030 (KILOTON)
- TABLE 53 ASIA PACIFIC: POLYPROPYLENE COMPOUNDS MARKET, BY END-USE INDUSTRY, 2021-2024 (USD MILLION)
- TABLE 54 ASIA PACIFIC: POLYPROPYLENE COMPOUNDS MARKET, BY END-USE INDUSTRY, 2025-2030 (USD MILLION)
- TABLE 55 ASIA PACIFIC: POLYPROPYLENE COMPOUNDS MARKET, BY END-USE INDUSTRY, 2021-2024 (KILOTON)
- TABLE 56 ASIA PACIFIC: POLYPROPYLENE COMPOUNDS MARKET, BY END-USE INDUSTRY, 2025-2030 (KILOTON)
- TABLE 57 CHINA: POLYPROPYLENE COMPOUNDS MARKET, BY END USE INDUSTRY, 2021-2024 (USD MILLION)
- TABLE 58 CHINA: POLYPROPYLENE COMPOUNDS MARKET, BY END-USE INDUSTRY, 2025-2030 (USD MILLION)
- TABLE 59 CHINA: POLYPROPYLENE COMPOUNDS MARKET, BY END-USE INDUSTRY, 2021-2024 (KILOTON)
- TABLE 60 CHINA: POLYPROPYLENE COMPOUNDS MARKET, BY END-USE INDUSTRY, 2025-2030 (KILOTON)
- TABLE 61 JAPAN: POLYPROPYLENE COMPOUNDS MARKET, BY END USE INDUSTRY, 2021-2024 (USD MILLION)
- TABLE 62 JAPAN: POLYPROPYLENE COMPOUNDS MARKET, BY END-USE INDUSTRY, 2025-2030 (USD MILLION)
- TABLE 63 JAPAN: POLYPROPYLENE COMPOUNDS MARKET, BY END-USE INDUSTRY, 2021-2024 (KILOTON)
- TABLE 64 JAPAN: POLYPROPYLENE COMPOUNDS MARKET, BY END-USE INDUSTRY, 2025-2030 (KILOTON)
- TABLE 65 INDIA: POLYPROPYLENE COMPOUNDS MARKET, BY END USE INDUSTRY, 2021-2024 (USD MILLION)
- TABLE 66 INDIA: POLYPROPYLENE COMPOUNDS MARKET, BY END-USE INDUSTRY, 2025-2030 (USD MILLION)
- TABLE 67 INDIA: POLYPROPYLENE COMPOUNDS MARKET, BY END-USE INDUSTRY, 2021-2024 (KILOTON)
- TABLE 68 INDIA: POLYPROPYLENE COMPOUNDS MARKET, BY END-USE INDUSTRY, 2025-2030 (KILOTON)
- TABLE 69 SOUTH KOREA: POLYPROPYLENE COMPOUNDS MARKET, BY END USE INDUSTRY, 2021-2024 (USD MILLION)
- TABLE 70 SOUTH KOREA: POLYPROPYLENE COMPOUNDS MARKET, BY END-USE INDUSTRY, 2025-2030 (USD MILLION)
- TABLE 71 SOUTH KOREA: POLYPROPYLENE COMPOUNDS MARKET, BY END-USE INDUSTRY, 2021-2024 (KILOTON)
- TABLE 72 SOUTH KOREA: POLYPROPYLENE COMPOUNDS MARKET, BY END-USE INDUSTRY, 2025-2030 (KILOTON)
- TABLE 73 REST OF ASIA PACIFIC: POLYPROPYLENE COMPOUNDS MARKET, BY END USE INDUSTRY, 2021-2024 (USD MILLION)
- TABLE 74 REST OF ASIA PACIFIC: POLYPROPYLENE COMPOUNDS MARKET, BY END-USE INDUSTRY, 2025-2030 (USD MILLION)
- TABLE 75 REST OF ASIA PACIFIC: POLYPROPYLENE COMPOUNDS MARKET, BY END-USE INDUSTRY, 2021-2024 (KILOTON)
- TABLE 76 REST OF ASIA PACIFIC: POLYPROPYLENE COMPOUNDS MARKET, BY END-USE INDUSTRY, 2025-2030 (KILOTON)
- TABLE 77 NORTH AMERICA: POLYPROPYLENE COMPOUNDS MARKET, BY COUNTRY, 2021-2024 (USD MILLION)
- TABLE 78 NORTH AMERICA: POLYPROPYLENE COMPOUNDS MARKET, BY COUNTRY, 2025-2030 (USD MILLION)
- TABLE 79 NORTH AMERICA: POLYPROPYLENE COMPOUNDS MARKET, BY COUNTRY, 2021-2024 (KILOTON)
- TABLE 80 NORTH AMERICA: POLYPROPYLENE COMPOUNDS MARKET, BY COUNTRY, 2025-2030 (KILOTON)
- TABLE 81 NORTH AMERICA: POLYPROPYLENE COMPOUNDS MARKET, BY PRODUCT TYPE, 2021-2024 (USD MILLION)
- TABLE 82 NORTH AMERICA: POLYPROPYLENE COMPOUNDS MARKET, BY PRODUCT TYPE, 2025-2030 (USD MILLION)
- TABLE 83 NORTH AMERICA: POLYPROPYLENE COMPOUNDS MARKET, BY PRODUCT TYPE, 2021-2024 (KILOTON)
- TABLE 84 NORTH AMERICA: POLYPROPYLENE COMPOUNDS MARKET, BY PRODUCT TYPE, 2025-2030 (KILOTON)
- TABLE 85 NORTH AMERICA: POLYPROPYLENE COMPOUNDS MARKET, BY POLYMER TYPE, 2021-2024 (USD MILLION)
- TABLE 86 NORTH AMERICA: POLYPROPYLENE COMPOUNDS MARKET, BY POLYMER TYPE, 2025-2030 (USD MILLION)
- TABLE 87 NORTH AMERICA: POLYPROPYLENE COMPOUNDS MARKET, BY POLYMER TYPE, 2021-2024 (KILOTON)
- TABLE 88 NORTH AMERICA: POLYPROPYLENE COMPOUNDS MARKET, BY POLYMER TYPE, 2025-2030 (KILOTON)
- TABLE 89 NORTH AMERICA: POLYPROPYLENE COMPOUNDS MARKET, BY END-USE INDUSTRY, 2021-2024 (USD MILLION)
- TABLE 90 NORTH AMERICA: POLYPROPYLENE COMPOUNDS MARKET, BY END-USE INDUSTRY, 2025-2030 (USD MILLION)
- TABLE 91 NORTH AMERICA: POLYPROPYLENE COMPOUNDS MARKET, BY END-USE INDUSTRY, 2021-2024 (KILOTON)
- TABLE 92 NORTH AMERICA: POLYPROPYLENE COMPOUNDS MARKET, BY END-USE INDUSTRY, 2025-2030 (KILOTON)
- TABLE 93 US POLYPROPYLENE COMPOUNDS MARKET, BY END-USE INDUSTRY, 2021-2024 (USD MILLION)
- TABLE 94 US: POLYPROPYLENE COMPOUNDS MARKET, BY END-USE INDUSTRY, 2025-2030 (USD MILLION)
- TABLE 95 US: POLYPROPYLENE COMPOUNDS MARKET, BY END-USE INDUSTRY, 2021-2024 (KILOTON)
- TABLE 96 US: POLYPROPYLENE COMPOUNDS MARKET, BY END-USE INDUSTRY, 2025-2030 (KILOTON)
- TABLE 97 CANADA: POLYPROPYLENE COMPOUNDS MARKET, BY END-USE INDUSTRY, 2021-2024 (USD MILLION)
- TABLE 98 CANADA: POLYPROPYLENE COMPOUNDS MARKET, BY END-USE INDUSTRY, 2025-2030 (USD MILLION)
- TABLE 99 CANADA: POLYPROPYLENE COMPOUNDS MARKET, BY END-USE INDUSTRY, 2021-2024 (KILOTON)
- TABLE 100 CANADA: POLYPROPYLENE COMPOUNDS MARKET, BY END-USE INDUSTRY, 2025-2030 (KILOTON)
- TABLE 101 MEXICO: POLYPROPYLENE COMPOUNDS MARKET, BY END-USE INDUSTRY, 2021-2024 (USD MILLION)
- TABLE 102 MEXICO: POLYPROPYLENE COMPOUNDS MARKET, BY END-USE INDUSTRY, 2025-2030 (USD MILLION)
- TABLE 103 MEXICO: POLYPROPYLENE COMPOUNDS MARKET, BY END-USE INDUSTRY, 2021-2024 (KILOTON)
- TABLE 104 MEXICO: POLYPROPYLENE COMPOUNDS MARKET, BY END-USE INDUSTRY, 2025-2030 (KILOTON)
- TABLE 105 SOUTH AMERICA: POLYPROPYLENE COMPOUNDS MARKET, BY COUNTRY, 2021-2024 (USD MILLION)
- TABLE 106 SOUTH AMERICA: POLYPROPYLENE COMPOUNDS MARKET, BY COUNTRY, 2025-2030 (USD MILLION)
- TABLE 107 SOUTH AMERICA: POLYPROPYLENE COMPOUNDS MARKET, BY COUNTRY, 2021-2024 (KILOTON)
- TABLE 108 SOUTH AMERICA: POLYPROPYLENE COMPOUNDS MARKET, BY COUNTRY, 2025-2030 (KILOTON)
- TABLE 109 SOUTH AMERICA: POLYPROPYLENE COMPOUNDS MARKET, BY PRODUCT TYPE, 2021-2024 (USD MILLION)
- TABLE 110 SOUTH AMERICA: POLYPROPYLENE COMPOUNDS MARKET, BY PRODUCT TYPE, 2025-2030 (USD MILLION)
- TABLE 111 SOUTH AMERICA: POLYPROPYLENE COMPOUNDS MARKET, BY PRODUCT TYPE, 2021-2024 (KILOTON)
- TABLE 112 SOUTH AMERICA: POLYPROPYLENE COMPOUNDS MARKET, BY PRODUCT TYPE, 2025-2030 (KILOTON)
- TABLE 113 SOUTH AMERICA: POLYPROPYLENE COMPOUNDS MARKET, BY POLYMER TYPE, 2021-2024 (USD MILLION)
- TABLE 114 SOUTH AMERICA: POLYPROPYLENE COMPOUNDS MARKET, BY POLYMER TYPE, 2025-2030 (USD MILLION)
- TABLE 115 SOUTH AMERICA: POLYPROPYLENE COMPOUNDS MARKET, BY POLYMER TYPE, 2021-2024 (KILOTON)
- TABLE 116 SOUTH AMERICA: POLYPROPYLENE COMPOUNDS MARKET, BY POLYMER TYPE, 2025-2030 (KILOTON)
- TABLE 117 SOUTH AMERICA: POLYPROPYLENE COMPOUNDS MARKET, BY END-USE INDUSTRY, 2021-2024 (USD MILLION)
- TABLE 118 SOUTH AMERICA: POLYPROPYLENE COMPOUNDS MARKET, BY END-USE INDUSTRY, 2025-2030 (USD MILLION)
- TABLE 119 SOUTH AMERICA: POLYPROPYLENE COMPOUNDS MARKET, BY END-USE INDUSTRY, 2021-2024 (KILOTON)
- TABLE 120 SOUTH AMERICA: POLYPROPYLENE COMPOUNDS MARKET, BY END-USE INDUSTRY, 2025-2030 (KILOTON)
- TABLE 121 BRAZIL: POLYPROPYLENE COMPOUNDS MARKET, BY END-USE INDUSTRY, 2021-2024 (USD MILLION)
- TABLE 122 BRAZIL: POLYPROPYLENE COMPOUNDS MARKET, BY END-USE INDUSTRY, 2025-2030 (USD MILLION)
- TABLE 123 BRAZIL: POLYPROPYLENE COMPOUNDS MARKET, BY END-USE INDUSTRY, 2021-2024 (KILOTON)
- TABLE 124 BRAZIL: POLYPROPYLENE COMPOUNDS MARKET, BY END-USE INDUSTRY, 2025-2030 (KILOTON)
- TABLE 125 ARGENTINA POLYPROPYLENE COMPOUNDS MARKET, BY END-USE INDUSTRY, 2021-2024 (USD MILLION)
- TABLE 126 ARGENTINA: POLYPROPYLENE COMPOUNDS MARKET, BY END-USE INDUSTRY, 2025-2030 (USD MILLION)
- TABLE 127 ARGENTINA: POLYPROPYLENE COMPOUNDS MARKET, BY END-USE INDUSTRY, 2021-2024 (KILOTON)
- TABLE 128 ARGENTINA: POLYPROPYLENE COMPOUNDS MARKET, BY END-USE INDUSTRY, 2025-2030 (KILOTON)
- TABLE 129 REST OF SOUTH AMERICA: POLYPROPYLENE COMPOUNDS MARKET, BY END-USE INDUSTRY, 2021-2024 (USD MILLION)
- TABLE 130 REST OF SOUTH AMERICA: POLYPROPYLENE COMPOUNDS MARKET, BY END-USE INDUSTRY, 2025-2030 (USD MILLION)
- TABLE 131 REST OF SOUTH AMERICA: POLYPROPYLENE COMPOUNDS MARKET, BY END-USE INDUSTRY, 2021-2024 (KILOTON)
- TABLE 132 REST OF SOUTH AMERICA: POLYPROPYLENE COMPOUNDS MARKET, BY END-USE INDUSTRY, 2025-2030 (KILOTON)
- TABLE 133 EUROPE: POLYPROPYLENE COMPOUNDS MARKET, BY COUNTRY, 2021-2024 (USD MILLION)
- TABLE 134 EUROPE: POLYPROPYLENE COMPOUNDS MARKET, BY COUNTRY, 2025-2030 (USD MILLION)
- TABLE 135 EUROPE: POLYPROPYLENE COMPOUNDS MARKET, BY COUNTRY, 2021-2024 (KILOTON)
- TABLE 136 EUROPE: POLYPROPYLENE COMPOUNDS MARKET, BY COUNTRY, 2025-2030 (KILOTON)
- TABLE 137 EUROPE: POLYPROPYLENE COMPOUNDS MARKET, BY PRODUCT TYPE, 2021-2024 (USD MILLION)
- TABLE 138 EUROPE: POLYPROPYLENE COMPOUNDS MARKET, BY PRODUCT TYPE, 2025-2030 (USD MILLION)
- TABLE 139 EUROPE: POLYPROPYLENE COMPOUNDS MARKET, BY PRODUCT TYPE, 2021-2024 (KILOTON)
- TABLE 140 EUROPE: POLYPROPYLENE COMPOUNDS MARKET, BY PRODUCT TYPE, 2025-2030 (KILOTON)
- TABLE 141 EUROPE: POLYPROPYLENE COMPOUNDS MARKET, BY POLYMER TYPE, 2021-2024 (USD MILLION)
- TABLE 142 EUROPE: POLYPROPYLENE COMPOUNDS MARKET, BY POLYMER TYPE, 2025-2030 (USD MILLION)
- TABLE 143 EUROPE: POLYPROPYLENE COMPOUNDS MARKET, BY POLYMER TYPE, 2021-2024 (KILOTON)
- TABLE 144 EUROPE: POLYPROPYLENE COMPOUNDS MARKET, BY POLYMER TYPE, 2025-2030 (KILOTON)
- TABLE 145 EUROPE: POLYPROPYLENE COMPOUNDS MARKET, BY END-USE INDUSTRY, 2021-2024 (USD MILLION)
- TABLE 146 EUROPE: POLYPROPYLENE COMPOUNDS MARKET, BY END-USE INDUSTRY, 2025-2030 (USD MILLION)
- TABLE 147 EUROPE: POLYPROPYLENE COMPOUNDS MARKET, BY END-USE INDUSTRY, 2021-2024 (KILOTON)
- TABLE 148 EUROPE: POLYPROPYLENE COMPOUNDS MARKET, BY END-USE INDUSTRY, 2025-2030 (KILOTON)
- TABLE 149 GERMANY: POLYPROPYLENE COMPOUNDS MARKET, BY END-USE INDUSTRY, 2021-2024 (USD MILLION)
- TABLE 150 GERMANY: POLYPROPYLENE COMPOUNDS MARKET, BY END-USE INDUSTRY, 2025-2030 (USD MILLION)
- TABLE 151 GERMANY: POLYPROPYLENE COMPOUNDS MARKET, BY END-USE INDUSTRY, 2021-2024 (KILOTON)
- TABLE 152 GERMANY: POLYPROPYLENE COMPOUNDS MARKET, BY END-USE INDUSTRY, 2025-2030 (KILOTON)
- TABLE 153 FRANCE: POLYPROPYLENE COMPOUNDS MARKET, BY END-USE INDUSTRY, 2021-2024 (USD MILLION)
- TABLE 154 FRANCE: POLYPROPYLENE COMPOUNDS MARKET, BY END-USE INDUSTRY, 2025-2030 (USD MILLION)
- TABLE 155 FRANCE: POLYPROPYLENE COMPOUNDS MARKET, BY END-USE INDUSTRY, 2021-2024 (KILOTON)
- TABLE 156 FRANCE: POLYPROPYLENE COMPOUNDS MARKET, BY END-USE INDUSTRY, 2025-2030 (KILOTON)
- TABLE 157 ITALY: POLYPROPYLENE COMPOUNDS MARKET, BY END-USE INDUSTRY, 2021-2024 (USD MILLION)
- TABLE 158 ITALY: POLYPROPYLENE COMPOUNDS MARKET, BY END-USE INDUSTRY, 2025-2030 (USD MILLION)
- TABLE 159 ITALY: POLYPROPYLENE COMPOUNDS MARKET, BY END-USE INDUSTRY, 2021-2024 (KILOTON)
- TABLE 160 ITALY: POLYPROPYLENE COMPOUNDS MARKET, BY END-USE INDUSTRY, 2025-2030 (KILOTON)
- TABLE 161 UK: POLYPROPYLENE COMPOUNDS MARKET, BY END-USE INDUSTRY, 2021-2024 (USD MILLION)
- TABLE 162 UK: POLYPROPYLENE COMPOUNDS MARKET, BY END-USE INDUSTRY, 2025-2030 (USD MILLION)
- TABLE 163 UK: POLYPROPYLENE COMPOUNDS MARKET, BY END-USE INDUSTRY, 2021-2024 (KILOTON)
- TABLE 164 UK: POLYPROPYLENE COMPOUNDS MARKET, BY END-USE INDUSTRY, 2025-2030 (KILOTON)
- TABLE 165 SPAIN: POLYPROPYLENE COMPOUNDS MARKET, BY END-USE INDUSTRY, 2021-2024 (USD MILLION)
- TABLE 166 SPAIN: POLYPROPYLENE COMPOUNDS MARKET, BY END-USE INDUSTRY, 2025-2030 (USD MILLION)
- TABLE 167 SPAIN: POLYPROPYLENE COMPOUNDS MARKET, BY END-USE INDUSTRY, 2021-2024 (KILOTON)
- TABLE 168 SPAIN: POLYPROPYLENE COMPOUNDS MARKET, BY END-USE INDUSTRY, 2025-2030 (KILOTON)
- TABLE 169 REST OF EUROPE: POLYPROPYLENE COMPOUNDS MARKET, BY END-USE INDUSTRY, 2021-2024 (USD MILLION)
- TABLE 170 REST OF EUROPE: POLYPROPYLENE COMPOUNDS MARKET, BY END-USE INDUSTRY, 2025-2030 (USD MILLION)
- TABLE 171 REST OF EUROPE: POLYPROPYLENE COMPOUNDS MARKET, BY END-USE INDUSTRY, 2021-2024 (KILOTON)
- TABLE 172 REST OF EUROPE: POLYPROPYLENE COMPOUNDS MARKET, BY END-USE INDUSTRY, 2025-2030 (KILOTON)
- TABLE 173 MIDDLE EAST & AFRICA: POLYPROPYLENE COMPOUNDS MARKET, BY COUNTRY, 2021-2024 (USD MILLION)
- TABLE 174 MIDDLE EAST & AFRICA: POLYPROPYLENE COMPOUNDS MARKET, BY COUNTRY, 2025-2030 (USD MILLION)
- TABLE 175 MIDDLE EAST & AFRICA: POLYPROPYLENE COMPOUNDS MARKET, BY COUNTRY, 2021-2024 (KILOTONS)
- TABLE 176 MIDDLE EAST & AFRICA: POLYPROPYLENE COMPOUNDS MARKET, BY COUNTRY, 2025-2030 (KILOTONS)
- TABLE 177 MIDDLE EAST & AFRICA: POLYPROPYLENE COMPOUNDS MARKET, BY PRODUCT TYPE, 2021-2024 (USD MILLION)
- TABLE 178 MIDDLE EAST & AFRICA: POLYPROPYLENE COMPOUNDS MARKET, BY PRODUCT TYPE, 2025-2030 (USD MILLION)
- TABLE 179 MIDDLE EAST & AFRICA: POLYPROPYLENE COMPOUNDS MARKET, BY PRODUCT TYPE, 2021-2024 (KILOTON)
- TABLE 180 MIDDLE EAST & AFRICA: POLYPROPYLENE COMPOUNDS MARKET, BY PRODUCT TYPE, 2025-2030 (KILOTON)
- TABLE 181 MIDDLE EAST & AFRICA: POLYPROPYLENE COMPOUNDS MARKET, BY POLYMER TYPE, 2021-2024 (USD MILLION)
- TABLE 182 MIDDLE EAST & AFRICA: POLYPROPYLENE COMPOUNDS MARKET, BY POLYMER TYPE, 2025-2030 (USD MILLION)
- TABLE 183 MIDDLE EAST & AFRICA: POLYPROPYLENE COMPOUNDS MARKET, BY POLYMER TYPE, 2021-2024 (KILOTON)
- TABLE 184 MIDDLE EAST & AFRICA: POLYPROPYLENE COMPOUNDS MARKET, BY POLYMER TYPE, 2025-2030 (KILOTON)
- TABLE 185 MIDDLE EAST & AFRICA: POLYPROPYLENE COMPOUNDS MARKET, BY END-USE INDUSTRY, 2021-2024 (USD MILLION)
- TABLE 186 MIDDLE EAST & AFRICA: POLYPROPYLENE COMPOUNDS MARKET, BY END-USE INDUSTRY, 2025-2030 (USD MILLION)
- TABLE 187 MIDDLE EAST & AFRICA: POLYPROPYLENE COMPOUNDS MARKET, BY END-USE INDUSTRY, 2021-2024 (KILOTON)
- TABLE 188 MIDDLE EAST & AFRICA: POLYPROPYLENE COMPOUNDS MARKET, BY END-USE INDUSTRY, 2025-2030 (KILOTON)
- TABLE 189 SAUDI ARABIA: POLYPROPYLENE COMPOUNDS MARKET, BY END-USE INDUSTRY, 2021-2024 (USD MILLION)
- TABLE 190 SAUDI ARABIA: POLYPROPYLENE COMPOUNDS MARKET, BY END-USE INDUSTRY, 2025-2030 (USD MILLION)
- TABLE 191 SAUDI ARABIA: POLYPROPYLENE COMPOUNDS MARKET, BY END-USE INDUSTRY, 2021-2024 (KILOTON)
- TABLE 192 SAUDI ARABIA: POLYPROPYLENE COMPOUNDS MARKET, BY END-USE INDUSTRY, 2025-2030 (KILOTON)
- TABLE 193 UAE: POLYPROPYLENE COMPOUNDS MARKET, BY END-USE INDUSTRY, 2021-2024 (USD MILLION)
- TABLE 194 UAE: POLYPROPYLENE COMPOUNDS MARKET, BY END-USE INDUSTRY, 2025-2030 (USD MILLION)
- TABLE 195 UAE: POLYPROPYLENE COMPOUNDS MARKET, BY END-USE INDUSTRY, 2021-2024 (KILOTON)
- TABLE 196 UAE: POLYPROPYLENE COMPOUNDS MARKET, BY END-USE INDUSTRY, 2025-2030 (KILOTON)
- TABLE 197 REST OF GCC COUNTRIES: POLYPROPYLENE COMPOUNDS MARKET, BY END-USE INDUSTRY, 2021-2024 (USD MILLION)
- TABLE 198 REST OF GCC COUNTRIES: POLYPROPYLENE COMPOUNDS MARKET, BY END-USE INDUSTRY, 2025-2030 (USD MILLION)
- TABLE 199 REST OF GCC COUNTRIES: POLYPROPYLENE COMPOUNDS MARKET, BY END-USE INDUSTRY, 2021-2024 (KILOTON)
- TABLE 200 REST OF GCC COUNTRIES: POLYPROPYLENE COMPOUNDS MARKET, BY END-USE INDUSTRY, 2025-2030 (KILOTON)
- TABLE 201 EGYPT: POLYPROPYLENE COMPOUNDS MARKET, BY END-USE INDUSTRY, 2021-2024 (USD MILLION)
- TABLE 202 EGYPT: POLYPROPYLENE COMPOUNDS MARKET, BY END-USE INDUSTRY, 2025-2030 (USD MILLION)
- TABLE 203 EGYPT: POLYPROPYLENE COMPOUNDS MARKET, BY END-USE INDUSTRY, 2021-2024 (KILOTON)
- TABLE 204 EGYPT: POLYPROPYLENE COMPOUNDS MARKET, BY END-USE INDUSTRY, 2025-2030 (KILOTON)
- TABLE 205 TURKIYE : POLYPROPYLENE COMPOUNDS MARKET, BY END-USE INDUSTRY, 2021-2024 (USD MILLION)
- TABLE 206 TURKIYE : POLYPROPYLENE COMPOUNDS MARKET, BY END-USE INDUSTRY, 2025-2030 (USD MILLION)
- TABLE 207 TURKIYE : POLYPROPYLENE COMPOUNDS MARKET, BY END-USE INDUSTRY, 2021-2024 (KILOTON)
- TABLE 208 TURKIYE: POLYPROPYLENE COMPOUNDS MARKET, BY END-USE INDUSTRY, 2025-2030 (KILOTON)
- TABLE 209 SOUTH AFRICA: POLYPROPYLENE COMPOUNDS MARKET, BY END-USE INDUSTRY, 2021-2024 (USD MILLION)
- TABLE 210 SOUTH AFRICA: POLYPROPYLENE COMPOUNDS MARKET, BY END-USE INDUSTRY, 2025-2030 (USD MILLION)
- TABLE 211 SOUTH AFRICA: POLYPROPYLENE COMPOUNDS MARKET, BY END-USE INDUSTRY, 2021-2024 (KILOTON)
- TABLE 212 SOUTH AFRICA: POLYPROPYLENE COMPOUNDS MARKET, BY END-USE INDUSTRY, 2025-2030 (KILOTON)
- TABLE 213 REST OF MIDDLE EAST & AFRICA: POLYPROPYLENE COMPOUNDS MARKET, BY END-USE INDUSTRY, 2021-2024 (USD MILLION)
- TABLE 214 REST OF MIDDLE EAST & AFRICA: POLYPROPYLENE COMPOUNDS MARKET, BY END-USE INDUSTRY, 2025-2030 (USD MILLION)
- TABLE 215 REST OF MIDDLE EAST & AFRICA: POLYPROPYLENE COMPOUNDS MARKET, BY END-USE INDUSTRY, 2021-2024 (KILOTON)
- TABLE 216 REST OF MIDDLE EAST & AFRICA: POLYPROPYLENE COMPOUNDS MARKET, BY END-USE INDUSTRY, 2025-2030 (KILOTON)
- TABLE 217 OVERVIEW OF STRATEGIES ADOPTED BY KEY POLYPROPYLENE COMPOUNDS MANUFACTURERS
- TABLE 218 POLYPROPYLENE COMPOUNDS MARKET: DEGREE OF COMPETITION
- TABLE 219 POLYPROPYLENE COMPOUNDS: REGION FOOTPRINT
- TABLE 220 POLYPROPYLENE COMPOUNDS: POLYMER TYPE (14 COMPANIES)
- TABLE 221 POLYPROPYLENE COMPOUNDS: PRODUCT TYPE (14 COMPANIES)
- TABLE 222 POLYPROPYLENE COMPOUNDS: END-USE INDUSTRY FOOTPRINT (14 COMPANIES)
- TABLE 223 POLYPROPYLENE COMPOUNDS MARKET: KEY START-UPS/SMES
- TABLE 224 POLYPROPYLENE COMPOUNDS MARKET: COMPETITIVE BENCHMARKING OF KEY START-UPS/SMES
- TABLE 225 POLYPROPYLENE COMPOUNDS MARKET: PRODUCT LAUNCHES, JANUARY 2021- APRIL 2025
- TABLE 226 POLYPROPYLENE COMPOUNDS MARKET: DEALS, JANUARY 2021- APRIL 2025
- TABLE 227 POLYPROPYLENE COMPOUNDS MARKET: EXPANSIONS, JANUARY 2021- APRIL 2025
- TABLE 228 POLYPROPYLENE COMPOUNDS: OTHERS, JANUARY 2021-APRIL 2025
- TABLE 229 LYONDELLBASELL INDUSTRIES HOLDINGS B.V.: COMPANY OVERVIEW
- TABLE 230 LYONDELLBASELL INDUSTRIES HOLDINGS B.V.: PRODUCTS/SOLUTIONS/ SERVICES OFFERED
- TABLE 231 LYONDELLBASELL INDUSTRIES HOLDINGS B.V.: PRODUCT LAUNCHES, JANUARY 2021-APRIL 2025
- TABLE 232 LYONDELLBASELL INDUSTRIES HOLDINGS B.V.: DEALS, JANUARY 2021- APRIL 2025
- TABLE 233 LYONDELLBASELL INDUSTRIES HOLDINGS B.V.: EXPANSIONS, JANUARY 2021-APRIL 2025
- TABLE 234 SABIC: COMPANY OVERVIEW
- TABLE 235 SABIC: PRODUCTS/SOLUTIONS/SERVICES OFFERED
- TABLE 236 SABIC: PRODUCT LAUNCHES, JANUARY 2021-APRIL 2025
- TABLE 237 SABIC: DEALS, JANUARY 2021-APRIL 2025
- TABLE 238 SABIC: EXPANSIONS, JANUARY 2021-APRIL 2025
- TABLE 239 REPSOL: COMPANY OVERVIEW
- TABLE 240 REPSOL: PRODUCTS/SOLUTIONS/SERVICES OFFERED
- TABLE 241 REPSOL: PRODUCT LAUNCHES, JANUARY 2021-APRIL 2025
- TABLE 242 REPSOL: DEALS, JANUARY 2021-APRIL 2025
- TABLE 243 REPSOL: EXPANSIONS, JANUARY 2021-APRIL 2025
- TABLE 244 SUMITOMO CHEMICAL CO., LTD.: COMPANY OVERVIEW
- TABLE 245 SUMITOMO CHEMICAL CO., LTD.: PRODUCTS/SOLUTIONS/SERVICES OFFERED
- TABLE 246 SUMITOMO CHEMICAL CO., LTD.: DEALS, JANUARY 2021-APRIL 2025
- TABLE 247 SUMITOMO CHEMICAL CO., LTD.: EXPANSIONS, JANUARY 2021-APRIL 2025
- TABLE 248 BOREALIS GMBH.: COMPANY OVERVIEW
- TABLE 249 BOREALIS GMBH: PRODUCTS/SOLUTIONS/SERVICES OFFERED
- TABLE 250 BOREALIS GMBH: PRODUCT LAUNCHES, JANUARY 2021-APRIL 2025
- TABLE 251 BOREALIS GMBH: EXPANSIONS, JANUARY 2021-APRIL 2025
- TABLE 252 GS CALTEX CORPORATION: COMPANY OVERVIEW
- TABLE 253 GS CALTEX CORPORATION: PRODUCTS/SOLUTIONS/SERVICES OFFERED
- TABLE 254 GS CALTEX CORPORATION: OTHERS, JANUARY 2021-APRIL 2025
- TABLE 255 LOTTE CHEMICAL CORPORATION: COMPANY OVERVIEW
- TABLE 256 LOTTE CHEMICAL CORPORATION: PRODUCTS/SOLUTIONS/SERVICES OFFERED
- TABLE 257 LOTTE CHEMICAL CORPORATION: PRODUCT LAUNCHES, JANUARY 2021-APRIL 2025
- TABLE 258 TOTALENERGIES: COMPANY OVERVIEW
- TABLE 259 TOTALENERGIES: PRODUCTS/SOLUTIONS/SERVICES OFFERED
- TABLE 260 TOTALENERGIES: EXPANSIONS, JANUARY 2021-APRIL 2025
- TABLE 261 KINGFA SCI.&TECH. CO.,LTD. : COMPANY OVERVIEW
- TABLE 262 KINGFA SCI.&TECH. CO.,LTD. : PRODUCTS/SOLUTIONS/SERVICES OFFERED
- TABLE 263 KINGFA SCI.&TECH. CO.,LTD. : EXPANSIONS, JANUARY 2021-DECEMBER 2024
- TABLE 264 LG CHEM: COMPANY OVERVIEW
- TABLE 265 LG CHEM: PRODUCTS/SOLUTIONS/SERVICES OFFERED
- TABLE 266 TASNEE: COMPANY OVERVIEW
- TABLE 267 TASNEE: PRODUCTS/SOLUTIONS/SERVICES OFFERED
- TABLE 268 MITSUI CHEMICALS, INC.: COMPANY OVERVIEW
- TABLE 269 MITSUI CHEMICALS, INC.: PRODUCTS/SOLUTIONS/SERVICES OFFERED
- TABLE 270 MITSUI CHEMICALS, INC.: DEALS, JANUARY 2021-APRIL 2025
- TABLE 271 MITSUI CHEMICALS, INC.: EXPANSIONS, JANUARY 2019-DECEMBER 2024
- TABLE 272 WASHINGTON PENN: COMPANY OVERVIEW
- TABLE 273 WASHINGTON PENN: PRODUCTS/SOLUTIONS/SERVICES OFFERED
- TABLE 274 WASHINGTON PENN: EXPANSIONS, JANUARY 2019-DECEMBER 2024
- TABLE 275 MITSUBISHI CHEMICAL GROUP CORPORATION: COMPANY OVERVIEW
- TABLE 276 MITSUBISHI CHEMICAL GROUP CORPORATION: PRODUCTS/SOLUTIONS/ SERVICES OFFERED
- TABLE 277 MITSUBISHI CHEMICAL GROUP CORPORATION: DEALS, JANUARY 2021-APRIL 2025
- TABLE 278 MITSUBISHI CHEMICAL GROUP CORPORATION: EXPANSIONS, JANUARY 2019-DECEMBER 2024
- TABLE 279 NATPET SCHULMAN SPECIALITY PLASTIC COMPOUNDS: COMPANY OVERVIEW
- TABLE 280 CHEMSOURCE EGYPT: COMPANY OVERVIEW
- TABLE 281 EUP EGYPT: COMPANY OVERVIEW
- TABLE 282 RAVAGO: COMPANY OVERVIEW
- TABLE 283 SILON: COMPANY OVERVIEW
- TABLE 284 RTP COMPANY: COMPANY OVERVIEW
- TABLE 285 ECOBAT: COMPANY OVERVIEW
- TABLE 286 SHAMS JAVAID ARVAND : COMPANY OVERVIEW
- TABLE 287 ARAD EXIR POLYMER COMPANY: COMPANY OVERVIEW
- TABLE 288 INNO-COMP KFT.: COMPANY OVERVIEW
- TABLE 289 A.D. COMPOUND S.P.A.: COMPANY OVERVIEW
- TABLE 290 MACOMASS VERKAUFS AG: COMPANY OVERVIEW
List of Figures
- FIGURE 1 POLYPROPYLENE COMPOUNDS MARKET SEGMENTATION AND REGIONAL SNAPSHOT
- FIGURE 2 POLYPROPYLENE COMPOUNDS MARKET: RESEARCH DESIGN
- FIGURE 3 MARKET SIZE ESTIMATION METHODOLOGY: SUPPLY-SIDE APPROACH
- FIGURE 4 MARKET SIZE ESTIMATION METHODOLOGY: DEMAND-SIDE APPROACH
- FIGURE 5 MARKET SIZE ESTIMATION METHODOLOGY: REVENUE OF MARKET PLAYERS, 2023
- FIGURE 6 MARKET SIZE ESTIMATION METHODOLOGY: BOTTOM-UP APPROACH
- FIGURE 7 MARKET SIZE ESTIMATION METHODOLOGY: TOP-DOWN APPROACH
- FIGURE 8 POLYPROPYLENE COMPOUNDS MARKET: DATA TRIANGULATION
- FIGURE 9 HOMOPOLYMER SEGMENT TO DOMINATE MARKET IN 2025
- FIGURE 10 GLASS FIBER REINFORCED SEGMENT TO REGISTER HIGHEST GROWTH DURING FORECAST PERIOD
- FIGURE 11 AUTOMOTIVE & TRANSPORTATION SEGMENT TO REGISTER HIGHEST GROWTH BETWEEN 2025 & 2030
- FIGURE 12 INJECTION MOLDING SEGMENT TO DOMINATE MARKET
- FIGURE 13 ASIA PACIFIC TO REGISTER HIGHEST GROWTH DURING FORECAST PERIOD
- FIGURE 14 INCREASING EMPHASIS ON SUSTAINABLE AND RECYCLABLE POLYPROPYLENE COMPOUNDS TO CREATE LUCRATIVE OPPORTUNITIES FOR MARKET PLAYERS
- FIGURE 15 IMPACT COPOLYMER SEGMENT TO REGISTER HIGHEST CAGR DURING FORECAST PERIOD
- FIGURE 16 GLASS FIBER REINFORCED SEGMENT TO REGISTER HIGHEST CAGR DURING FORECAST PERIOD
- FIGURE 17 AUTOMOTIVE & TRANSPORTATION SEGMENT TO REGISTER HIGHEST CAGR FROM 2025 TO 2030
- FIGURE 18 INJECTION MOLDING SEGMENT TO REGISTER HIGHEST CAGR FROM 2025 TO 2030
- FIGURE 19 INDIA TO REGISTER HIGHEST GROWTH DURING FORECAST PERIOD
- FIGURE 20 POLYPROPYLENE COMPOUNDS MARKET: DRIVERS, RESTRAINTS, OPPORTUNITIES, AND CHALLENGES
- FIGURE 21 TRENDS/DISRUPTIONS INFLUENCING CUSTOMER BUSINESS
- FIGURE 22 POLYPROPYLENE COMPOUNDS MARKET: SUPPLY CHAIN ANALYSIS
- FIGURE 23 POLYPROPYLENE COMPOUNDS MARKET: INVESTMENT AND FUNDING SCENARIO, 2024 (USD MILLION)
- FIGURE 24 AVERAGE SELLING PRICE TREND POLYPROPYLENE COMPOUNDS MARKET, BY REGION
- FIGURE 25 POLYPROPYLENE COMPOUNDS: AVERAGE SELLING PRICE TREND OF KEY PLAYERS, BY PRODUCT TYPE
- FIGURE 26 POLYPROPYLENE COMPOUNDS MARKET: ECOSYSTEM ANALYSIS
- FIGURE 27 PATENTS GRANTED OVER LAST 10 YEARS, 2015-2024
- FIGURE 28 PATENT ANALYSIS, BY LEGAL STATUS, 2015-2024
- FIGURE 29 REGIONAL ANALYSIS OF PATENTS GRANTED RELATED TO POLYPROPYLENE COMPOUNDS, 2015-2024
- FIGURE 30 TOP COMPANIES WITH SUBSTANTIAL NUMBER OF PATENTS, 2015-2024
- FIGURE 31 IMPORT DATA RELATED TO HS CODE 390210-COMPLIANT PRODUCTS, BY COUNTRY, 2021-2024 (USD THOUSAND)
- FIGURE 32 EXPORT DATA RELATED TO HS CODE 390210-COMPLIANT PRODUCTS, BY COUNTRY, 2021-2024 (USD THOUSAND)
- FIGURE 33 POLYPROPYLENE COMPOUNDS MARKET: PORTER'S FIVE FORCES ANALYSIS
- FIGURE 34 INFLUENCE OF STAKEHOLDERS ON BUYING PROCESS, BY END-USE INDUSTRY
- FIGURE 35 KEY BUYING CRITERIA, BY END-USE INDUSTRY
- FIGURE 36 GLASS FIBER REINFORCED SEGMENT TO LEAD MARKET DURING FORECAST PERIOD
- FIGURE 37 IMPACT COPOLYMER SEGMENT TO LEAD MARKET DURING FORECAST PERIOD
- FIGURE 38 INJECTION MOLDING SEGMENT TO LEAD MARKET DURING FORECAST PERIOD
- FIGURE 39 AUTOMOTIVE & TRANSPORTATION SEGMENT TO LEAD MARKET DURING FORECAST PERIOD
- FIGURE 40 ASIA PACIFIC TO BE FASTEST-GROWING MARKET DURING FORECAST PERIOD
- FIGURE 41 ASIA PACIFIC: POLYPROPYLENE COMPOUNDS MARKET SNAPSHOT
- FIGURE 42 NORTH AMERICA: POLYPROPYLENE COMPOUNDS MARKET SNAPSHOT
- FIGURE 43 EUROPE: POLYPROPYLENE COMPOUNDS MARKET SNAPSHOT
- FIGURE 44 POLYPROPYLENE COMPOUNDS MARKET: SHARE OF KEY PLAYERS
- FIGURE 45 REVENUE ANALYSIS OF KEY PLAYERS, 2021-2025
- FIGURE 46 POLYPROPYLENE COMPOUNDS MARKET: BRAND/PRODUCT COMPARATIVE ANALYSIS
- FIGURE 47 POLYPROPYLENE COMPOUNDS MARKET: COMPANY EVALUATION MATRIX, 2024
- FIGURE 48 POLYPROPYLENE COMPOUNDS MARKET: OVERALL COMPANY FOOTPRINT
- FIGURE 49 POLYPROPYLENE COMPOUNDS MARKET: COMPANY EVALUATION MATRIX, START-UPS/SMES, 2024
- FIGURE 50 EV/EBITDA OF KEY VENDORS
- FIGURE 51 YEAR-TO-DATE (YTD) PRICE TOTAL RETURN
- FIGURE 52 LYONDELLBASELL INDUSTRIES HOLDINGS B.V.: COMPANY SNAPSHOT
- FIGURE 53 SABIC: COMPANY SNAPSHOT
- FIGURE 54 REPSOL: COMPANY SNAPSHOT
- FIGURE 55 SUMITOMO CHEMICAL CO., LTD.: COMPANY SNAPSHOT
- FIGURE 56 BOREALIS GMBH: COMPANY SNAPSHOT
- FIGURE 57 LOTTE CHEMICAL CORPORATION: COMPANY SNAPSHOT
- FIGURE 58 TOTALENERGIES: COMPANY SNAPSHOT
- FIGURE 59 KINGFA SCI.&TECH. CO.,LTD. : COMPANY SNAPSHOT
- FIGURE 60 LG CHEM: COMPANY SNAPSHOT
- FIGURE 61 TASNEE: COMPANY SNAPSHOT
- FIGURE 62 MITSUI CHEMICALS, INC.: COMPANY SNAPSHOT
- FIGURE 63 MITSUBISHI CHEMICAL GROUP CORPORATION: COMPANY SNAPSHOT

