
PUBLISHER: MarketsandMarkets | PRODUCT CODE: 1804843

PUBLISHER: MarketsandMarkets | PRODUCT CODE: 1804843
Industrial Services Market by SCADA, DCS, MES, Robotics, PLC, Safety System, Industrial PC, 3D Printing, Motor & Drive, PLC, HMI, Service Type (Engineering & Consulting, Installation & Commissioning, Improvement & Maintenance) - Global Forecast to 2030
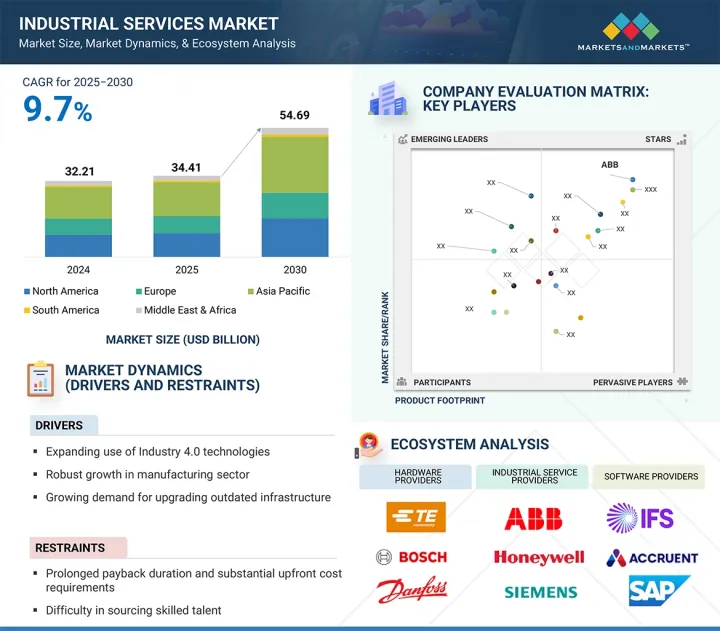
The industrial services market is projected to grow from USD 34.41 billion in 2025 to USD 54.69 billion by 2030, registering a CAGR of 9.7%. Industrial services are increasingly critical across sectors because they ensure equipment reliability, regulatory compliance, and operational efficiency. In the manufacturing industry, these services enable predictive maintenance, process optimization, and integration of digital systems to support Industry 4.0 transformation. In the pharmaceuticals sector, these services ensure adherence to Good Manufacturing Practices (GMPs), cleanroom maintenance, and validation of production environments.
| Scope of the Report | |
|---|---|
| Years Considered for the Study | 2021-2030 |
| Base Year | 2024 |
| Forecast Period | 2025-2030 |
| Units Considered | Value (USD Billion) |
| Segments | By service type, application, end-use industry, and region |
| Regions covered | North America, Europe, APAC, RoW |
The energy & power and utilities sector leverages industrial services for grid maintenance, infrastructure upgrades, and safety compliance. In logistics and transportation, services such as equipment calibration and facility management support streamlined operations. With increasing emphasis on automation, sustainability, and regulatory standards, industrial services offer essential support for smooth and compliant operations across evolving industrial environments.
"Operational Improvement & Maintenance Services to Exhibit Highest CAGR During Forecast Period"
The operational improvement & maintenance services segment is expected to record the highest CAGR during the forecast period due to the increasing focus on enhancing plant efficiency, reducing operational costs, and extending equipment life cycles. As industries prioritize predictive and preventive maintenance strategies, demand for services that minimize unplanned downtime and ensure compliance with safety and environmental regulations is rising. Additionally, the shift toward Industry 4.0 accelerates the adoption of data-driven maintenance and process optimization tools. These services enable real-time monitoring, performance benchmarking, and advanced analytics, driving efficiency across operations. Aging industrial infrastructure in mature markets and growing industrialization in emerging economies further contribute to the segment's growth. Companies also invest in maintenance outsourcing and integrated service contracts to improve cost predictability and operational resilience. Overall, the segment's role in supporting reliability, safety, and performance improvement positions it as a key driver for the growth of the industrial services market.
"Oil & Gas Segment to Hold Second-largest Share of Industrial Services Market, by End-use Industry Throughout Forecast Period"
The oil & gas industry is expected to hold the second-largest share of the industrial services market throughout the forecast period due to its high dependency on operational reliability, safety, and regulatory compliance. With complex infrastructure and critical assets such as rigs, pipelines, and refineries, the industry requires continuous support through specialized maintenance, inspection, and process optimization services. Industrial services are vital in minimizing unplanned downtime, ensuring asset integrity, and extending equipment lifespan. The adoption of predictive analytics, remote monitoring, and digital twin technologies is increasing within the sector to enhance real-time decision-making and operational efficiency. Additionally, the sector's strict environmental and safety regulations drive demand for compliance management and risk mitigation services. As global energy demand continues and oil & gas companies invest in conventional and renewable projects, the need for robust industrial services remains high. These factors collectively contribute to the segment's strong and sustained market presence.
"Germany to Dominate Industrial Services Market in Europe During Forecast Period"
Germany is expected to dominate the industrial services market in Europe during the forecast period due to its strong manufacturing base, particularly in the automotive, engineering, and machinery sectors. As a global hub for precision engineering and industrial innovation, Germany relies heavily on advanced industrial services to ensure operational efficiency, compliance, and technological advancement. The country's emphasis on automation, worker safety, and regulatory adherence further drives the demand for maintenance, logistics, and engineering services. The automotive sector, in particular, remains a major consumer of industrial services for production optimization and supply chain management. Germany's focus on renewable energy and sustainability initiatives also increases the need for industrial services in wind and solar infrastructure maintenance. Strategic investments from companies such as Stellantis and Lilly in high-tech manufacturing facilities highlight growing industrial activity. Combined with government support and a mature research and innovation ecosystem, these factors position Germany as the leading industrial services market in Europe.
- By Company Type: Tier 1 - 10%, Tier 2 - 55%, and Tier 3 - 35%
- By Designation: Directors - 45%, Managers - 25%, and Others - 30%
- By Region: North America - 55%, Europe - 20%, Asia Pacific - 15%, and RoW - 10%
ABB (Switzerland), Honeywell International Inc. (US), Rockwell Automation (US), Schneider Electric (France), Siemens (Germany), GE Vernova (US), Emerson Electric Co. (US), Yokogawa Electric Corporation (Japan), Eaton (Ireland), Mitsubishi Electric Corporation (Japan), ATS Corporation (Canada), Metso (Finland), Yaskawa Electric Corporation (Japan), SKF (Sweden), Atlas Copco AB (Sweden) are some key players in the industrial services market.
The study includes an in-depth competitive analysis of these key players in the industrial services market, with their company profiles, recent developments, and key market strategies.
Research Coverage
This research report categorizes the industrial services market by service type (engineering & consulting, installation & commissioning, operational improvement & maintenance), application (manufacturing execution systems, DCS, PLCs, SCADA systems, motors & drives, industrial robotics, industrial 3D printing solutions, safety systems, industrial PCs, human-machine interfaces), end-use industry (automotive, aerospace, chemicals, food & beverages, metals & mining, oil & gas, pharmaceuticals, energy & power, water & wastewater, semiconductor, paper & pulp, and other end-use industries), and by region (North America, Europe, Asia Pacific, and Rest of the World). The report's scope covers detailed information regarding the major factors, such as drivers, restraints, challenges, and opportunities, influencing the growth of the industrial services market. A thorough analysis of the key industry players has provided insights into their business overview, solutions, and products; key strategies include contracts, partnerships, agreements, product launches, and mergers and acquisitions in the industrial services market. This report covers the competitive analysis of upcoming startups in the industrial services ecosystem.
Reasons to Buy This Report
The report will help market leaders and new entrants with information on the closest approximations of the revenue numbers for the overall industrial services market and its subsegments. It will also help stakeholders understand the competitive landscape and gain more insights to position their businesses better and plan suitable go-to-market strategies. The report also helps stakeholders understand the market pulse and provides information on key market drivers, restraints, challenges, and opportunities.
The report provides insights on the following pointers:
- Analysis of key drivers (expanding use of industry 4.0 technologies, robust growth in the manufacturing sector, growing demand for upgrading outdated infrastructure, rising strategic focus on international growth among manufacturing firms), restraints (prolonged payback duration and substantial upfront cost requirements, difficulty in sourcing skilled talent), opportunities (increasing focus on sustainability and emission control, rising focus on strengthening digital security frameworks), and challenges (technology disruption accelerating obsolescence risks, intensely competitive market landscape)
- Product Development/Innovation: Detailed insights on upcoming technologies, research & development activities, and product & service launches in the industrial services market
- Market Development: Comprehensive information about lucrative markets by analyzing the industrial services market across varied regions
- Market Diversification: Exhaustive information about newly launched products and services, untapped geographies, recent developments, and investments in the industrial services market
- Competitive Assessment: In-depth assessment of market shares, growth strategies, and product offerings of leading players in the industrial services market, such as ABB (Switzerland), Honeywell International Inc. (US), Rockwell Automation (US), Schneider Electric (France), Siemens (Germany), GE Vernova (US), Emerson Electric Co. (US), Yokogawa Electric Corporation (Japan), Eaton (Ireland), and Mitsubishi Electric Corporation (Japan), among others.
TABLE OF CONTENTS
1 INTRODUCTION
- 1.1 STUDY OBJECTIVES
- 1.2 MARKET DEFINITION
- 1.3 STUDY SCOPE
- 1.3.1 MARKETS COVERED AND REGIONAL SCOPE
- 1.3.2 INCLUSIONS AND EXCLUSIONS
- 1.3.3 YEARS CONSIDERED
- 1.4 CURRENCY CONSIDERED
- 1.5 LIMITATIONS
- 1.6 STAKEHOLDERS
- 1.7 SUMMARY OF CHANGES
2 RESEARCH METHODOLOGY
- 2.1 RESEARCH DATA
- 2.1.1 SECONDARY DATA
- 2.1.1.1 Major secondary sources
- 2.1.1.2 Key data from secondary sources
- 2.1.2 PRIMARY DATA
- 2.1.2.1 Intended participants and key opinion leaders in primary interviews
- 2.1.2.2 List of major participants in primary interviews
- 2.1.2.3 Key data from primary sources
- 2.1.2.4 Breakdown of primaries
- 2.1.3 SECONDARY AND PRIMARY RESEARCH
- 2.1.3.1 Key industry insights
- 2.1.1 SECONDARY DATA
- 2.2 MARKET SIZE ESTIMATION
- 2.2.1 BOTTOM-UP APPROACH
- 2.2.1.1 Approach to arrive at market size using bottom-up analysis (demand side)
- 2.2.2 TOP-DOWN APPROACH
- 2.2.2.1 Approach to arrive at market size using top-down analysis (supply side)
- 2.2.1 BOTTOM-UP APPROACH
- 2.3 DATA TRIANGULATION
- 2.4 RESEARCH ASSUMPTIONS
- 2.5 RISK ASSESSMENT
- 2.6 STUDY LIMITATIONS
3 EXECUTIVE SUMMARY
4 PREMIUM INSIGHTS
- 4.1 ATTRACTIVE OPPORTUNITIES IN INDUSTRIAL SERVICES MARKET
- 4.2 INDUSTRIAL SERVICES MARKET IN NORTH AMERICA, BY COUNTRY AND APPLICATION
- 4.3 INDUSTRIAL SERVICES MARKET IN ASIA PACIFIC, BY APPLICATION
- 4.4 GLOBAL INDUSTRIAL SERVICES MARKET, BY COUNTRY
5 MARKET OVERVIEW
- 5.1 INTRODUCTION
- 5.2 MARKET DYNAMICS
- 5.2.1 DRIVERS
- 5.2.1.1 Increasing adoption of Industry 4.0 technology
- 5.2.1.2 Booming manufacturing sector worldwide
- 5.2.1.3 Pressing need to upgrade outdated infrastructure
- 5.2.1.4 Rising focus of manufacturing firms on expanding their market reach
- 5.2.2 RESTRAINTS
- 5.2.2.1 High capital barriers and delayed returns
- 5.2.2.2 Shortage of skilled workforce
- 5.2.3 OPPORTUNITIES
- 5.2.3.1 Global shift toward sustainability, energy efficiency, and emission reduction
- 5.2.3.2 Rising focus on strengthening digital security frameworks
- 5.2.4 CHALLENGES
- 5.2.4.1 Obsolescence risks stemming from rapid technological advancements
- 5.2.4.2 Intensely competitive market landscape
- 5.2.1 DRIVERS
- 5.3 TRENDS/DISRUPTIONS IMPACTING CUSTOMER BUSINESS
- 5.4 VALUE CHAIN ANALYSIS
- 5.5 ECOSYSTEM ANALYSIS
- 5.6 TECHNOLOGY ANALYSIS
- 5.6.1 KEY TECHNOLOGIES
- 5.6.1.1 Internet of Things (IoT)
- 5.6.1.2 Augmented reality (AR) and virtual reality (VR)
- 5.6.1.3 Automation and robotics
- 5.6.1.4 Big data analytics
- 5.6.1.5 Artificial intelligence (AI)
- 5.6.2 COMPLEMENTARY TECHNOLOGIES
- 5.6.2.1 Blockchain and supply chain management
- 5.6.2.2 Edge computing and 5G
- 5.6.2.3 Digital twins and predictive maintenance
- 5.6.2.4 Cybersecurity solutions and data encryption
- 5.6.3 ADJACENT TECHNOLOGIES
- 5.6.3.1 5G connectivity
- 5.6.3.2 Renewable energy technologies
- 5.6.3.3 Smart building technologies
- 5.6.3.4 Food safety technologies
- 5.6.1 KEY TECHNOLOGIES
- 5.7 PATENT ANALYSIS
- 5.8 TRADE ANALYSIS
- 5.9 TARIFF ANALYSIS
- 5.10 PORTER'S FIVE FORCES ANALYSIS
- 5.10.1 THREAT OF NEW ENTRANTS
- 5.10.2 THREAT OF SUBSTITUTES
- 5.10.3 BARGAINING POWER OF SUPPLIERS
- 5.10.4 BARGAINING POWER OF BUYERS
- 5.10.5 INTENSITY OF COMPETITIVE RIVALRY
- 5.11 KEY STAKEHOLDERS AND BUYING CRITERIA
- 5.11.1 KEY STAKEHOLDERS IN BUYING PROCESS
- 5.11.2 BUYING CRITERIA
- 5.12 CASE STUDY ANALYSIS
- 5.12.1 INDIA-BASED CEMENT MANUFACTURER COLLABORATED WITH ABB TO OPTIMIZE OPERATIONS
- 5.12.2 NESTLE PARTNERED WITH SCHNEIDER ELECTRIC TO IMPROVE OPERATIONAL EFFICIENCY
- 5.12.3 BP COLLABORATED WITH GENERAL ELECTRIC TO ENHANCE PERFORMANCE AND RELIABILITY OF INDUSTRIAL EQUIPMENT AND MACHINERY
- 5.12.4 PROCTER & GAMBLE COLLABORATED WITH ROCKWELL AUTOMATION TO IMPROVE MANUFACTURING PROCESSES, REDUCE DOWNTIME, AND ENHANCE PRODUCT QUALITY
- 5.13 STANDARDS AND REGULATORY LANDSCAPE
- 5.13.1 REGULATORY BODIES, GOVERNMENT AGENCIES, AND OTHER ORGANIZATIONS
- 5.13.2 STANDARDS AND REGULATIONS RELATED TO INDUSTRIAL SERVICES
- 5.13.2.1 ISO 9001:2015 - Quality Management Systems
- 5.13.2.2 ISO 14001:2015 - Environmental Management Systems
- 5.13.2.3 ISO 45001:2018 - Occupational Health and Safety Management Systems
- 5.13.2.4 ASME B31.3 - Process Piping
- 5.13.2.5 NFPA 70 - National Electrical Code (NEC)
- 5.13.2.6 API 510 - Pressure Vessel Inspection Code: In-service Inspection, Rating, Repair, and Alteration
- 5.13.2.7 OSHA 29 CFR 1910 - Occupational Safety and Health Standards
- 5.13.2.8 IEC 61511 - Functional Safety - Safety Instrumented Systems for Process Industry Sector
- 5.14 KEY CONFERENCES AND EVENTS, 2025-2026
- 5.15 IMPACT OF AI ON INDUSTRIAL SERVICES MARKET
- 5.15.1 INTRODUCTION
- 5.15.2 AI-SPECIFIC USE CASES
- 5.16 IMPACT OF 2025 US TARIFFS - OVERVIEW
- 5.16.1 INTRODUCTION
- 5.16.2 KEY TARIFF RATES
- 5.16.3 PRICE IMPACT ANALYSIS
- 5.16.4 IMPACT ON COUNTRIES/REGIONS
- 5.16.4.1 US
- 5.16.4.2 Europe
- 5.16.4.3 Asia Pacific
- 5.16.5 IMPACT ON END-USE INDUSTRIES
6 INDUSTRIAL SERVICES MARKET, BY SERVICE TYPE
- 6.1 INTRODUCTION
- 6.2 ENGINEERING & CONSULTING
- 6.2.1 GROWING COMPLEXITY OF LARGE-SCALE INDUSTRIAL PROJECTS TO BOOST DEMAND
- 6.3 INSTALLATION & COMMISSIONING
- 6.3.1 NEED FOR APPROPRIATE SETUP, INTEGRATION, AND VERIFICATION OF INDUSTRIAL SYSTEMS TO FUEL SEGMENTAL GROWTH
- 6.4 OPERATIONAL IMPROVEMENT & MAINTENANCE
- 6.4.1 RISING NEED FOR SCHEDULED MAINTENANCE TO ENSURE CONTINUOUS OPERATIONS TO BOOST DEMAND
7 INDUSTRIAL SERVICES MARKET, BY APPLICATION
- 7.1 INTRODUCTION
- 7.2 MES
- 7.2.1 GROWING ADOPTION OF INDUSTRY 4.0 AND SMART FACTORY INITIATIVES TO BOOST DEMAND
- 7.3 DCS
- 7.3.1 GREATER EMPHASIS ON IMPROVING PLANT EFFICIENCY AND MINIMIZING MANUAL INTERVENTION TO ELEVATE DEMAND
- 7.4 PLC
- 7.4.1 EXCELLENCE IN IDENTIFYING POTENTIAL FAILURES IN ADVANCE TO STIMULATE ADOPTION
- 7.5 SCADA SYSTEM
- 7.5.1 STRONG FOCUS ON OPTIMIZING INDUSTRIAL OPERATIONS TO STIMULATE DEMAND
- 7.6 MOTOR & DRIVE
- 7.6.1 GROWING INCLINATION TOWARD PREDICTIVE ANALYTICS AND SMART MAINTENANCE TO DRIVE MARKET
- 7.6.2 DIGITAL TECHNOLOGIES USED IN MOTORS AND DRIVES
- 7.6.2.1 Artificial intelligence
- 7.6.2.2 Smart sensors
- 7.6.2.3 Connectivity technologies
- 7.7 INDUSTRIAL ROBOT
- 7.7.1 DEPLOYMENT OF COLLABORATIVE ROBOTS IN ASSEMBLY AND INSPECTION APPLICATIONS TO PROPEL MARKET
- 7.8 INDUSTRIAL 3D PRINTER
- 7.8.1 SURGING USE OF ADDITIVE MANUFACTURING IN PROTOTYPING AND COMPLEX PART PRODUCTION TO FACILITATE MARKET GROWTH
- 7.9 FUNCTIONAL SAFETY SYSTEM
- 7.9.1 POTENTIAL TO ENSURE SYSTEM INTEGRITY AND SAFETY TO PROMOTE ADOPTION
- 7.9.2 BURNER MANAGEMENT SYSTEM (BMS)
- 7.9.3 EMERGENCY SHUTDOWN (ESD) SYSTEM
- 7.9.4 FIRE & GAS MONITORING AND CONTROL SYSTEM
- 7.9.5 HIGH-INTEGRITY PRESSURE PROTECTION SYSTEM (HIPPS)
- 7.9.6 TURBOMACHINERY CONTROL (TMC) SYSTEM
- 7.10 INDUSTRIAL PC
- 7.10.1 URGENT NEED FOR REAL-TIME DATA COLLECTION, ANALYSIS, AND PROCESSING TO FOSTER MARKET GROWTH
- 7.11 HUMAN-MACHINE INTERFACE
- 7.11.1 INTEGRATION OF HMI SYSTEMS WITH CLOUD AND EDGE COMPUTING FOR SCALABLE CONTROL TO CONTRIBUTE TO MARKET GROWTH
8 INDUSTRIAL SERVICES MARKET, BY END-USE INDUSTRY
- 8.1 INTRODUCTION
- 8.2 AUTOMOTIVE
- 8.2.1 GROWING USE OF DIGITAL TWIN AND REAL-TIME MONITORING TECHNOLOGIES DURING AUTOMOBILE PRODUCTION TO ACCELERATE MARKET GROWTH
- 8.3 AEROSPACE
- 8.3.1 INCREASING INVESTMENTS IN AEROSPACE TECHNOLOGIES TO ACCELERATE MARKET GROWTH
- 8.4 CHEMICALS
- 8.4.1 HIGH PRIORITY FOR OPERATIONAL EXCELLENCE AND RISK MANAGEMENT TO ACCELERATE ADOPTION
- 8.5 FOOD & BEVERAGES
- 8.5.1 RISING USE OF ADVANCED PROCESS CONTROL TECHNOLOGIES TO ACHIEVE HIGH-SPEED PRODUCTION TO FOSTER MARKET GROWTH
- 8.6 METALS & MINING
- 8.6.1 ELEVATING USE OF ADVANCED CONTROL SYSTEMS AND REAL-TIME ANALYTICS FOR SAFER AND EFFICIENT OPERATIONS TO FACILITATE MARKET GROWTH
- 8.7 OIL & GAS
- 8.7.1 SURGING DEMAND FOR ASSET MANAGEMENT SOLUTIONS FROM OIL & GAS COMPANIES TO DRIVE MARKET
- 8.8 PHARMACEUTICALS
- 8.8.1 INCREASING SIGNIFICANCE OF PROCESS STANDARDIZATION AND GMP COMPLIANCE TO ACCELERATE MARKET GROWTH
- 8.9 ENERGY & POWER
- 8.9.1 RISING ADOPTION OF SMART GRID TECHNOLOGIES AND CONDITION MONITORING TO SUPPORT MARKET GROWTH
- 8.10 WATER & WASTEWATER
- 8.10.1 INCREASING INVESTMENT IN SUSTAINABLE WATER MANAGEMENT INITIATIVES TO DRIVE MARKET
- 8.11 SEMICONDUCTOR
- 8.11.1 RISING DEMAND FOR HIGH-PERFORMANCE CHIPS AND PRECISION MANUFACTURING TO FUEL MARKET GROWTH
- 8.12 PAPER & PULP
- 8.12.1 STRINGENT WASTE DISPOSAL AND ENVIRONMENTAL COMPLIANCE STANDARDS TO BOOST DEMAND
- 8.13 OTHER END-USE INDUSTRIES
9 INDUSTRIAL SERVICES MARKET, BY REGION
- 9.1 INTRODUCTION
- 9.2 NORTH AMERICA
- 9.2.1 US
- 9.2.1.1 Increasing adoption of automation to enhance manufacturing productivity to fuel market growth
- 9.2.2 CANADA
- 9.2.2.1 Strategic government funding to support industrial modernization and innovation to foster market growth
- 9.2.3 MEXICO
- 9.2.3.1 Evolution of country as manufacturing hub to boost demand
- 9.2.1 US
- 9.3 EUROPE
- 9.3.1 UK
- 9.3.1.1 Growing adoption of Industry 4.0 and zero-emission initiatives across industries to promote market growth
- 9.3.2 GERMANY
- 9.3.2.1 Rising focus of automobile manufacturers on precision engineering to boost demand
- 9.3.3 FRANCE
- 9.3.3.1 Increasing investment in improving aerospace infrastructure to support market growth
- 9.3.4 ITALY
- 9.3.4.1 Strategic investments in energy infrastructure and advanced manufacturing to propel market
- 9.3.5 REST OF EUROPE
- 9.3.1 UK
- 9.4 ASIA PACIFIC
- 9.4.1 CHINA
- 9.4.1.1 Rising investments in robotics and AI technologies to drive market
- 9.4.2 JAPAN
- 9.4.2.1 Expansion of semiconductor and electronics manufacturing to contribute to market growth
- 9.4.3 INDIA
- 9.4.3.1 Rising demand for cybersecurity and infrastructure support services to fuel market growth
- 9.4.4 SOUTH KOREA
- 9.4.4.1 Increasing investment in AI-related services to fuel market growth
- 9.4.5 REST OF ASIA PACIFIC
- 9.4.1 CHINA
- 9.5 ROW
- 9.5.1 SOUTH AMERICA
- 9.5.1.1 Infrastructure development and automation initiatives to facilitate market growth
- 9.5.2 MIDDLE EAST
- 9.5.2.1 Saudi Arabia
- 9.5.2.1.1 Rising demand for green hydrogen and clean energy technologies to create growth opportunities
- 9.5.2.2 UAE
- 9.5.2.2.1 Thriving petrochemicals and logistics sectors to accelerate market growth
- 9.5.2.3 Qatar
- 9.5.2.3.1 Expansion of LNG projects to promote market growth
- 9.5.2.4 Kuwait
- 9.5.2.4.1 Oil refinery modernization initiatives to support market growth
- 9.5.2.5 Oman
- 9.5.2.5.1 Emphasis on renewable energy projects to favor market growth
- 9.5.2.6 Bahrain
- 9.5.2.6.1 Government incentives for industrial service providers to fuel market growth
- 9.5.2.7 Rest of Middle East
- 9.5.2.1 Saudi Arabia
- 9.5.3 AFRICA
- 9.5.3.1 South Africa
- 9.5.3.1.1 Mining sector expansion to drive market
- 9.5.3.2 Other African countries
- 9.5.3.1 South Africa
- 9.5.1 SOUTH AMERICA
10 COMPETITIVE LANDSCAPE
- 10.1 INTRODUCTION
- 10.2 KEY PLAYER STRATEGIES/RIGHT TO WIN, 2022-2025
- 10.3 REVENUE ANALYSIS, 2020-2024
- 10.4 MARKET SHARE ANALYSIS, 2024
- 10.5 COMPANY VALUATION AND FINANCIAL METRICS
- 10.6 COMPANY EVALUATION MATRIX: KEY COMPANIES, 2024
- 10.6.1 STARS
- 10.6.2 EMERGING LEADERS
- 10.6.3 PERVASIVE PLAYERS
- 10.6.4 PARTICIPANTS
- 10.6.5 COMPANY FOOTPRINT: KEY PLAYERS, 2024
- 10.6.5.1 Company footprint
- 10.6.5.2 Region footprint
- 10.6.5.3 Service type footprint
- 10.6.5.4 Application footprint
- 10.6.5.5 End-use industry footprint
- 10.7 COMPANY EVALUATION MATRIX: STARTUPS/SMES, 2024
- 10.7.1 PROGRESSIVE COMPANIES
- 10.7.2 RESPONSIVE COMPANIES
- 10.7.3 DYNAMIC COMPANIES
- 10.7.4 STARTING BLOCKS
- 10.7.5 COMPETITIVE BENCHMARKING: KEY STARTUPS/SMES, 2024
- 10.7.5.1 Detailed list of startups/SMEs
- 10.7.5.2 Competitive benchmarking of key startups/SMEs
- 10.8 COMPETITIVE SCENARIO
- 10.8.1 SOLUTION/SERVICE LAUNCHES
- 10.8.2 DEALS
- 10.8.3 EXPANSIONS
- 10.8.4 OTHER DEVELOPMENTS
11 COMPANY PROFILES
- 11.1 KEY PLAYERS
- 11.1.1 ABB
- 11.1.1.1 Business overview
- 11.1.1.2 Services offered
- 11.1.1.3 Recent developments
- 11.1.1.3.1 Solution/Service launches
- 11.1.1.3.2 Deals
- 11.1.1.4 MnM view
- 11.1.1.4.1 Key strengths/Right to win
- 11.1.1.4.2 Strategic choices
- 11.1.1.4.3 Weaknesses/Competitive threats
- 11.1.2 SCHNEIDER ELECTRIC
- 11.1.2.1 Business overview
- 11.1.2.2 Services offered
- 11.1.2.3 Recent developments
- 11.1.2.3.1 Solution/Service launches
- 11.1.2.3.2 Deals
- 11.1.2.4 MnM view
- 11.1.2.4.1 Key strengths/Right to win
- 11.1.2.4.2 Strategic choices
- 11.1.2.4.3 Weaknesses/Competitive threats
- 11.1.3 SIEMENS
- 11.1.3.1 Business overview
- 11.1.3.2 Services offered
- 11.1.3.3 Recent developments
- 11.1.3.3.1 Solution/Service launches
- 11.1.3.3.2 Deals
- 11.1.3.3.3 Expansions
- 11.1.3.3.4 Other developments
- 11.1.3.4 MnM view
- 11.1.3.4.1 Key strengths/Right to win
- 11.1.3.4.2 Strategic choices
- 11.1.3.4.3 Weaknesses/Competitive threats
- 11.1.4 ROCKWELL AUTOMATION
- 11.1.4.1 Business overview
- 11.1.4.2 Services offered
- 11.1.4.3 Recent developments
- 11.1.4.3.1 Solution/Service launches
- 11.1.4.3.2 Deals
- 11.1.4.4 MnM view
- 11.1.4.4.1 Key strengths/Right to win
- 11.1.4.4.2 Strategic choices
- 11.1.4.4.3 Weaknesses/Competitive threats
- 11.1.5 HONEYWELL INTERNATIONAL INC.
- 11.1.5.1 Business overview
- 11.1.5.2 Services offered
- 11.1.5.3 Recent developments
- 11.1.5.3.1 Deals
- 11.1.5.4 MnM view
- 11.1.5.4.1 Key strengths/Right to win
- 11.1.5.4.2 Strategic choices
- 11.1.5.4.3 Weaknesses/Competitive threats
- 11.1.6 GE VERNOVA
- 11.1.6.1 Business overview
- 11.1.6.2 Services offered
- 11.1.6.3 Recent developments
- 11.1.6.3.1 Deals
- 11.1.6.3.2 Expansions
- 11.1.6.3.3 Other developments
- 11.1.7 EMERSON ELECTRIC CO.
- 11.1.7.1 Business overview
- 11.1.7.2 Services offered
- 11.1.7.3 Recent developments
- 11.1.7.3.1 Deals
- 11.1.8 YOKOGAWA ELECTRIC CORPORATION
- 11.1.8.1 Business overview
- 11.1.8.2 Services offered
- 11.1.8.3 Recent developments
- 11.1.8.3.1 Solution/Service launches
- 11.1.8.3.2 Deals
- 11.1.9 EATON
- 11.1.9.1 Business overview
- 11.1.9.2 Services offered
- 11.1.9.3 Recent developments
- 11.1.9.3.1 Deals
- 11.1.9.3.2 Other developments
- 11.1.10 MITSUBISHI ELECTRIC CORPORATION
- 11.1.10.1 Business overview
- 11.1.10.2 Services offered
- 11.1.1 ABB
- 11.2 OTHER COMPANIES
- 11.2.1 ATS CORPORATION
- 11.2.2 METSO
- 11.2.3 YASKAWA ELECTRIC CORPORATION
- 11.2.4 SKF
- 11.2.5 ATLAS COPCO AB
- 11.2.6 PARKER HANNIFIN CORP
- 11.2.7 DANAHER CORPORATION
- 11.2.8 CUMMINS INC.
- 11.2.9 WARTSILA
- 11.2.10 ALSTOM SA
- 11.2.11 INGERSOLL RAND
- 11.2.12 INTECH
- 11.2.13 PRIME CONTROLS, LP
- 11.2.14 WUNDERLICH-MALEC ENGINEERING, INC.
- 11.2.15 SAMSON AG
12 APPENDIX
- 12.1 DISCUSSION GUIDE
- 12.2 KNOWLEDGESTORE: MARKETSANDMARKETS' SUBSCRIPTION PORTAL
- 12.3 CUSTOMIZATION OPTIONS
- 12.4 RELATED REPORTS
- 12.5 AUTHOR DETAILS
List of Tables
- TABLE 1 RISK FACTOR ANALYSIS
- TABLE 2 ROLE OF COMPANIES IN ECOSYSTEM
- TABLE 3 LIST OF KEY PATENTS IN INDUSTRIAL SERVICES MARKET, 2020-2024
- TABLE 4 IMPORT DATA FOR HS CODE 847950-COMPLIANT SERVICES, BY COUNTRY, 2020-2024 (USD MILLION)
- TABLE 5 EXPORT DATA FOR HS CODE 847950-COMPLIANT SERVICES, BY COUNTRY, 2020-2024 (USD MILLION)
- TABLE 6 MFN TARIFFS FOR HS CODE 847950-COMPLIANT SERVICES EXPORTED BY US TO OTHER COUNTRIES, 2024
- TABLE 7 IMPACT OF PORTER'S FIVE FORCES ON INDUSTRIAL SERVICES MARKET
- TABLE 8 INFLUENCE OF STAKEHOLDERS ON BUYING PROCESS FOR TOP 3 END-USE INDUSTRIES (%)
- TABLE 9 KEY BUYING CRITERIA FOR TOP 3 END-USE INDUSTRIES
- TABLE 10 NORTH AMERICA: LIST OF REGULATORY BODIES, GOVERNMENT AGENCIES, AND OTHER ORGANIZATIONS
- TABLE 11 EUROPE: LIST OF REGULATORY BODIES, GOVERNMENT AGENCIES, AND OTHER ORGANIZATIONS
- TABLE 12 ASIA PACIFIC: LIST OF REGULATORY BODIES, GOVERNMENT AGENCIES, AND OTHER ORGANIZATIONS
- TABLE 13 ROW: LIST OF REGULATORY BODIES, GOVERNMENT AGENCIES, AND OTHER ORGANIZATIONS
- TABLE 14 INDUSTRIAL SERVICES MARKET: LIST OF KEY CONFERENCES AND EVENTS
- TABLE 15 US-ADJUSTED RECIPROCAL TARIFF RATES, 2025 (USD BILLION)
- TABLE 16 ANTICIPATED CHANGE IN PRICES AND IMPACT ON END-USE INDUSTRIES DUE TO TARIFFS
- TABLE 17 INDUSTRIAL SERVICES MARKET, BY SERVICE TYPE, 2021-2024 (USD MILLION)
- TABLE 18 INDUSTRIAL SERVICES MARKET, BY SERVICE TYPE, 2025-2030 (USD MILLION)
- TABLE 19 ENGINEERING & CONSULTING: INDUSTRIAL SERVICES MARKET, BY APPLICATION, 2021-2024 (USD MILLION)
- TABLE 20 ENGINEERING & CONSULTING: INDUSTRIAL SERVICES MARKET, BY APPLICATION, 2025-2030 (USD MILLION)
- TABLE 21 INSTALLATION & COMMISSIONING: INDUSTRIAL SERVICES MARKET, BY APPLICATION, 2021-2024 (USD MILLION)
- TABLE 22 INSTALLATION & COMMISSIONING: INDUSTRIAL SERVICES MARKET, BY APPLICATION, 2025-2030 (USD MILLION)
- TABLE 23 OPERATIONAL IMPROVEMENT & MAINTENANCE: INDUSTRIAL SERVICES MARKET, BY APPLICATION, 2021-2024 (USD MILLION)
- TABLE 24 OPERATIONAL IMPROVEMENT & MAINTENANCE: INDUSTRIAL SERVICES MARKET, BY APPLICATION, 2025-2030 (USD MILLION)
- TABLE 25 INDUSTRIAL SERVICES MARKET, BY APPLICATION, 2021-2024 (USD MILLION)
- TABLE 26 INDUSTRIAL SERVICES MARKET, BY APPLICATION, 2025-2030 (USD MILLION)
- TABLE 27 MES: INDUSTRIAL SERVICES MARKET, BY SERVICE TYPE, 2021-2024 (USD MILLION)
- TABLE 28 MES: INDUSTRIAL SERVICES MARKET, BY SERVICE TYPE, 2025-2030 (USD MILLION)
- TABLE 29 MES: INDUSTRIAL SERVICES MARKET, BY END-USE INDUSTRY, 2021-2024 (USD MILLION)
- TABLE 30 MES: INDUSTRIAL SERVICES MARKET, BY END-USE INDUSTRY, 2025-2030 (USD MILLION)
- TABLE 31 MES: INDUSTRIAL SERVICES MARKET, BY REGION, 2021-2024 (USD MILLION)
- TABLE 32 MES: INDUSTRIAL SERVICES MARKET, BY REGION, 2025-2030 (USD MILLION)
- TABLE 33 DCS: INDUSTRIAL SERVICES MARKET, BY SERVICE TYPE, 2021-2024 (USD MILLION)
- TABLE 34 DCS: INDUSTRIAL SERVICES MARKET, BY SERVICE TYPE, 2025-2030 (USD MILLION)
- TABLE 35 DCS: INDUSTRIAL SERVICES MARKET, BY END-USE INDUSTRY, 2021-2024 (USD MILLION)
- TABLE 36 DCS: INDUSTRIAL SERVICES MARKET, BY END-USE INDUSTRY, 2025-2030 (USD MILLION)
- TABLE 37 DCS: INDUSTRIAL SERVICES MARKET, BY REGION, 2021-2024 (USD MILLION)
- TABLE 38 DCS: INDUSTRIAL SERVICES MARKET, BY REGION, 2025-2030 (USD MILLION)
- TABLE 39 PLC: INDUSTRIAL SERVICES MARKET, BY SERVICE TYPE, 2021-2024 (USD MILLION)
- TABLE 40 PLC: INDUSTRIAL SERVICES MARKET, BY SERVICE TYPE, 2025-2030 (USD MILLION)
- TABLE 41 PLC: INDUSTRIAL SERVICES MARKET, BY END-USE INDUSTRY, 2021-2024 (USD MILLION)
- TABLE 42 PLC: INDUSTRIAL SERVICES MARKET, BY END-USE INDUSTRY, 2025-2030 (USD MILLION)
- TABLE 43 PLC: INDUSTRIAL SERVICES MARKET, BY REGION, 2021-2024 (USD MILLION)
- TABLE 44 PLC: INDUSTRIAL SERVICES MARKET, BY REGION, 2025-2030 (USD MILLION)
- TABLE 45 SCADA SYSTEM: INDUSTRIAL SERVICES MARKET, BY SERVICE TYPE, 2021-2024 (USD MILLION)
- TABLE 46 SCADA SYSTEM: INDUSTRIAL SERVICES MARKET, BY SERVICE TYPE, 2025-2030 (USD MILLION)
- TABLE 47 SCADA SYSTEM: INDUSTRIAL SERVICES MARKET, BY END-USE INDUSTRY, 2021-2024 (USD MILLION)
- TABLE 48 SCADA SYSTEM: INDUSTRIAL SERVICES MARKET, BY END-USE INDUSTRY, 2025-2030 (USD MILLION)
- TABLE 49 SCADA SYSTEM: INDUSTRIAL SERVICES MARKET, BY REGION, 2021-2024 (USD MILLION)
- TABLE 50 SCADA SYSTEM: INDUSTRIAL SERVICES MARKET, BY REGION, 2025-2030 (USD MILLION)
- TABLE 51 MOTOR & DRIVE: INDUSTRIAL SERVICES MARKET, BY SERVICE TYPE, 2021-2024 (USD MILLION)
- TABLE 52 MOTOR & DRIVE: INDUSTRIAL SERVICES MARKET, BY SERVICE TYPE, 2025-2030 (USD MILLION)
- TABLE 53 MOTOR & DRIVE: INDUSTRIAL SERVICES MARKET, BY END-USE INDUSTRY, 2021-2024 (USD MILLION)
- TABLE 54 MOTOR & DRIVE: INDUSTRIAL SERVICES MARKET, BY END-USE INDUSTRY, 2025-2030 (USD MILLION)
- TABLE 55 MOTOR & DRIVE: INDUSTRIAL SERVICES MARKET, BY REGION, 2021-2024 (USD MILLION)
- TABLE 56 MOTOR & DRIVE: INDUSTRIAL SERVICES MARKET, BY REGION, 2025-2030 (USD MILLION)
- TABLE 57 INDUSTRIAL ROBOT: INDUSTRIAL SERVICES MARKET, BY SERVICE TYPE, 2021-2024 (USD MILLION)
- TABLE 58 INDUSTRIAL ROBOT: INDUSTRIAL SERVICES MARKET, BY SERVICE TYPE, 2025-2030 (USD MILLION)
- TABLE 59 INDUSTRIAL ROBOT: INDUSTRIAL SERVICES MARKET, BY END-USE INDUSTRY, 2021-2024 (USD MILLION)
- TABLE 60 INDUSTRIAL ROBOT: INDUSTRIAL SERVICES MARKET, BY END-USE INDUSTRY, 2025-2030 (USD MILLION)
- TABLE 61 INDUSTRIAL ROBOT: INDUSTRIAL SERVICES MARKET, BY REGION, 2021-2024 (USD MILLION)
- TABLE 62 INDUSTRIAL ROBOT: INDUSTRIAL SERVICES MARKET, BY REGION, 2025-2030 (USD MILLION)
- TABLE 63 INDUSTRIAL 3D PRINTER: INDUSTRIAL SERVICES MARKET, BY SERVICE TYPE, 2021-2024 (USD MILLION)
- TABLE 64 INDUSTRIAL 3D PRINTER: INDUSTRIAL SERVICES MARKET, BY SERVICE TYPE, 2025-2030 (USD MILLION)
- TABLE 65 INDUSTRIAL 3D PRINTER: INDUSTRIAL SERVICES MARKET, BY END-USE INDUSTRY, 2021-2024 (USD MILLION)
- TABLE 66 INDUSTRIAL 3D PRINTER: INDUSTRIAL SERVICES MARKET, BY END-USE INDUSTRY, 2025-2030 (USD MILLION)
- TABLE 67 INDUSTRIAL 3D PRINTER: INDUSTRIAL SERVICES MARKET, BY REGION, 2021-2024 (USD MILLION)
- TABLE 68 INDUSTRIAL 3D PRINTER: INDUSTRIAL SERVICES MARKET, BY REGION, 2025-2030 (USD MILLION)
- TABLE 69 FUNCTIONAL SAFETY SYSTEM: INDUSTRIAL SERVICES MARKET, BY SERVICE TYPE, 2021-2024 (USD MILLION)
- TABLE 70 FUNCTIONAL SAFETY SYSTEM: INDUSTRIAL SERVICES MARKET, BY SERVICE TYPE, 2025-2030 (USD MILLION)
- TABLE 71 FUNCTIONAL SAFETY SYSTEM: INDUSTRIAL SERVICES MARKET, BY END-USE INDUSTRY, 2021-2024 (USD MILLION)
- TABLE 72 FUNCTIONAL SAFETY SYSTEM: INDUSTRIAL SERVICES MARKET, BY END-USE INDUSTRY, 2025-2030 (USD MILLION)
- TABLE 73 FUNCTIONAL SAFETY SYSTEM: INDUSTRIAL SERVICES MARKET, BY REGION, 2021-2024 (USD MILLION)
- TABLE 74 FUNCTIONAL SAFETY SYSTEM: INDUSTRIAL SERVICES MARKET, BY REGION, 2025-2030 (USD MILLION)
- TABLE 75 INDUSTRIAL PC: INDUSTRIAL SERVICES MARKET, BY SERVICE TYPE, 2021-2024 (USD MILLION)
- TABLE 76 INDUSTRIAL PC: INDUSTRIAL SERVICES MARKET, BY SERVICE TYPE, 2025-2030 (USD MILLION)
- TABLE 77 INDUSTRIAL PC: INDUSTRIAL SERVICES MARKET, BY END-USE INDUSTRY, 2021-2024 (USD MILLION)
- TABLE 78 INDUSTRIAL PC: INDUSTRIAL SERVICES MARKET, BY END-USE INDUSTRY, 2025-2030 (USD MILLION)
- TABLE 79 INDUSTRIAL PC: INDUSTRIAL SERVICES MARKET, BY REGION, 2021-2024 (USD MILLION)
- TABLE 80 INDUSTRIAL PC: INDUSTRIAL SERVICES MARKET, BY REGION, 2025-2030 (USD MILLION)
- TABLE 81 HUMAN-MACHINE INTERFACE: INDUSTRIAL SERVICES MARKET, BY SERVICE TYPE, 2021-2024 (USD MILLION)
- TABLE 82 HUMAN-MACHINE INTERFACE: INDUSTRIAL SERVICES MARKET, BY SERVICE TYPE, 2025-2030 (USD MILLION)
- TABLE 83 HUMAN-MACHINE INTERFACE: INDUSTRIAL SERVICES MARKET, BY END-USE INDUSTRY, 2021-2024 (USD MILLION)
- TABLE 84 HUMAN-MACHINE INTERFACE: INDUSTRIAL SERVICES MARKET, BY END-USE INDUSTRY, 2025-2030 (USD MILLION)
- TABLE 85 HUMAN-MACHINE INTERFACE: INDUSTRIAL SERVICES MARKET, BY REGION, 2021-2024 (USD MILLION)
- TABLE 86 HUMAN-MACHINE INTERFACE: INDUSTRIAL SERVICES MARKET, BY REGION, 2025-2030 (USD MILLION)
- TABLE 87 INDUSTRIAL SERVICES MARKET, BY END-USE INDUSTRY, 2021-2024 (USD MILLION)
- TABLE 88 INDUSTRIAL SERVICES MARKET, BY END-USE INDUSTRY, 2025-2030 (USD MILLION)
- TABLE 89 AUTOMOTIVE: INDUSTRIAL SERVICES MARKET, BY APPLICATION, 2021-2024 (USD MILLION)
- TABLE 90 AUTOMOTIVE: INDUSTRIAL SERVICES MARKET, BY APPLICATION, 2025-2030 (USD MILLION)
- TABLE 91 AEROSPACE: INDUSTRIAL SERVICES MARKET, BY APPLICATION, 2021-2024 (USD MILLION)
- TABLE 92 AEROSPACE: INDUSTRIAL SERVICES MARKET, BY APPLICATION, 2025-2030 (USD MILLION)
- TABLE 93 CHEMICALS: INDUSTRIAL SERVICES MARKET, BY APPLICATION, 2021-2024 (USD MILLION)
- TABLE 94 CHEMICALS: INDUSTRIAL SERVICES MARKET, BY APPLICATION, 2025-2030 (USD MILLION)
- TABLE 95 FOOD & BEVERAGES: INDUSTRIAL SERVICES MARKET, BY APPLICATION, 2021-2024 (USD MILLION)
- TABLE 96 FOOD & BEVERAGES: INDUSTRIAL SERVICES MARKET, BY APPLICATION, 2025-2030 (USD MILLION)
- TABLE 97 METALS & MINING: INDUSTRIAL SERVICES MARKET, BY APPLICATION, 2021-2024 (USD MILLION)
- TABLE 98 METALS & MINING: INDUSTRIAL SERVICES MARKET, BY APPLICATION, 2025-2030 (USD MILLION)
- TABLE 99 OIL & GAS: INDUSTRIAL SERVICES MARKET, BY APPLICATION, 2021-2024 (USD MILLION)
- TABLE 100 OIL & GAS: INDUSTRIAL SERVICES MARKET, BY APPLICATION, 2025-2030 (USD MILLION)
- TABLE 101 PHARMACEUTICALS: INDUSTRIAL SERVICES MARKET, BY APPLICATION, 2021-2024 (USD MILLION)
- TABLE 102 PHARMACEUTICALS: INDUSTRIAL SERVICES MARKET, BY APPLICATION, 2025-2030 (USD MILLION)
- TABLE 103 ENERGY & POWER: INDUSTRIAL SERVICES MARKET, BY APPLICATION, 2021-2024 (USD MILLION)
- TABLE 104 ENERGY & POWER: INDUSTRIAL SERVICES MARKET, BY APPLICATION, 2025-2030 (USD MILLION)
- TABLE 105 WATER & WASTEWATER: INDUSTRIAL SERVICES MARKET, BY APPLICATION, 2021-2024 (USD MILLION)
- TABLE 106 WATER & WASTEWATER: INDUSTRIAL SERVICES MARKET, BY APPLICATION, 2025-2030 (USD MILLION)
- TABLE 107 SEMICONDUCTOR: INDUSTRIAL SERVICES MARKET, BY APPLICATION, 2021-2024 (USD MILLION)
- TABLE 108 SEMICONDUCTOR: INDUSTRIAL SERVICES MARKET, BY APPLICATION, 2025-2030 (USD MILLION)
- TABLE 109 PAPER & PULP: INDUSTRIAL SERVICES MARKET, BY APPLICATION, 2021-2024 (USD MILLION)
- TABLE 110 PAPER & PULP: INDUSTRIAL SERVICES MARKET, BY APPLICATION, 2025-2030 (USD MILLION)
- TABLE 111 OTHER END-USE INDUSTRIES: INDUSTRIAL SERVICES MARKET, BY APPLICATION, 2021-2024 (USD MILLION)
- TABLE 112 OTHER END-USE INDUSTRIES: INDUSTRIAL SERVICES MARKET, BY APPLICATION, 2025-2030 (USD MILLION)
- TABLE 113 INDUSTRIAL SERVICES MARKET, BY REGION, 2021-2024 (USD MILLION)
- TABLE 114 INDUSTRIAL SERVICES MARKET, BY REGION, 2025-2030 (USD MILLION)
- TABLE 115 NORTH AMERICA: INDUSTRIAL SERVICES MARKET, BY COUNTRY, 2021-2024 (USD MILLION)
- TABLE 116 NORTH AMERICA: INDUSTRIAL SERVICES MARKET, BY COUNTRY, 2025-2030 (USD MILLION)
- TABLE 117 NORTH AMERICA: INDUSTRIAL SERVICES MARKET, BY APPLICATION, 2021-2024 (USD MILLION)
- TABLE 118 NORTH AMERICA: INDUSTRIAL SERVICES MARKET, BY APPLICATION, 2025-2030 (USD MILLION)
- TABLE 119 EUROPE: INDUSTRIAL SERVICES MARKET, BY COUNTRY, 2021-2024 (USD MILLION)
- TABLE 120 EUROPE: INDUSTRIAL SERVICES MARKET, BY COUNTRY, 2025-2030 (USD MILLION)
- TABLE 121 EUROPE: INDUSTRIAL SERVICES MARKET, BY APPLICATION, 2021-2024 (USD MILLION)
- TABLE 122 EUROPE: INDUSTRIAL SERVICES MARKET, BY APPLICATION, 2025-2030 (USD MILLION)
- TABLE 123 ASIA PACIFIC: INDUSTRIAL SERVICES MARKET, BY COUNTRY, 2021-2024 (USD MILLION)
- TABLE 124 ASIA PACIFIC: INDUSTRIAL SERVICES MARKET, BY COUNTRY, 2025-2030 (USD MILLION)
- TABLE 125 ASIA PACIFIC: INDUSTRIAL SERVICES MARKET, BY APPLICATION, 2021-2024 (USD MILLION)
- TABLE 126 ASIA PACIFIC: INDUSTRIAL SERVICES MARKET, BY APPLICATION, 2025-2030 (USD MILLION)
- TABLE 127 ROW: INDUSTRIAL SERVICES MARKET, BY REGION, 2021-2024 (USD MILLION)
- TABLE 128 ROW: INDUSTRIAL SERVICES MARKET, BY REGION, 2025-2030 (USD MILLION)
- TABLE 129 ROW: INDUSTRIAL SERVICES MARKET, BY APPLICATION, 2021-2024 (USD MILLION)
- TABLE 130 ROW: INDUSTRIAL SERVICES MARKET, BY APPLICATION, 2025-2030 (USD MILLION)
- TABLE 131 MIDDLE EAST: INDUSTRIAL SERVICES MARKET, BY COUNTRY, 2021-2024 (USD MILLION)
- TABLE 132 MIDDLE EAST: INDUSTRIAL SERVICES MARKET, BY COUNTRY, 2025-2030 (USD MILLION)
- TABLE 133 GCC: INDUSTRIAL SERVICES MARKET, BY COUNTRY, 2021-2024 (USD MILLION)
- TABLE 134 GCC: INDUSTRIAL SERVICES MARKET, BY COUNTRY, 2025-2030 (USD MILLION)
- TABLE 135 AFRICA: INDUSTRIAL SERVICES MARKET, BY COUNTRY, 2021-2024 (USD MILLION)
- TABLE 136 AFRICA: INDUSTRIAL SERVICES MARKET, BY COUNTRY, 2025-2030 (USD MILLION)
- TABLE 137 OVERVIEW OF STRATEGIES ADOPTED BY COMPANIES IN INDUSTRIAL SERVICES MARKET
- TABLE 138 INDUSTRIAL SERVICES MARKET: DEGREE OF COMPETITION, 2024
- TABLE 139 INDUSTRIAL SERVICES MARKET: REGION FOOTPRINT
- TABLE 140 INDUSTRIAL SERVICE MARKET: SERVICE TYPE FOOTPRINT
- TABLE 141 INDUSTRIAL SERVICE MARKET: APPLICATION FOOTPRINT
- TABLE 142 INDUSTRIAL SERVICE MARKET: END-USE INDUSTRY FOOTPRINT
- TABLE 143 INDUSTRIAL SERVICES MARKET: LIST OF STARTUPS/SMES
- TABLE 144 INDUSTRIAL SERVICES MARKET: COMPETITIVE BENCHMARKING OF KEY STARTUPS/SMES
- TABLE 145 INDUSTRIAL SERVICES MARKET: SOLUTION/SERVICE LAUNCHES, JANUARY 2022-JULY 2025
- TABLE 146 INDUSTRIAL SERVICES MARKETS MARKET: DEALS, JANUARY 2022-JULY 2025
- TABLE 147 INDUSTRIAL SERVICES MARKETS MARKET: EXPANSIONS, JANUARY 2022-JULY 2025
- TABLE 148 INDUSTRIAL SERVICES MARKETS MARKET: OTHER DEVELOPMENTS, JANUARY 2022- JULY 2025
- TABLE 149 ABB: COMPANY OVERVIEW
- TABLE 150 ABB: SERVICES OFFERED
- TABLE 151 ABB: SOLUTION/SERVICE LAUNCHES
- TABLE 152 ABB: DEALS
- TABLE 153 SCHNEIDER ELECTRIC: COMPANY OVERVIEW
- TABLE 154 SCHNEIDER ELECTRIC: SERVICES OFFERED
- TABLE 155 SCHNEIDER ELECTRIC: SOLUTION/SERVICE LAUNCHES
- TABLE 156 SCHNEIDER ELECTRIC: DEALS
- TABLE 157 SIEMENS: COMPANY OVERVIEW
- TABLE 158 SIEMENS: SERVICES OFFERED
- TABLE 159 SIEMENS: SOLUTION/SERVICE LAUNCHES
- TABLE 160 SIEMENS: DEALS
- TABLE 161 SIEMENS: EXPANSIONS
- TABLE 162 SIEMENS: OTHER DEVELOPMENTS
- TABLE 163 ROCKWELL AUTOMATION: COMPANY OVERVIEW
- TABLE 164 ROCKWELL AUTOMATION: SERVICES OFFERED
- TABLE 165 ROCKWELL AUTOMATION: SOLUTION/SERVICE LAUNCHES
- TABLE 166 ROCKWELL AUTOMATION: DEALS
- TABLE 167 HONEYWELL INTERNATIONAL INC.: COMPANY OVERVIEW
- TABLE 168 HONEYWELL INTERNATIONAL INC.: SERVICES OFFERED
- TABLE 169 HONEYWELL INTERNATIONAL INC.: DEALS
- TABLE 170 GE VERNOVA: COMPANY OVERVIEW
- TABLE 171 GE VERNOVA: SERVICES OFFERED
- TABLE 172 GE VERNOVA: DEALS
- TABLE 173 GE VERNOVA: EXPANSIONS
- TABLE 174 GE VERNOVA: OTHER DEVELOPMENTS
- TABLE 175 EMERSON ELECTRIC CO.: COMPANY OVERVIEW
- TABLE 176 EMERSON ELECTRIC CO.: SERVICES OFFERED
- TABLE 177 EMERSON ELECTRIC CO.: DEALS
- TABLE 178 YOKOGAWA ELECTRIC CORPORATION: COMPANY OVERVIEW
- TABLE 179 YOKOGAWA ELECTRIC CORPORATION: SERVICES OFFERED
- TABLE 180 YOKOGAWA ELECTRIC CORPORATION: SOLUTION/SERVICE LAUNCHES
- TABLE 181 YOKOGAWA ELECTRIC CORPORATION: DEALS
- TABLE 182 EATON: COMPANY OVERVIEW
- TABLE 183 EATON: SERVICES OFFERED
- TABLE 184 EATON: DEALS
- TABLE 185 EATON: OTHER DEVELOPMENTS
- TABLE 186 MITSUBISHI ELECTRIC CORPORATION: COMPANY OVERVIEW
- TABLE 187 MITSUBISHI ELECTRIC CORPORATION: SERVICES OFFERED
- TABLE 188 ATS CORPORATION: COMPANY OVERVIEW
- TABLE 189 METSO: COMPANY OVERVIEW
- TABLE 190 YASKAWA ELECTRIC CORPORATION: COMPANY OVERVIEW
- TABLE 191 SKF: COMPANY OVERVIEW
- TABLE 192 ATLAS COPCO AB: COMPANY OVERVIEW
- TABLE 193 PARKER HANNIFIN CORP: COMPANY OVERVIEW
- TABLE 194 DANAHER CORPORATION: COMPANY OVERVIEW
- TABLE 195 CUMMINS INC.: COMPANY OVERVIEW
- TABLE 196 WARTSILA: COMPANY OVERVIEW
- TABLE 197 ALSTOM SA: COMPANY OVERVIEW
- TABLE 198 INGERSOLL RAND: COMPANY OVERVIEW
- TABLE 199 INTECH: COMPANY OVERVIEW
- TABLE 200 PRIME CONTROLS, LP: COMPANY OVERVIEW
- TABLE 201 WUNDERLICH-MALEC ENGINEERING, INC.: COMPANY OVERVIEW
- TABLE 202 SAMSON AG: COMPANY OVERVIEW
List of Figures
- FIGURE 1 INDUSTRIAL SERVICES MARKET: RESEARCH DESIGN
- FIGURE 2 MARKET SIZE ESTIMATION METHODOLOGY: SUPPLY-SIDE ANALYSIS
- FIGURE 3 MARKET SIZE ESTIMATION METHODOLOGY: APPROACH 2 (SUPPLY-SIDE)-IDENTIFICATION OF REVENUE GENERATED BY COMPANIES FROM SALES OF INDUSTRIAL SERVICES
- FIGURE 4 MARKET SIZE ESTIMATION METHODOLOGY: BOTTOM-UP APPROACH
- FIGURE 5 MARKET SIZE ESTIMATION METHODOLOGY: TOP-DOWN APPROACH
- FIGURE 6 DATA TRIANGULATION METHODOLOGY
- FIGURE 7 OPERATIONAL IMPROVEMENT & MAINTENANCE SEGMENT TO LEAD INDUSTRIAL SERVICES MARKET THROUGHOUT FORECAST PERIOD
- FIGURE 8 MES TO CAPTURE MAJORITY OF INDUSTRIAL SERVICES MARKET SHARE IN 2030
- FIGURE 9 AUTOMOTIVE INDUSTRY TO HOLD PROMINENT MARKET SHARE IN 2030
- FIGURE 10 ASIA PACIFIC ACCOUNTED FOR LARGEST SHARE OF INDUSTRIAL SERVICES MARKET IN 2024
- FIGURE 11 RISING ADOPTION OF AI- AND IOT-ENABLED INDUSTRIAL SYSTEMS TO OPEN NEW REVENUE STREAMS FOR MARKET PLAYERS
- FIGURE 12 US AND MES TO CAPTURE LARGEST SHARE OF NORTH AMERICAN INDUSTRIAL SERVICES MARKET IN 2025
- FIGURE 13 INDUSTRIAL ROBOT SEGMENT TO ACCOUNT FOR LARGEST SHARE OF INDUSTRIAL SERVICES MARKET IN ASIA PACIFIC THROUGHOUT FORECAST PERIOD
- FIGURE 14 INDUSTRIAL SERVICES MARKET IN INDIA TO GROW AT HIGHEST CAGR FROM 2025 TO 2030
- FIGURE 15 INDUSTRIAL SERVICES MARKET: DRIVERS, RESTRAINTS, OPPORTUNITIES, AND CHALLENGES
- FIGURE 16 IMPACT ANALYSIS OF DRIVERS ON INDUSTRIAL SERVICES MARKET
- FIGURE 17 IMPACT ANALYSIS OF RESTRAINTS ON INDUSTRIAL SERVICES MARKET
- FIGURE 18 IMPACT ANALYSIS OF OPPORTUNITIES ON INDUSTRIAL SERVICES MARKET
- FIGURE 19 IMPACT ANALYSIS OF CHALLENGES ON INDUSTRIAL SERVICES MARKET
- FIGURE 20 TRENDS/DISRUPTIONS INFLUENCING CUSTOMER BUSINESS
- FIGURE 21 VALUE CHAIN ANALYSIS: INDUSTRIAL SERVICES MARKET
- FIGURE 22 ROLE OF KEY PLAYERS IN ECOSYSTEM
- FIGURE 23 NUMBER OF PATENTS APPLIED AND GRANTED IN INDUSTRIAL SERVICES MARKET, 2014-2024
- FIGURE 24 IMPORT SCENARIO FOR HS CODE 847950-COMPLIANT SERVICES IN TOP 5 COUNTRIES, 2020-2024
- FIGURE 25 EXPORT SCENARIO FOR HS CODE 847950-COMPLIANT SERVICES IN TOP 5 COUNTRIES, 2020-2024
- FIGURE 26 PORTER'S FIVE FORCES ANALYSIS: INDUSTRIAL SERVICES MARKET
- FIGURE 27 INFLUENCE OF STAKEHOLDERS ON BUYING PROCESS FOR TOP 3 END-USE INDUSTRIES
- FIGURE 28 KEY BUYING CRITERIA FOR TOP 3 END-USE INDUSTRIES
- FIGURE 29 AI USE CASES
- FIGURE 30 OPERATIONAL IMPROVEMENT & MAINTENANCE SERVICES TO DOMINATE INDUSTRIAL SERVICES MARKET THROUGHOUT FORECAST PERIOD
- FIGURE 31 INDUSTRIAL 3D PRINTER SEGMENT TO EXHIBIT HIGHEST CAGR DURING FORECAST PERIOD
- FIGURE 32 PHARMACEUTICALS TO BE FASTEST-GROWING END-USE INDUSTRY IN INDUSTRIAL SERVICES MARKET FROM 2025 TO 2030
- FIGURE 33 INDUSTRIAL SERVICES MARKET IN ASIA PACIFIC TO GROW AT HIGHEST CAGR FROM 2025 TO 2030
- FIGURE 34 NORTH AMERICA: INDUSTRIAL SERVICES MARKET SNAPSHOT
- FIGURE 35 EUROPE: INDUSTRIAL SERVICES MARKET SNAPSHOT
- FIGURE 36 ASIA PACIFIC: INDUSTRIAL SERVICES MARKET SNAPSHOT
- FIGURE 37 REVENUE ANALYSIS OF KEY PLAYERS IN INDUSTRIAL SERVICES MARKET, 2020-2024
- FIGURE 38 MARKET SHARE ANALYSIS OF MAJOR PLAYERS, 2024
- FIGURE 39 COMPANY VALUATION, 2024
- FIGURE 40 FINANCIAL METRICS (EV/EBITDA), 2024
- FIGURE 41 INDUSTRIAL SERVICES MARKET: COMPANY EVALUATION MATRIX (KEY PLAYERS), 2024
- FIGURE 42 INDUSTRIAL SERVICES MARKET: COMPANY FOOTPRINT
- FIGURE 43 INDUSTRIAL SERVICES MARKET: COMPANY EVALUATION MATRIX (STARTUPS/SMES), 2024
- FIGURE 44 ABB: COMPANY SNAPSHOT
- FIGURE 45 SCHNEIDER ELECTRIC: COMPANY SNAPSHOT
- FIGURE 46 SIEMENS: COMPANY SNAPSHOT
- FIGURE 47 ROCKWELL AUTOMATION: COMPANY SNAPSHOT
- FIGURE 48 HONEYWELL INTERNATIONAL INC.: COMPANY SNAPSHOT
- FIGURE 49 GE VERNOVA: COMPANY SNAPSHOT
- FIGURE 50 EMERSON ELECTRIC CO.: COMPANY SNAPSHOT
- FIGURE 51 YOKOGAWA ELECTRIC CORPORATION: COMPANY SNAPSHOT
- FIGURE 52 EATON: COMPANY SNAPSHOT
- FIGURE 53 MITSUBISHI ELECTRIC CORPORATION: COMPANY SNAPSHOT

