
PUBLISHER: MarketsandMarkets | PRODUCT CODE: 1808081
PUBLISHER: MarketsandMarkets | PRODUCT CODE: 1808081
GFRP Rebar Market by Resin Type, Diameter, Tensile Strength (Low strength, High Strength ), Application & Region - Global Forecast to 2030
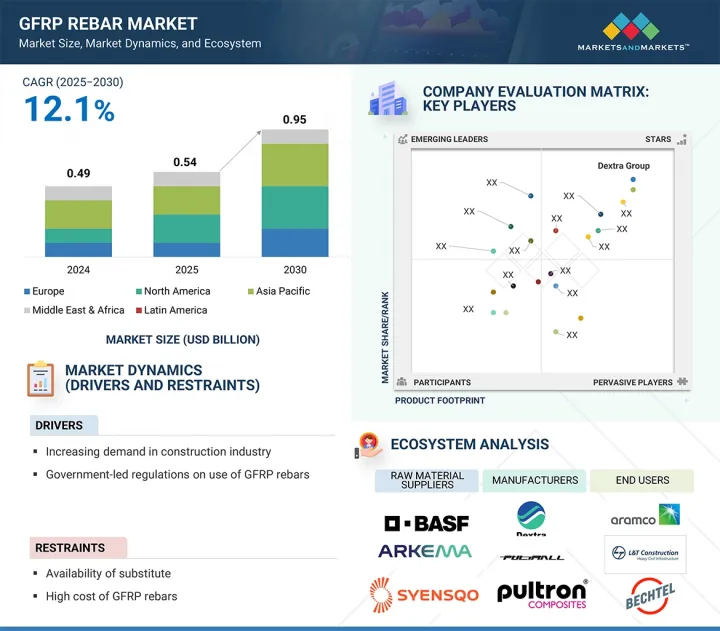
The GFRP rebar market is estimated at USD 0.54 billion in 2025 and is projected to reach USD 0.95 billion by 2030, at a CAGR of 12.1%. Vinyl ester resin accounted for the largest share in the GFRP rebar market due to its superior corrosion resistance, especially in harsh chemical and marine environments. Its excellent mechanical properties, such as high tensile strength and flexibility, make it ideal for infrastructure applications such as bridges, tunnels, and marine structures.
| Scope of the Report | |
|---|---|
| Years Considered for the Study | 2023-2030 |
| Base Year | 2024 |
| Forecast Period | 2025-2030 |
| Units Considered | Value (USD Thousand) and Volume (Ton) |
| Segments | Resin Type, Tensile Strength, Diameter, Application, and Region |
| Regions covered | Europe, North America, Asia Pacific, Middle East & Africa, and South America |
Additionally, vinyl ester resin offers better adhesion to glass fibers compared to other resins, enhancing the overall durability and performance of GFRP rebars. Its balance of cost-effectiveness and performance has made it the preferred choice in demanding construction projects.
"High-tensile strength segment is projected to register second-highest growth rate during forecast period."
High tensile strength (>1000 MPa) GFRP rebars are expected to register the second-highest growth rate in the market due to their superior mechanical performance, making them ideal for heavy-load and high-stress applications such as bridges, marine structures, and industrial facilities. These rebars offer excellent resistance to corrosion, which extends the lifespan of infrastructure in aggressive environments. As infrastructure investment increases globally, particularly in coastal and chemically exposed areas, the demand for durable and high-strength materials rises. This trend drives the growth of high tensile strength GFRP rebars as a preferred alternative to traditional steel reinforcements.
"Marine structure & waterfront application accounted for the second-largest share in the overall GFRP rebar market."
Marine structure and waterfront application of GFRP rebar accounted for the second-largest share because of its superior corrosion resistance in hostile, saltwater environments where ordinary steel rebar rapidly corrodes. Piers, seawalls, and docks take advantage of GFRP's longevity, which extends service life enormously and lowers maintenance costs. Although more expensive initially, long-term economic benefits, such as lower lifecycle costs and reduced repairs, make GFRP rebar more appealing by the day. Moreover, increasing environmental controls and a worldwide trend toward sustainable, long-lasting infrastructure further stimulate demand in these coastal and marine markets.
"Asia Pacific is projected to register the highest growth rate in the GFRP rebar market during forecast period."
Asia Pacific is anticipated to register the highest CAGR in the GFRP rebar market during the forecast period due to rapid urbanization and infrastructure development, particularly in countries like China, India, and Southeast Asian nations. Increasing investments in smart city projects, bridges, highways, and coastal structures are driving demand for corrosion-resistant and durable construction materials like GFRP rebars. In 2024, DS Jindal Group announced a strategic alliance to transform the Indian GFRP rebar market through collaboration with international partners and plans to establish 12 production units nationwide by 2026. Additionally, government initiatives promoting sustainable and long-lasting infrastructure solutions are boosting adoption. The region's large construction sector and cost-effective labour also support faster market expansion compared to other regions.
This study has been validated through primary interviews with industry experts globally. The primary sources have been divided into the following three categories:
- By Company Type: Tier 1 - 40%, Tier 2 - 33%, and Tier 3 - 27%
- By Designation: C-level - 50%, Director-level - 30%, and Managers - 20%
- By Region: North America - 15%, Europe - 50%, Asia Pacific - 20%, the Middle East & Africa - 10%, and Latin America - 5%
The report provides a comprehensive analysis of the following companies:
Prominent companies in this market include Dextra Group (Thailand), Schock Bauteile GmbH (Germany), Pultron Composites (New Zealand), Sireg S.P.A. (Italy), Pultrall Inc. (Canada), KODIAK Fiberglass Rebar (US), Neuvokas Corporation (US), Rochling (Germany), ARC Insulations & Insulator Ltd. (India), Jindal Advanced Materials (India), SKD Composite (India), Galen LLC (Russia), Fibrolux (Germany), FRT TUF-BAR (Canada), and Armastek (Russia).
Research Coverage
This research report categorizes the GFRP rebar market by resin type (vinyl ester, epoxy, and other resin types), diameter (< 10mm, 10-20 mm, and > 20 mm), tensile strength (low strength (<1000 MPa), and high strength (> 1000 MPa), application (highway, bridges, & buildings, marine structure & waterfront, water treatment plants, and other applications), and region (North America, Europe, Asia Pacific, the Middle East & Africa, and Latin America). The scope of the report includes detailed information about the major factors influencing the growth of the GFRP rebar market, such as drivers, restraints, challenges, and opportunities. A thorough examination of the key industry players has been conducted to provide insights into their business overview, solutions and services, key strategies, and recent developments in the GFRP rebar market are all covered. This report includes a competitive analysis of upcoming startups in the GFRP rebar market ecosystem.
Reasons to buy this report
The report will help market leaders/new entrants in this market with information on the closest approximations of the revenue numbers for the overall GFRP rebar market and the subsegments. This report will help stakeholders understand the competitive landscape and gain more insights to better position their businesses and plan suitable go-to-market strategies. The report also helps stakeholders understand the pulse of the market and provides them with information on key market drivers, restraints, challenges, and opportunities.
The report provides insights on the following pointers:
- Analysis of key drivers (Increasing demand in construction industry, government-led regulations on use of GFRP rebars), restraints (availability of substitutes and high cost of GFRP rebars), opportunities (Rising investments in large-scale civil engineering projects, growing use in construction of highways and bridges, integration of graphene into GFRP rebar for concrete reinforcement), and challenges (Supply chain and manufacturing constraints, inability to completely replace steel rebar) are influencing the growth of the GFRP rebar market.
- Product Development/Innovation: Detailed insights on upcoming technologies, research & development activities, and product launches in the GFRP Rebar market.
- Market Development: Comprehensive information about lucrative markets - the report analyses the GFRP rebar market across varied regions.
- Market Diversification: Exhaustive information about services, untapped geographies, recent developments, and investments in the GFRP rebar market.
- Competitive Assessment: In-depth assessment of market shares, growth strategies, and product offerings of leading players like Dextra Group (Thailand), Schock Bauteile GmbH (Germany), Pultron Composites (New Zealand), Sireg S.P.A. (Italy), Pultrall Inc. (Canada), KODIAK Fiberglass Rebar (US), Neuvokas Corporation (US), Rochling (Germany), ARC Insulations & Insulator Ltd. (India), Jindal Advanced Materials (India), SKD Composite (India), Galen LLC (Russia), Fibrolux (Germany), FRT TUF-BAR (Canada), and Armastek (Russia).
TABLE OF CONTENTS
1 INTRODUCTION
- 1.1 STUDY OBJECTIVES
- 1.2 MARKET DEFINITION
- 1.3 STUDY SCOPE
- 1.3.1 MARKETS COVERED AND REGIONAL SCOPE
- 1.3.2 INCLUSIONS AND EXCLUSIONS
- 1.4 YEARS CONSIDERED
- 1.5 CURRENCY CONSIDERED
- 1.6 UNIT CONSIDERED
- 1.7 LIMITATIONS
- 1.8 STAKEHOLDERS
2 RESEARCH METHODOLOGY
- 2.1 RESEARCH DATA
- 2.1.1 SECONDARY DATA
- 2.1.1.1 Key data from secondary sources
- 2.1.2 PRIMARY DATA
- 2.1.2.1 Key data from primary sources
- 2.1.2.2 Key primary participants
- 2.1.2.3 Breakdown of interviews with experts
- 2.1.2.4 Key industry insights
- 2.1.1 SECONDARY DATA
- 2.2 MARKET SIZE ESTIMATION
- 2.2.1 BOTTOM-UP APPROACH
- 2.2.2 TOP-DOWN APPROACH
- 2.3 BASE NUMBER CALCULATION
- 2.3.1 APPROACH 1: SUPPLY-SIDE ANALYSIS
- 2.3.2 APPROACH 2: DEMAND-SIDE ANALYSIS
- 2.4 GROWTH FORECAST
- 2.4.1 SUPPLY SIDE
- 2.4.2 DEMAND SIDE
- 2.5 DATA TRIANGULATION
- 2.6 FACTOR ANALYSIS
- 2.7 RESEARCH ASSUMPTIONS
- 2.8 RESEARCH LIMITATIONS AND RISK ASSESSMENT
3 EXECUTIVE SUMMARY
4 PREMIUM INSIGHTS
- 4.1 ATTRACTIVE OPPORTUNITIES FOR PLAYERS IN GFRP REBAR MARKET
- 4.2 GFRP REBAR MARKET, BY APPLICATION AND REGION
- 4.3 GFRP REBAR MARKET, BY RESIN TYPE
- 4.4 GFRP REBAR MARKET, BY TENSILE STRENGTH
- 4.5 GFRP REBAR MARKET, BY DIAMETER
- 4.6 GFRP REBAR MARKET, BY APPLICATION
- 4.7 GFRP REBAR MARKET, BY KEY COUNTRY
5 MARKET OVERVIEW
- 5.1 INTRODUCTION
- 5.2 MARKET DYNAMICS
- 5.2.1 DRIVERS
- 5.2.1.1 Increasing demand in construction industry
- 5.2.1.2 Government-led regulations on use of GFRP rebars
- 5.2.2 RESTRAINTS
- 5.2.2.1 Availability of substitutes
- 5.2.2.2 High cost of GFRP rebars
- 5.2.3 OPPORTUNITIES
- 5.2.3.1 Rising investments in large-scale civil engineering projects
- 5.2.3.2 Growing use in construction of highways and bridges
- 5.2.3.3 Integration of graphene into GFRP rebar for concrete reinforcement
- 5.2.4 CHALLENGES
- 5.2.4.1 Supply chain and manufacturing constraints
- 5.2.4.2 Inability to completely replace steel rebar
- 5.2.1 DRIVERS
- 5.3 PORTER'S FIVE FORCES ANALYSIS
- 5.3.1 THREAT OF NEW ENTRANTS
- 5.3.2 THREAT OF SUBSTITUTES
- 5.3.3 BARGAINING POWER OF SUPPLIERS
- 5.3.4 BARGAINING POWER OF BUYERS
- 5.3.5 INTENSITY OF COMPETITIVE RIVALRY
- 5.4 KEY STAKEHOLDERS AND BUYING CRITERIA
- 5.4.1 KEY STAKEHOLDERS IN BUYING PROCESS
- 5.4.2 BUYING CRITERIA
- 5.5 PRICING ANALYSIS
- 5.5.1 AVERAGE SELLING PRICE OF KEY PLAYERS, BY APPLICATION, 2024
- 5.5.2 AVERAGE SELLING PRICE TREND, BY REGION
- 5.6 MACROECONOMIC OUTLOOK
- 5.6.1 INTRODUCTION
- 5.6.2 GDP TRENDS AND FORECAST
- 5.6.3 TRENDS IN GLOBAL CONSTRUCTION INDUSTRY
- 5.7 VALUE CHAIN ANALYSIS
- 5.8 ECOSYSTEM ANALYSIS
- 5.9 TRADE ANALYSIS
- 5.9.1 EXPORT SCENARIO (HS CODE 7019)
- 5.9.2 IMPORT SCENARIO (HS CODE 7019)
- 5.10 TECHNOLOGY ANALYSIS
- 5.10.1 KEY TECHNOLOGIES
- 5.10.1.1 Pultrusion
- 5.10.2 COMPLEMENTARY TECHNOLOGIES
- 5.10.2.1 Filament winding
- 5.10.1 KEY TECHNOLOGIES
- 5.11 PATENT ANALYSIS
- 5.11.1 INTRODUCTION
- 5.11.2 METHODOLOGY
- 5.11.3 DOCUMENT TYPES
- 5.11.4 INSIGHTS
- 5.11.5 LEGAL STATUS
- 5.11.6 JURISDICTION ANALYSIS
- 5.11.7 TOP APPLICANTS
- 5.11.8 GFRP REBAR MARKET: TOP 10 PATENT OWNERS IN LAST 10 YEARS (US)
- 5.12 REGULATORY LANDSCAPE
- 5.12.1 REGULATORY BODIES, GOVERNMENT AGENCIES, AND OTHER ORGANIZATIONS
- 5.13 KEY CONFERENCES AND EVENTS, 2025-2026
- 5.14 CASE STUDY ANALYSIS
- 5.14.1 USE OF GFRP REBAR IN DELHI METRO PHASE 3
- 5.14.2 JIZAN FLOOD MITIGATION CHANNEL - WORLD'S LARGEST GFRP REBAR PROJECT
- 5.14.3 MUSKRAT FALLS HYDROELECTRIC PROJECT, CANADA - GFRP REBAR FOR LONG-TERM DURABILITY
- 5.15 TRENDS/DISRUPTIONS IMPACTING CUSTOMER BUSINESS
- 5.16 IMPACT OF GEN AI/AI ON GFRP REBAR MARKET
- 5.16.1 TOP USE CASES AND MARKET POTENTIAL
- 5.16.2 CASE STUDIES OF AI IMPLEMENTATION IN GFRP REBAR MARKET
- 5.17 INVESTMENT AND FUNDING SCENARIO
- 5.18 US TARIFF IMPACT ON GFRP REBAR MARKET
- 5.18.1 INTRODUCTION
- 5.18.2 KEY TARIFF RATES
- 5.18.3 PRICE IMPACT ANALYSIS
- 5.18.4 KEY IMPACT ON MAJOR REGIONS/COUNTRIES
- 5.18.4.1 US
- 5.18.4.2 Europe
- 5.18.4.3 Asia Pacific
- 5.18.5 IMPACT ON END USERS
6 GFRP REBAR MARKET, BY RESIN TYPE
- 6.1 INTRODUCTION
- 6.2 VINYL ESTER
- 6.2.1 COST-EFFECTIVENESS OF VINYL ESTER TO DRIVE MARKET
- 6.3 EPOXY
- 6.3.1 INNOVATIONS IN EPOXY RESIN APPLICATIONS IN GFRP REBAR TO FUEL DEMAND
- 6.4 OTHER RESIN TYPES
7 GFRP REBAR MARKET, BY TENSILE STRENGTH
- 7.1 INTRODUCTION
- 7.2 LOW STRENGTH (<1,000 MPA)
- 7.2.1 COST-EFFECTIVENESS ASSOCIATED WITH LOW-STRENGTH REBARS TO DRIVE DEMAND
- 7.3 HIGH STRENGTH (>1,000 MPA)
- 7.3.1 INCREASING R&D RELATED TO GFRP REBAR TO FUEL DEMAND
8 GFRP REBAR MARKET, BY DIAMETER
- 8.1 INTRODUCTION
- 8.2 <10 MM
- 8.2.1 EASY AVAILABILITY TO DRIVE MARKET
- 8.3 10-20 MM
- 8.3.1 ABILITY TO ALIGN WITH STANDARD REINFORCED CONCRETE CONSTRUCTION TO FUEL DEMAND
- 8.4 >20 MM
- 8.4.1 INCREASING APPLICATION IN HEAVY-DUTY INFRASTRUCTURE PROJECTS TO FUEL MARKET GROWTH
9 GFRP REBAR MARKET, BY APPLICATION
- 9.1 INTRODUCTION
- 9.2 HIGHWAYS, BRIDGES, AND BUILDINGS
- 9.2.1 RISING APPLICATION IN BRIDGE CONSTRUCTION TO DRIVE MARKET
- 9.3 MARINE STRUCTURES & WATERFRONTS
- 9.3.1 NON-CORROSIVE PROPERTY OF GFRP REBAR TO FUEL DEMAND
- 9.4 WATER TREATMENT PLANTS
- 9.4.1 SUPERIOR CORROSION RESISTANCE TO BOOST DEMAND
- 9.5 OTHER APPLICATIONS
10 GFRP REBAR MARKET, BY REGION
- 10.1 INTRODUCTION
- 10.2 NORTH AMERICA
- 10.2.1 NORTH AMERICA: GFRP REBAR MARKET, BY RESIN TYPE
- 10.2.2 NORTH AMERICA: GFRP REBAR MARKET, BY TENSILE STRENGTH
- 10.2.3 NORTH AMERICA: GFRP REBAR MARKET, BY DIAMETER
- 10.2.4 NORTH AMERICA: GFRP REBAR MARKET, BY APPLICATION
- 10.2.5 NORTH AMERICA: GFRP REBAR MARKET, BY COUNTRY
- 10.2.5.1 US
- 10.2.5.1.1 Presence of major GFRP rebar manufacturers to drive market
- 10.2.5.2 Canada
- 10.2.5.2.1 Harsh environmental conditions to propel market
- 10.2.5.1 US
- 10.3 EUROPE
- 10.3.1 EUROPE: GFRP REBAR MARKET, BY RESIN TYPE
- 10.3.2 EUROPE: GFRP REBAR MARKET, BY TENSILE STRENGTH
- 10.3.3 EUROPE: GFRP REBAR MARKET, BY DIAMETER
- 10.3.4 EUROPE: GFRP REBAR MARKET, BY APPLICATION
- 10.3.5 EUROPE: GFRP REBAR MARKET, BY COUNTRY
- 10.3.5.1 Germany
- 10.3.5.1.1 Rising construction projects to drive market
- 10.3.5.2 France
- 10.3.5.2.1 Technological innovations to fuel demand
- 10.3.5.3 UK
- 10.3.5.3.1 Increasing demand for lightweight and high-performance materials to drive market
- 10.3.5.4 Italy
- 10.3.5.4.1 Growing demand in construction industry to drive market
- 10.3.5.5 Russia
- 10.3.5.5.1 Presence of established manufacturers to drive market
- 10.3.5.6 Rest of Europe
- 10.3.5.1 Germany
- 10.4 ASIA PACIFIC
- 10.4.1 ASIA PACIFIC: GFRP REBAR MARKET, BY RESIN TYPE
- 10.4.2 ASIA PACIFIC: GFRP REBAR MARKET, BY TENSILE STRENGTH
- 10.4.3 ASIA PACIFIC: GFRP REBAR MARKET, BY DIAMETER
- 10.4.4 ASIA PACIFIC: GFRP REBAR MARKET, BY APPLICATION
- 10.4.5 ASIA PACIFIC: GFRP REBAR MARKET, BY COUNTRY
- 10.4.5.1 China
- 10.4.5.1.1 Increasing construction projects to drive market
- 10.4.5.2 South Korea
- 10.4.5.2.1 Ongoing research & development for GFRP rebars to accelerate demand
- 10.4.5.3 India
- 10.4.5.3.1 Increasing government-led investments in transportation sector to drive market
- 10.4.5.4 Japan
- 10.4.5.4.1 Growing demand from civil infrastructure to drive market
- 10.4.5.5 Rest of Asia Pacific
- 10.4.5.1 China
- 10.5 MIDDLE EAST & AFRICA
- 10.5.1 MIDDLE EAST & AFRICA: GFRP REBAR MARKET, BY RESIN TYPE
- 10.5.2 MIDDLE EAST & AFRICA: GFRP REBAR MARKET, BY TENSILE STRENGTH
- 10.5.3 MIDDLE EAST & AFRICA: GFRP REBAR MARKET, BY DIAMETER
- 10.5.4 MIDDLE EAST & AFRICA: GFRP REBAR MARKET, BY APPLICATION
- 10.5.5 MIDDLE EAST & AFRICA: GFRP REBAR MARKET, BY COUNTRY
- 10.5.5.1 GCC countries
- 10.5.5.1.1 UAE
- 10.5.5.1.1.1 Increasing infrastructure development projects to propel market
- 10.5.5.1.2 Saudi Arabia
- 10.5.5.1.2.1 Increasing partnerships with major manufacturers to drive market
- 10.5.5.1.3 Other GCC countries
- 10.5.5.1.1 UAE
- 10.5.5.2 South Africa
- 10.5.5.2.1 Growing adoption in construction industry to drive market
- 10.5.5.3 Rest of Middle East & Africa
- 10.5.5.1 GCC countries
- 10.6 LATIN AMERICA
- 10.6.1 LATIN AMERICA: GFRP REBAR MARKET, BY RESIN TYPE
- 10.6.2 LATIN AMERICA: GFRP REBAR MARKET, BY TENSILE STRENGTH
- 10.6.3 LATIN AMERICA: GFRP REBAR MARKET, BY DIAMETER
- 10.6.4 LATIN AMERICA: GFRP REBAR MARKET, BY APPLICATION
- 10.6.5 LATIN AMERICA: GFRP REBAR MARKET, BY COUNTRY
- 10.6.5.1 Mexico
- 10.6.5.1.1 Growing demand for sustainable infrastructure to drive market
- 10.6.5.2 Brazil
- 10.6.5.2.1 High-value construction projects to drive demand
- 10.6.5.3 Rest of Latin America
- 10.6.5.1 Mexico
11 COMPETITIVE LANDSCAPE
- 11.1 OVERVIEW
- 11.2 KEY PLAYER STRATEGIES/RIGHT TO WIN
- 11.3 REVENUE ANALYSIS, 2024
- 11.4 MARKET SHARE ANALYSIS, 2024
- 11.5 BRAND/PRODUCT COMPARATIVE ANALYSIS
- 11.6 COMPANY EVALUATION MATRIX: KEY PLAYERS, 2024
- 11.6.1 STARS
- 11.6.2 EMERGING LEADERS
- 11.6.3 PERVASIVE PLAYERS
- 11.6.4 PARTICIPANTS
- 11.6.5 COMPANY FOOTPRINT: KEY PLAYERS, 2024
- 11.6.5.1 Company footprint
- 11.6.5.2 Region footprint
- 11.6.5.3 Resin type footprint
- 11.6.5.4 Diameter footprint
- 11.6.5.5 Tensile strength footprint
- 11.6.5.6 Application footprint
- 11.7 COMPANY EVALUATION MATRIX: STARTUPS/SMES, 2024
- 11.7.1 PROGRESSIVE COMPANIES
- 11.7.2 RESPONSIVE COMPANIES
- 11.7.3 DYNAMIC COMPANIES
- 11.7.4 STARTING BLOCKS
- 11.7.5 COMPETITIVE BENCHMARKING: STARTUPS/SMES, 2024
- 11.7.5.1 Detailed list of key startups/SMEs
- 11.7.5.2 Competitive benchmarking of key startups/SMEs
- 11.8 COMPANY VALUATION AND FINANCIAL METRICS
- 11.9 COMPETITIVE SCENARIO
- 11.9.1 PRODUCT LAUNCHES
- 11.9.2 DEALS
- 11.9.3 EXPANSIONS
12 COMPANY PROFILES
- 12.1 KEY PLAYERS
- 12.1.1 DEXTRA GROUP
- 12.1.1.1 Business overview
- 12.1.1.2 Products offered
- 12.1.1.3 Recent developments
- 12.1.1.3.1 Deals
- 12.1.1.3.2 Expansions
- 12.1.1.3.3 Other developments
- 12.1.1.4 MnM view
- 12.1.1.4.1 Key strengths
- 12.1.1.4.2 Strategic choices
- 12.1.1.4.3 Weaknesses & competitive threats
- 12.1.2 SCHOCK BAUTEILE GMBH
- 12.1.2.1 Business overview
- 12.1.2.2 Products offered
- 12.1.2.3 MnM view
- 12.1.2.3.1 Key strengths
- 12.1.2.3.2 Strategic choices
- 12.1.2.3.3 Weaknesses & competitive threats
- 12.1.3 PULTRON COMPOSITES
- 12.1.3.1 Business overview
- 12.1.3.2 Products offered
- 12.1.3.3 Recent developments
- 12.1.3.3.1 Product launches
- 12.1.3.3.2 Deals
- 12.1.3.3.3 Expansions
- 12.1.3.3.4 Other developments
- 12.1.3.4 MnM view
- 12.1.3.4.1 Key strengths
- 12.1.3.4.2 Strategic choices
- 12.1.3.4.3 Weaknesses & competitive threats
- 12.1.4 SIREG S.P.A.
- 12.1.4.1 Business overview
- 12.1.4.2 Products offered
- 12.1.4.3 Recent developments
- 12.1.4.3.1 Deals
- 12.1.4.3.2 Other developments
- 12.1.4.4 MnM view
- 12.1.4.4.1 Key strengths
- 12.1.4.4.2 Strategic choices
- 12.1.4.4.3 Weaknesses & competitive threats
- 12.1.5 PULTRALL INC.
- 12.1.5.1 Business overview
- 12.1.5.2 Products offered
- 12.1.5.3 Recent developments
- 12.1.5.3.1 Deals
- 12.1.5.4 MnM view
- 12.1.5.4.1 Key strengths
- 12.1.5.4.2 Strategic choices
- 12.1.5.4.3 Weaknesses & competitive threats
- 12.1.6 KODIAK FIBERGLASS REBAR
- 12.1.6.1 Business overview
- 12.1.6.2 Products offered
- 12.1.6.3 MnM view
- 12.1.6.3.1 Key strengths
- 12.1.6.3.2 Strategic choices
- 12.1.6.3.3 Weaknesses & competitive threats
- 12.1.7 GATORBAR (NEUVOKAS CORPORATION)
- 12.1.7.1 Business overview
- 12.1.7.2 Products offered
- 12.1.7.3 Recent developments
- 12.1.7.3.1 Deals
- 12.1.7.4 MnM view
- 12.1.7.4.1 Key strengths
- 12.1.7.4.2 Strategic choices
- 12.1.7.4.3 Weaknesses & competitive threats
- 12.1.8 ROCHLING
- 12.1.8.1 Business overview
- 12.1.8.2 Products offered
- 12.1.8.3 MnM view
- 12.1.8.3.1 Key strengths
- 12.1.8.3.2 Strategic choices
- 12.1.8.3.3 Weaknesses & competitive threats
- 12.1.9 ARC INSULATIONS & INSULATOR LTD.
- 12.1.9.1 Business overview
- 12.1.9.2 Products offered
- 12.1.9.3 MnM view
- 12.1.9.3.1 Key strengths
- 12.1.9.3.2 Strategic choices
- 12.1.9.3.3 Weaknesses & competitive threats
- 12.1.10 JINDAL ADVANCED MATERIALS
- 12.1.10.1 Business overview
- 12.1.10.2 Products offered
- 12.1.10.3 Recent developments
- 12.1.10.3.1 Expansions
- 12.1.10.4 MnM view
- 12.1.10.4.1 Key strengths
- 12.1.10.4.2 Strategic choices
- 12.1.10.4.3 Weaknesses & competitive threats
- 12.1.11 SKD COMPOSITE
- 12.1.11.1 Business overview
- 12.1.11.2 Products offered
- 12.1.11.3 MnM view
- 12.1.11.3.1 Key strengths
- 12.1.11.3.2 Strategic choices
- 12.1.11.3.3 Weaknesses & competitive threats
- 12.1.12 GALEN LLC
- 12.1.12.1 Business overview
- 12.1.12.2 Products offered
- 12.1.12.3 MnM view
- 12.1.12.3.1 Key strengths
- 12.1.12.3.2 Strategic choices
- 12.1.12.3.3 Weaknesses & competitive threats
- 12.1.13 FIBROLUX
- 12.1.13.1 Business overview
- 12.1.13.2 Products offered
- 12.1.13.3 Recent developments
- 12.1.13.3.1 Deals
- 12.1.13.4 MnM view
- 12.1.13.4.1 Key strengths
- 12.1.13.4.2 Strategic choices
- 12.1.13.4.3 Weaknesses & competitive threats
- 12.1.14 FRT TUF-BAR
- 12.1.14.1 Business overview
- 12.1.14.2 Products offered
- 12.1.14.3 MnM view
- 12.1.14.3.1 Key strengths
- 12.1.14.3.2 Strategic choices
- 12.1.14.3.3 Weaknesses & competitive threats
- 12.1.15 ARMASTEK
- 12.1.15.1 Business overview
- 12.1.15.2 Products offered
- 12.1.15.3 Recent developments
- 12.1.15.3.1 Deals
- 12.1.15.4 MnM view
- 12.1.15.4.1 Key strengths
- 12.1.15.4.2 Strategic choices
- 12.1.15.4.3 Weaknesses & competitive threats
- 12.1.1 DEXTRA GROUP
- 12.2 OTHER PLAYERS
- 12.2.1 FIREP
- 12.2.2 MST REBAR INC.
- 12.2.3 MRG COMPOSITES REBAR
- 12.2.4 ANTOP GLOBAL TECHNOLOGY CO., LTD.
- 12.2.5 DURA COMPOSITE
- 12.2.6 ICSC
- 12.2.7 GFRP TECH
- 12.2.8 REGBAR
- 12.2.9 HENAN ZHONGSHENG COMPOSITE MATERIAL CO., LTD.
- 12.2.10 COMPOSITE GROUP CHELYABINSK
13 APPENDIX
- 13.1 DISCUSSION GUIDE
- 13.2 KNOWLEDGESTORE: MARKETSANDMARKETS' SUBSCRIPTION PORTAL
- 13.3 CUSTOMIZATION OPTIONS
- 13.4 RELATED REPORTS
- 13.5 AUTHOR DETAILS
List of Tables
- TABLE 1 GFRP REBAR MARKET: PORTER'S FIVE FORCES ANALYSIS
- TABLE 2 INFLUENCE OF STAKEHOLDERS ON BUYING PROCESS FOR TOP THREE APPLICATIONS
- TABLE 3 KEY BUYING CRITERIA FOR TOP THREE APPLICATIONS
- TABLE 4 AVERAGE SELLING PRICE OF KEY PLAYERS, BY APPLICATION, 2024 (USD/KG)
- TABLE 5 AVERAGE SELLING PRICE TREND OF GFRP REBAR, BY REGION, 2023-2024 (USD/KG)
- TABLE 6 GDP PERCENTAGE CHANGE, BY KEY COUNTRY, 2021-2029
- TABLE 7 ROLE OF COMPANIES IN GFRP REBAR ECOSYSTEM
- TABLE 8 EXPORT DATA RELATED TO HS CODE 7019-COMPLIANT PRODUCTS, BY KEY COUNTRY, 2021-2024 (USD THOUSAND)
- TABLE 9 IMPORT DATA RELATED TO HS CODE 7019-COMPLIANT PRODUCTS, BY KEY COUNTRY, 2021-2024 (USD THOUSAND)
- TABLE 10 GFRP REBAR MARKET: TOTAL NUMBER OF PATENTS, 2015-2024
- TABLE 11 LIST OF PATENTS BY CIUPERCA ROMEO ILARIAN, 2019-2024
- TABLE 12 LIST OF PATENTS BY SIKA TECH AG, 2021-2024
- TABLE 13 NORTH AMERICA: REGULATORY BODIES, GOVERNMENT AGENCIES, AND OTHER ORGANIZATIONS
- TABLE 14 EUROPE: REGULATORY BODIES, GOVERNMENT AGENCIES, AND OTHER ORGANIZATIONS
- TABLE 15 ASIA PACIFIC: REGULATORY BODIES, GOVERNMENT AGENCIES, AND OTHER ORGANIZATIONS
- TABLE 16 ROW: REGULATORY BODIES, GOVERNMENT AGENCIES, AND OTHER ORGANIZATIONS
- TABLE 17 GFRP REBAR MARKET: KEY CONFERENCES AND EVENTS, 2025-2026
- TABLE 18 TOP USE CASES AND MARKET POTENTIAL
- TABLE 19 CASE STUDIES OF AI IMPLEMENTATION IN GFRP REBAR MARKET
- TABLE 20 US ADJUSTED RECIPROCAL TARIFF RATES
- TABLE 21 KEY PRODUCT-RELATED TARIFF EFFECTIVE FOR GFRP REBARS, 2024 VS. 2025
- TABLE 22 EXPECTED CHANGE IN PRICES AND LIKELY IMPACT ON END-USE MARKETS DUE TO TARIFF IMPACT
- TABLE 23 GFRP REBAR MARKET, BY RESIN TYPE, 2023-2030 (USD THOUSAND)
- TABLE 24 GFRP REBAR MARKET, BY RESIN TYPE, 2023-2030 (TONS)
- TABLE 25 VINYL ESTER: GFRP REBAR MARKET, BY REGION, 2023-2030 (USD THOUSAND)
- TABLE 26 VINYL ESTER: GFRP REBAR MARKET, BY REGION, 2023-2030 (TONS)
- TABLE 27 EPOXY: GFRP REBAR MARKET, BY REGION, 2023-2030 (USD THOUSAND)
- TABLE 28 EPOXY: GFRP REBAR MARKET, BY REGION, 2023-2030 (TONS)
- TABLE 29 OTHER RESIN TYPES: GFRP REBAR MARKET, BY REGION, 2023-2030 (USD THOUSAND)
- TABLE 30 OTHER RESIN TYPES: GFRP REBAR MARKET, BY REGION, 2023-2030 (TONS)
- TABLE 31 GFRP REBAR MARKET, BY TENSILE STRENGTH, 2023-2030 (USD THOUSAND)
- TABLE 32 GFRP REBAR MARKET, BY TENSILE STRENGTH, 2023-2030 (TONS)
- TABLE 33 LOW STRENGTH (<1,000 MPA): GFRP REBAR MARKET, BY REGION, 2023-2030 (USD THOUSAND)
- TABLE 34 LOW STRENGTH (<1,000 MPA): GFRP REBAR MARKET, BY REGION, 2023-2030 (TONS)
- TABLE 35 HIGH STRENGTH (>1,000 MPA): GFRP REBAR MARKET, BY REGION, 2023-2030 (USD THOUSAND)
- TABLE 36 HIGH STRENGTH (>1,000 MPA): GFRP REBAR MARKET, BY REGION, 2023-2030 (TONS)
- TABLE 37 GFRP REBAR MARKET, BY DIAMETER, 2023-2030 (USD THOUSAND)
- TABLE 38 GFRP REBAR MARKET, BY DIAMETER, 2023-2030 (TONS)
- TABLE 39 <10 MM: GFRP REBAR MARKET, BY REGION, 2023-2030 (USD THOUSAND)
- TABLE 40 <10 MM: GFRP REBAR MARKET, BY REGION, 2023-2030 (TONS)
- TABLE 41 10-20 MM: GFRP REBAR MARKET, BY REGION, 2023-2030 (USD THOUSAND)
- TABLE 42 10-20 MM: GFRP REBAR MARKET, BY REGION, 2023-2030 (TONS)
- TABLE 43 >20 MM: GFRP REBAR MARKET, BY REGION, 2023-2030 (USD THOUSAND)
- TABLE 44 >20 MM: GFRP REBAR MARKET, BY REGION, 2023-2030 (TONS)
- TABLE 45 GFRP REBAR MARKET, BY APPLICATION, 2023-2030 (USD THOUSAND)
- TABLE 46 GFRP REBAR MARKET, BY APPLICATION, 2023-2030 (TONS)
- TABLE 47 HIGHWAY, BRIDGES, AND BUILDING PROJECTS USING GFRP REBAR, BY COUNTRY/REGION
- TABLE 48 HIGHWAYS, BRIDGES, AND BUILDINGS: GFRP REBAR MARKET, BY REGION, 2023-2030 (USD THOUSAND)
- TABLE 49 HIGHWAYS, BRIDGES, AND BUILDINGS: GFRP REBAR MARKET, BY REGION, 2023-2030 (TONS)
- TABLE 50 MARINE STRUCTURES & WATERFRONTS: GFRP REBAR MARKET, BY REGION, 2023-2030 (USD THOUSAND)
- TABLE 51 MARINE STRUCTURES & WATERFRONTS: GFRP REBAR MARKET, BY REGION, 2023-2030 (TONS)
- TABLE 52 WATER TREATMENT PLANTS: GFRP REBAR MARKET, BY REGION, 2023-2030 (USD THOUSAND)
- TABLE 53 WATER TREATMENT PLANTS: GFRP REBAR MARKET, BY REGION, 2023-2030 (TONS)
- TABLE 54 OTHER APPLICATIONS: GFRP REBAR MARKET, BY REGION, 2023-2030 (USD THOUSAND)
- TABLE 55 OTHER APPLICATIONS: GFRP REBAR MARKET, BY REGION, 2023-2030 (TONS)
- TABLE 56 GFRP REBAR MARKET, BY REGION, 2023-2030 (USD THOUSAND)
- TABLE 57 GFRP REBAR MARKET, BY REGION, 2023-2030 (TONS)
- TABLE 58 NORTH AMERICA: GFRP REBAR MARKET, BY RESIN TYPE, 2023-2030 (USD THOUSAND)
- TABLE 59 NORTH AMERICA: GFRP REBAR MARKET, BY RESIN TYPE, 2023-2030 (TONS)
- TABLE 60 NORTH AMERICA: GFRP REBAR MARKET, BY TENSILE STRENGTH, 2023-2030 (USD THOUSAND)
- TABLE 61 NORTH AMERICA: GFRP REBAR MARKET, BY TENSILE STRENGTH, 2023-2030 (TONS)
- TABLE 62 NORTH AMERICA: GFRP REBAR MARKET, BY DIAMETER, 2023-2030 (USD THOUSAND)
- TABLE 63 NORTH AMERICA: GFRP REBAR MARKET, BY DIAMETER, 2023-2030 (TONS)
- TABLE 64 NORTH AMERICA: GFRP REBAR MARKET, BY APPLICATION, 2023-2030 (USD THOUSAND)
- TABLE 65 NORTH AMERICA: GFRP REBAR MARKET, APPLICATION, 2023-2030 (TONS)
- TABLE 66 NORTH AMERICA: GFRP REBAR MARKET, BY COUNTRY, 2023-2030 (USD THOUSAND)
- TABLE 67 NORTH AMERICA: GFRP REBAR MARKET, BY COUNTRY, 2023-2030 (TONS)
- TABLE 68 US: GFRP REBAR MARKET, BY APPLICATION, 2023-2030 (USD THOUSAND)
- TABLE 69 US: GFRP REBAR MARKET, BY APPLICATION, 2023-2030 (TONS)
- TABLE 70 CANADA: GFRP REBAR MARKET, BY APPLICATION, 2023-2030 (USD THOUSAND)
- TABLE 71 CANADA: GFRP REBAR MARKET, BY APPLICATION, 2023-2030 (TONS)
- TABLE 72 EUROPE: GFRP REBAR MARKET, BY RESIN TYPE, 2023-2030 (USD THOUSAND)
- TABLE 73 EUROPE: GFRP REBAR MARKET, BY RESIN TYPE, 2023-2030 (TONS)
- TABLE 74 EUROPE: GFRP REBAR MARKET, BY TENSILE STRENGTH, 2023-2030 (USD THOUSAND)
- TABLE 75 EUROPE: GFRP REBAR MARKET, BY TENSILE STRENGTH, 2023-2030 (TONS)
- TABLE 76 EUROPE: GFRP REBAR MARKET, BY DIAMETER, 2023-2030 (USD THOUSAND)
- TABLE 77 EUROPE: GFRP REBAR MARKET, BY DIAMETER, 2023-2030 (TONS)
- TABLE 78 EUROPE: GFRP REBAR MARKET, BY APPLICATION, 2023-2030 (USD THOUSAND)
- TABLE 79 EUROPE: GFRP REBAR MARKET, APPLICATION, 2023-2030 (TONS)
- TABLE 80 EUROPE: GFRP REBAR MARKET, BY COUNTRY, 2023-2030 (USD THOUSAND)
- TABLE 81 EUROPE: GFRP REBAR MARKET, BY COUNTRY, 2023-2030 (TONS)
- TABLE 82 GERMANY: GFRP REBAR MARKET, BY APPLICATION, 2023-2030 (USD THOUSAND)
- TABLE 83 GERMANY: GFRP REBAR MARKET, BY APPLICATION, 2023-2030 (TONS)
- TABLE 84 FRANCE: GFRP REBAR MARKET, BY APPLICATION, 2023-2030 (USD THOUSAND)
- TABLE 85 FRANCE: GFRP REBAR MARKET, BY APPLICATION, 2023-2030 (TONS)
- TABLE 86 UK: GFRP REBAR MARKET, BY APPLICATION, 2023-2030 (USD THOUSAND)
- TABLE 87 UK: GFRP REBAR MARKET, BY APPLICATION, 2023-2030 (TONS)
- TABLE 88 ITALY: GFRP REBAR MARKET, BY APPLICATION, 2023-2030 (USD THOUSAND)
- TABLE 89 ITALY: GFRP REBAR MARKET, BY APPLICATION, 2023-2030 (TONS)
- TABLE 90 RUSSIA: GFRP REBAR MARKET, BY APPLICATION, 2023-2030 (USD THOUSAND)
- TABLE 91 RUSSIA: GFRP REBAR MARKET, BY APPLICATION, 2023-2030 (TONS)
- TABLE 92 REST OF EUROPE: GFRP REBAR MARKET, BY APPLICATION, 2023-2030 (USD THOUSAND)
- TABLE 93 REST OF EUROPE: GFRP REBAR MARKET, BY APPLICATION, 2023-2030 (TONS)
- TABLE 94 ASIA PACIFIC: GFRP REBAR MARKET, BY RESIN TYPE, 2023-2030 (USD THOUSAND)
- TABLE 95 ASIA PACIFIC: GFRP REBAR MARKET, BY RESIN TYPE, 2023-2030 (TONS)
- TABLE 96 ASIA PACIFIC: GFRP REBAR MARKET, BY TENSILE STRENGTH, 2023-2030 (USD THOUSAND)
- TABLE 97 ASIA PACIFIC: GFRP REBAR MARKET, BY TENSILE STRENGTH, 2023-2030 (TONS)
- TABLE 98 ASIA PACIFIC: GFRP REBAR MARKET, BY DIAMETER, 2023-2030 (USD THOUSAND)
- TABLE 99 ASIA PACIFIC: GFRP REBAR MARKET, BY DIAMETER, 2023-2030 (TONS)
- TABLE 100 ASIA PACIFIC: GFRP REBAR MARKET, BY APPLICATION, 2023-2030 (USD THOUSAND)
- TABLE 101 ASIA PACIFIC: GFRP REBAR MARKET, APPLICATION, 2023-2030 (TONS)
- TABLE 102 ASIA PACIFIC: GFRP REBAR MARKET, BY COUNTRY, 2023-2030 (USD THOUSAND)
- TABLE 103 ASIA PACIFIC: GFRP REBAR MARKET, BY COUNTRY, 2023-2030 (TONS)
- TABLE 104 CHINA: GFRP REBAR MARKET, BY APPLICATION, 2023-2030 (USD THOUSAND)
- TABLE 105 CHINA: GFRP REBAR MARKET, BY APPLICATION, 2023-2030 (TONS)
- TABLE 106 SOUTH KOREA: GFRP REBAR MARKET, BY APPLICATION, 2023-2030 (USD THOUSAND)
- TABLE 107 SOUTH KOREA: GFRP REBAR MARKET, BY APPLICATION, 2023-2030 (TONS)
- TABLE 108 INDIA: GFRP REBAR MARKET, BY APPLICATION, 2023-2030 (USD THOUSAND)
- TABLE 109 INDIA: GFRP REBAR MARKET, BY APPLICATION, 2023-2030 (TONS)
- TABLE 110 JAPAN: GFRP REBAR MARKET, BY APPLICATION, 2023-2030 (USD THOUSAND)
- TABLE 111 JAPAN: GFRP REBAR MARKET, BY APPLICATION, 2023-2030 (TONS)
- TABLE 112 REST OF ASIA PACIFIC: GFRP REBAR MARKET, BY APPLICATION, 2023-2030 (USD THOUSAND)
- TABLE 113 REST OF ASIA PACIFIC: GFRP REBAR MARKET, BY APPLICATION, 2023-2030 (TONS)
- TABLE 114 MIDDLE EAST & AFRICA: GFRP REBAR MARKET, BY RESIN TYPE, 2023-2030 (USD THOUSAND)
- TABLE 115 MIDDLE EAST & AFRICA: GFRP REBAR MARKET, BY RESIN TYPE, 2023-2030 (TONS)
- TABLE 116 MIDDLE EAST & AFRICA: GFRP REBAR MARKET, BY TENSILE STRENGTH, 2023-2030 (USD THOUSAND)
- TABLE 117 MIDDLE EAST & AFRICA: GFRP REBAR MARKET, BY TENSILE STRENGTH, 2023-2030 (TONS)
- TABLE 118 MIDDLE EAST & AFRICA: GFRP REBAR MARKET, BY DIAMETER, 2023-2030 (USD THOUSAND)
- TABLE 119 MIDDLE EAST & AFRICA: GFRP REBAR MARKET, BY DIAMETER, 2023-2030 (TONS)
- TABLE 120 MIDDLE EAST & AFRICA: GFRP REBAR MARKET, BY APPLICATION, 2023-2030 (USD THOUSAND)
- TABLE 121 MIDDLE EAST & AFRICA: GFRP REBAR MARKET, APPLICATION, 2023-2030 (TONS)
- TABLE 122 MIDDLE EAST & AFRICA: GFRP REBAR MARKET, BY COUNTRY, 2023-2030 (USD THOUSAND)
- TABLE 123 MIDDLE EAST & AFRICA: GFRP REBAR MARKET, BY COUNTRY, 2023-2030 (TONS)
- TABLE 124 UAE: GFRP REBAR MARKET, BY APPLICATION, 2023-2030 (USD THOUSAND)
- TABLE 125 UAE: GFRP REBAR MARKET, BY APPLICATION, 2023-2030 (TONS)
- TABLE 126 SAUDI ARABIA: GFRP REBAR MARKET, BY APPLICATION, 2023-2030 (USD THOUSAND)
- TABLE 127 SAUDI ARABIA: GFRP REBAR MARKET, BY APPLICATION, 2023-2030 (TONS)
- TABLE 128 OTHER GCC COUNTRIES: GFRP REBAR MARKET, BY APPLICATION, 2023-2030 (USD THOUSAND)
- TABLE 129 OTHER GCC COUNTRIES: GFRP REBAR MARKET, BY APPLICATION, 2023-2030 (TONS)
- TABLE 130 SOUTH AFRICA: GFRP REBAR MARKET, BY APPLICATION, 2023-2030 (USD THOUSAND)
- TABLE 131 SOUTH AFRICA: GFRP REBAR MARKET, BY APPLICATION, 2023-2030 (TONS)
- TABLE 132 REST OF MIDDLE EAST & AFRICA: GFRP REBAR MARKET, BY APPLICATION, 2023-2030 (USD THOUSAND)
- TABLE 133 REST OF MIDDLE EAST & AFRICA: GFRP REBAR MARKET, BY APPLICATION, 2023-2030 (TONS)
- TABLE 134 LATIN AMERICA: GFRP REBAR MARKET, BY RESIN TYPE, 2023-2030 (USD THOUSAND)
- TABLE 135 LATIN AMERICA: GFRP REBAR MARKET, BY RESIN TYPE, 2023-2030 (TONS)
- TABLE 136 LATIN AMERICA: GFRP REBAR MARKET, BY TENSILE STRENGTH, 2023-2030 (USD THOUSAND)
- TABLE 137 LATIN AMERICA: GFRP REBAR MARKET, BY TENSILE STRENGTH, 2023-2030 (TONS)
- TABLE 138 LATIN AMERICA: GFRP REBAR MARKET, BY DIAMETER, 2023-2030 (USD THOUSAND)
- TABLE 139 LATIN AMERICA: GFRP REBAR MARKET, BY DIAMETER, 2023-2030 (TONS)
- TABLE 140 LATIN AMERICA: GFRP REBAR MARKET, BY APPLICATION, 2023-2030 (USD THOUSAND)
- TABLE 141 LATIN AMERICA: GFRP REBAR MARKET, APPLICATION, 2023-2030 (TONS)
- TABLE 142 LATIN AMERICA: GFRP REBAR MARKET, BY COUNTRY, 2023-2030 (USD THOUSAND)
- TABLE 143 LATIN AMERICA: GFRP REBAR MARKET, BY COUNTRY, 2023-2030 (TONS)
- TABLE 144 MEXICO: GFRP REBAR MARKET, BY APPLICATION, 2023-2030 (USD THOUSAND)
- TABLE 145 MEXICO: GFRP REBAR MARKET, BY APPLICATION, 2023-2030 (TONS)
- TABLE 146 BRAZIL: GFRP REBAR MARKET, BY APPLICATION, 2023-2030 (USD THOUSAND)
- TABLE 147 BRAZIL: GFRP REBAR MARKET, BY APPLICATION, 2023-2030 (TONS)
- TABLE 148 REST OF LATIN AMERICA: GFRP REBAR MARKET, BY APPLICATION, 2023-2030 (USD THOUSAND)
- TABLE 149 REST OF LATIN AMERICA: GFRP REBAR MARKET, BY APPLICATION, 2023-2030 (TONS)
- TABLE 150 GFRP REBAR MARKET: KEY STRATEGIES ADOPTED BY MAJOR PLAYERS
- TABLE 151 GFRP REBAR MARKET: DEGREE OF COMPETITION, 2024
- TABLE 152 GFRP REBAR MARKET: REGION FOOTPRINT
- TABLE 153 GFRP REBAR MARKET: RESIN TYPE FOOTPRINT
- TABLE 154 GFRP REBAR MARKET: DIAMETER FOOTPRINT
- TABLE 155 GFRP REBAR MARKET: TENSILE STRENGTH FOOTPRINT
- TABLE 156 GFRP REBAR MARKET: APPLICATION FOOTPRINT
- TABLE 157 GFRP REBAR MARKET: KEY STARTUPS/SMES
- TABLE 158 GFRP REBAR MARKET: COMPETITIVE BENCHMARKING OF KEY STARTUPS/SMES
- TABLE 159 GFRP REBAR MARKET: PRODUCT LAUNCHES, JANUARY 2021-JULY 2025
- TABLE 160 GFRP REBAR MARKET: DEALS, JANUARY 2021-JULY 2025
- TABLE 161 GFRP REBAR MARKET: EXPANSIONS, JANUARY 2021-JULY 2025
- TABLE 162 DEXTRA GROUP: COMPANY OVERVIEW
- TABLE 163 DEXTRA GROUP: PRODUCTS OFFERED
- TABLE 164 DEXTRA GROUP: DEALS
- TABLE 165 DEXTRA GROUP: EXPANSIONS
- TABLE 166 DEXTRA GROUP: OTHER DEVELOPMENTS
- TABLE 167 SCHOCK BAUTEILE GMBH: COMPANY OVERVIEW
- TABLE 168 SCHOCK BAUTEILE GMBH: PRODUCTS OFFERED
- TABLE 169 PULTRON COMPOSITES: COMPANY OVERVIEW
- TABLE 170 PULTRON COMPOSITES: PRODUCTS OFFERED
- TABLE 171 PULTRON COMPOSITES: PRODUCT LAUNCHES
- TABLE 172 PULTRON COMPOSITES: DEALS
- TABLE 173 PULTRON COMPOSITES: EXPANSIONS
- TABLE 174 PULTRON COMPOSITES: OTHER DEVELOPMENTS
- TABLE 175 SIREG S.P.A.: COMPANY OVERVIEW
- TABLE 176 SIREG S.P.A.: PRODUCTS OFFERED
- TABLE 177 SIREG S.P.A.: DEALS
- TABLE 178 SIREG S.P.A.: OTHER DEVELOPMENTS
- TABLE 179 PULTRALL INC.: COMPANY OVERVIEW
- TABLE 180 PULTRALL INC.: PRODUCTS OFFERED
- TABLE 181 PULTRALL INC.: DEALS
- TABLE 182 KODIAK FIBERGLASS REBAR: COMPANY OVERVIEW
- TABLE 183 KODIAK FIBERGLASS REBAR: PRODUCTS OFFERED
- TABLE 184 NEUVOKAS CORPORATION: COMPANY OVERVIEW
- TABLE 185 NEUVOKAS CORPORATION: PRODUCTS OFFERED
- TABLE 186 NEUVOKAS CORPORATION: DEALS
- TABLE 187 ROCHLING: COMPANY OVERVIEW
- TABLE 188 ROCHLING: PRODUCTS OFFERED
- TABLE 189 ARC INSULATIONS & INSULATOR LTD.: COMPANY OVERVIEW
- TABLE 190 ARC INSULATIONS & INSULATOR LTD.: PRODUCTS OFFERED
- TABLE 191 JINDAL ADVANCED MATERIALS: COMPANY OVERVIEW
- TABLE 192 JINDAL ADVANCED MATERIALS: PRODUCTS OFFERED
- TABLE 193 JINDAL ADVANCED MATERIALS: EXPANSIONS
- TABLE 194 SKD COMPOSITE: COMPANY OVERVIEW
- TABLE 195 SKD COMPOSITE: PRODUCTS OFFERED
- TABLE 196 GALEN LLC: COMPANY OVERVIEW
- TABLE 197 GALEN LLC: PRODUCTS OFFERED
- TABLE 198 FIBROLUX: COMPANY OVERVIEW
- TABLE 199 FIBROLUX: PRODUCTS OFFERED
- TABLE 200 FIBROLUX: DEALS
- TABLE 201 FRT TUF-BAR: COMPANY OVERVIEW
- TABLE 202 FRT TUF-BAR: PRODUCTS OFFERED
- TABLE 203 ARMASTEK: COMPANY OVERVIEW
- TABLE 204 ARMASTEK: PRODUCTS OFFERED
- TABLE 205 ARMASTEK: DEALS
- TABLE 206 FIREP: COMPANY OVERVIEW
- TABLE 207 MST REBAR INC.: COMPANY OVERVIEW
- TABLE 208 MRG COMPOSITES REBAR: COMPANY OVERVIEW
- TABLE 209 ANTOP GLOBAL TECHNOLOGY CO., LTD: COMPANY OVERVIEW
- TABLE 210 DURA COMPOSITE: COMPANY OVERVIEW
- TABLE 211 ICSC: COMPANY OVERVIEW
- TABLE 212 GFRP TECH: COMPANY OVERVIEW
- TABLE 213 REGBAR: COMPANY OVERVIEW
- TABLE 214 HENAN ZHONGSHENG COMPOSITE MATERIAL CO., LTD.: COMPANY OVERVIEW
- TABLE 215 COMPOSITE GROUP CHELYABINSK: COMPANY OVERVIEW
List of Figures
- FIGURE 1 GFRP REBAR MARKET: SEGMENTATION AND REGIONAL SCOPE
- FIGURE 2 GFRP REBAR MARKET: RESEARCH DESIGN
- FIGURE 3 MARKET SIZE ESTIMATION METHODOLOGY: BOTTOM-UP APPROACH
- FIGURE 4 MARKET SIZE ESTIMATION: TOP-DOWN APPROACH
- FIGURE 5 GFRP REBAR MARKET: DATA TRIANGULATION
- FIGURE 6 VINYL ESTER SEGMENT TO ACCOUNT FOR LARGEST MARKET SIZE IN 2030
- FIGURE 7 LOW STRENGTH SEGMENT TO LEAD MARKET IN 2030
- FIGURE 8 10-20 MM SEGMENT TO DOMINATE MARKET IN 2030
- FIGURE 9 HIGHWAY, BRIDGES, AND BUILDINGS SEGMENT TO LEAD MARKET IN 2030
- FIGURE 10 ASIA PACIFIC TO REGISTER HIGHEST GROWTH RATE DURING FORECAST PERIOD
- FIGURE 11 INCREASING DEMAND IN CONSTRUCTION INDUSTRY TO CREATE LUCRATIVE OPPORTUNITIES FOR MARKET PLAYERS
- FIGURE 12 HIGHWAYS, BRIDGES, AND BUILDINGS SEGMENT AND ASIA PACIFIC DOMINATED GFRP REBAR MARKET IN 2024
- FIGURE 13 EPOXY SEGMENT TO EXHIBIT HIGHEST CAGR DURING FORECAST PERIOD
- FIGURE 14 LOW STRENGTH SEGMENT TO REGISTER HIGHER CAGR DURING FORECAST PERIOD
- FIGURE 15 10-20 MM SEGMENT TO RECORD FASTEST GROWTH DURING FORECAST PERIOD
- FIGURE 16 HIGHWAY, BRIDGES, AND BUILDINGS SEGMENT TO GROW AT HIGHEST RATE DURING REVIEW PERIOD
- FIGURE 17 INDIA TO REGISTER HIGHEST CAGR IN GFRP REBAR MARKET DURING FORECAST PERIOD
- FIGURE 18 GFRP REBAR MARKET: DRIVERS, RESTRAINTS, OPPORTUNITIES, AND CHALLENGES
- FIGURE 19 GFRP REBAR MARKET: PORTER'S FIVE FORCES ANALYSIS
- FIGURE 20 INFLUENCE OF STAKEHOLDERS ON BUYING PROCESS FOR TOP THREE APPLICATIONS
- FIGURE 21 BUYING CRITERIA FOR TOP THREE APPLICATIONS
- FIGURE 22 AVERAGE SELLING PRICE TREND, BY REGION, 2023-2024
- FIGURE 23 GFRP REBAR MARKET: VALUE CHAIN ANALYSIS
- FIGURE 24 GFRP REBAR MARKET: KEY STAKEHOLDERS IN THE ECOSYSTEM
- FIGURE 25 EXPORT DATA FOR HS CODE 7019-COMPLIANT PRODUCTS, BY KEY COUNTRY, 2021-2024 (USD THOUSAND)
- FIGURE 26 IMPORT DATA FOR HS CODE 7019-COMPLIANT PRODUCTS, BY KEY COUNTRY, 2021-2024 (USD THOUSAND)
- FIGURE 27 PATENT ANALYSIS, BY DOCUMENT TYPE, 2015 - 2024
- FIGURE 28 PATENT PUBLICATION TREND, 2015-2024
- FIGURE 29 LEGAL STATUS OF PATENTS, 2015-2024
- FIGURE 30 US REGISTERED HIGHEST PERCENTAGE OF PATENTS BETWEEN 2015 AND 2024
- FIGURE 31 KING FAHD UNIVERSITY OF PETROLEUM AND MINERALS REGISTERED HIGHEST PERCENTAGE OF PATENTS, 2015-2024
- FIGURE 32 TRENDS/DISRUPTIONS IMPACTING CUSTOMER BUSINESS
- FIGURE 33 GFRP REBAR MARKET: DEALS AND FUNDING, 2020-2024 (USD MILLION)
- FIGURE 34 EPOXY SEGMENT TO REGISTER HIGHEST CAGR DURING FORECAST PERIOD
- FIGURE 35 LOW STRENGTH SEGMENT TO REGISTER HIGHEST CAGR DURING FORECAST PERIOD
- FIGURE 36 10-20 MM SEGMENT TO REGISTER HIGHEST CAGR DURING FORECAST PERIOD
- FIGURE 37 HIGHWAYS, BRIDGES, AND BUILDINGS SEGMENT TO REGISTER HIGHEST CAGR DURING FORECAST PERIOD
- FIGURE 38 INDIA TO REGISTER FASTEST GROWTH IN GFRP REBAR MARKET DURING FORECAST PERIOD
- FIGURE 39 NORTH AMERICA: GFRP REBAR MARKET SNAPSHOT
- FIGURE 40 EUROPE: GFRP REBAR MARKET SNAPSHOT
- FIGURE 41 ASIA PACIFIC: GFRP REBAR MARKET SNAPSHOT
- FIGURE 42 GFRP REBAR MARKET: REVENUE ANALYSIS OF KEY PLAYERS, 2020-2024 (USD MILLION)
- FIGURE 43 GFRP REBAR MARKET SHARE ANALYSIS, 2024
- FIGURE 44 GFRP REBAR MARKET: TOP TRENDING BRANDS/PRODUCTS
- FIGURE 45 GFRP REBAR MARKET: BRAND/PRODUCT COMPARATIVE ANALYSIS
- FIGURE 46 GFRP REBAR MARKET: COMPANY EVALUATION MATRIX (KEY PLAYERS), 2024
- FIGURE 47 GFRP REBAR MARKET: COMPANY FOOTPRINT
- FIGURE 48 GFRP REBAR MARKET: COMPANY EVALUATION MATRIX (STARTUPS/SMES), 2024
- FIGURE 49 GFRP REBAR MARKET: EV/EBITDA OF KEY VENDORS
- FIGURE 50 GFRP REBAR MARKET: COMPANY VALUATION, 2024 (USD BILLION)
- FIGURE 51 GFRP REBAR MARKET: YEAR-TO-DATE (YTD) PRICE TOTAL RETURN AND 5-YEAR STOCK BETA OF KEY VENDORS
- FIGURE 52 ARC INSULATIONS & INSULATOR LTD.: COMPANY SNAPSHOT

