
PUBLISHER: MarketsandMarkets | PRODUCT CODE: 1808085

PUBLISHER: MarketsandMarkets | PRODUCT CODE: 1808085
Oral Rinses Market by Product Type, Indication, Distribution Channel, Region - Global Forecast to 2030
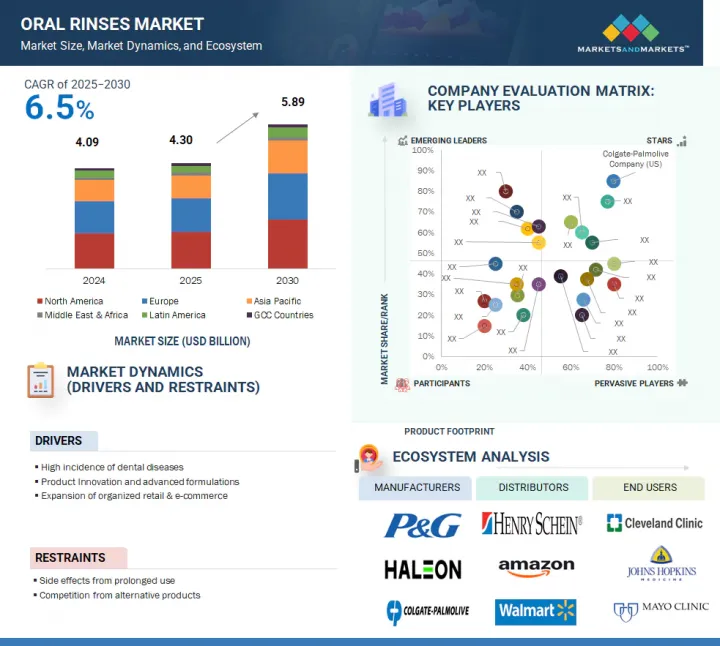
The global oral rinses market is projected to reach USD 5.89 billion in 2030 from USD 4.30 billion in 2025, at a CAGR of 6.5% during the forecast period.Growing awareness of advanced oral care products, along with a rising global population, is expected to drive the growth of the oral rinses market. Continuous innovation in formulation technologies, including the use of fluoride variants, essential oils, herbal actives, and alcohol-free bases, is improving product effectiveness, safety, and appeal to consumers. These improvements are increasing the effectiveness, availability, and attractiveness of oral rinses to a broader range of customers and clinical uses.
| Scope of the Report | |
|---|---|
| Years Considered for the Study | 2024-2030 |
| Base Year | 2024 |
| Forecast Period | 2025-2030 |
| Units Considered | Value (USD billion) |
| Segments | Product Type, Indication, Distribution Channel, and Region |
| Regions covered | Asia Pacific, North America, Europe, Latin America, Middle East & Africa, and GCC Countries |
Demand is also growing due to an increase in dental diseases and an aging population in need of additional oral care. However, broader market adoption may be limited by the high cost of therapeutic mouthwash and, in some markets, low consumer acceptance or adherence.
By product type, the therapeutic rinses segment had the largest share of the global oral rinses market.
The global oral rinses market is divided into three main segments: therapeutic rinses, cosmetic rinses, and others. The therapeutic rinses segment dominates the oral hygiene market due to their significant functional advantages and clinical endorsement. These formulations are enriched with active agents that effectively lower bacterial loads, mitigate the risk of periodontal diseases, and promote enamel integrity. They are specifically engineered to address the etiology of oral health issues rather than merely alleviating symptoms. Key drivers for their adoption include professional recommendations from dentists, an increasing consumer emphasis on long-term oral health maintenance, and heightened awareness of the correlation between oral health and systemic conditions. The accessibility of these products in both clinical environments and retail outlets further amplifies their market penetration.
The general oral health segment commanded the largest share of the global oral rinses market based on indication.
The global oral rinses market is divided into several categories based on indication: general oral health, gingivitis & periodontal diseases, halitosis, dry mouth, and other conditions. The general oral health segment is anticipated to command the largest share of the market due to its expansive positioning, enabling manufacturers to engage a diverse consumer base, including individuals focused on preventive oral care. Contributing factors to this segment's growth include enhanced accessibility, minimal regulatory constraints, and robust retail visibility. Furthermore, strategic brand-centric marketing initiatives have been pivotal in embedding general-use mouthwashes into daily personal care regimens globally, thereby reinforcing their market dominance. This segment exhibits relatively stable demand trajectories, making it an appealing prospect for long-term investment strategies. Leading industry players have consistently prioritized this category within their portfolios, recognizing it as a principal contributor to sales volume and market share expansion.
By distribution channel, the consumer stores segment accounted for the largest share of the global oral rinses market.
The global oral rinses market is divided by distribution channel into consumer stores, retail pharmacies & dental dispensaries, and online sales. Consumer retail outlets dominate the oral rinses market, attributed to their extensive physical presence, high in-store brand visibility, and the convenience they afford to everyday shoppers. Supermarkets and general retail establishments facilitate direct access to a diverse range of products, enabling consumers to easily compare brands. Additionally, these venues frequently implement promotional strategies and incentives that stimulate impulse purchasing behaviors. The integration of oral care products into routine grocery shopping significantly boosts sales volumes through this channel. Furthermore, established collaborations with fast-moving consumer goods (FMCG) distributors and optimized shelf placement strategies enhance their competitive advantage within the market.
The Asia Pacific is expected to grow at the highest CAGR in the oral rinses market during the forecast period.
The rapid growth of the population in the Asia Pacific region, coupled with a rising demand for sophisticated oral care solutions, is significantly driving the market for oral rinses. As the middle class expands, consumer interest in maintaining oral health has surged, leading to a greater emphasis on the importance of effective oral hygiene products. In response to these trends, leading global companies in the oral care industry are strategically increasing their presence in this dynamic market. They are doing so by introducing innovative formulations that cater to diverse needs, such as whitening, sensitivity relief, and antibacterial properties, as well as launching digitally integrated oral hygiene solutions that promote seamless user experiences. Moreover, indication-specific mouthwashes designed to target particular oral health issues are becoming increasingly popular, further contributing to the robust demand for oral rinses across the region.
A breakdown of the primary participants (supply side) for the oral rinses market referred to in this report is provided below:
- By Company Type: Tier 1 (30%), Tier 2 (35%), and Tier 3 (35%)
- By Designation: C-level Executives (20%), Directors (35%), and Others (45%)
- By Region: North America (30%), Europe (25%), Asia Pacific (20%), Latin America (20%), Middle East & Africa (2%), GCC Countries (3%)
Prominent players in the oral rinses market include Colgate-Palmolive Company (US), Kenvue (US), Procter & Gamble (US), Haleon Group of Companies (UK), Unilever (UK), Church & Dwight Co., Inc. (US), Lion Corporation (Japan), Amway (US), SUNSTAR Suisse S.A. (Switzerland), Perrigo Company plc (Ireland), Dabur (India), Himalaya Wellness Company (India), Kao Corporation (Japan), Opella Healthcare Group SAS (France), SmartMouth Oral Health Laboratories (US), Dentaid Ltd. (Spain), CloSYS (US), SCANDERRA GmbH (Switzerland), Pearlie White (Singapore), Dr. Wild & Co. AG (Switzerland), Boka (US), Perfora (India), Salt Oral Care (India), OraBio, Inc. (US), and Lumineux (US).
Research Coverage
The report offers an analysis of the oral rinses market, focusing on estimating the market size and potential for future growth across various segments, including distribution channels, regions, indications, and product types. Additionally, the report includes a competitive analysis of major market players, detailing their company profiles, product and service offerings, recent developments, and key strategies.
Reasons to Buy the Report
The report delivers critical insights for industry leaders and new entrants within the oral rinses sector, presenting estimated revenue projections for the overall market as well as its distinct segments. It facilitates a comprehensive understanding of the competitive landscape, enabling stakeholders to effectively position their businesses and devise robust go-to-market strategies. Furthermore, the document delineates key market drivers, constraints, challenges, and opportunities, equipping stakeholders to evaluate prevailing market conditions with a high degree of accuracy.
This report provides insights into the following pointers:
- Analysis of key drivers (high incidence of dental diseases, product innovation and advanced formulations), restraints (side effects from prolonged use, competition from alternative products), opportunities (rising trend of online purchasing and e-commerce, growing awareness about oral hygiene), and challenges (limited penetration in rural areas, high price points limit broader consumer adoption).
- Market Penetration: This report provides detailed information on the product portfolios offered by major players in the global oral rinses market. It covers various segments, including product types, indications, distribution channels, and regions.
- Product Enhancement/Innovation: Comprehensive details about new product launches and anticipated trends in the global oral rinses market.
- Market Development: Thorough knowledge and analysis of the profitable rising markets by product type, indication, distribution channel, and region.
- Market Diversification: Comprehensive information about newly launched products and services, expanding markets, current advancements, and investments in the global oral rinses market.
- Competitive Assessment: Thorough evaluation of the market shares, growth plans, offerings of products and services, and capacities of the major competitors in the global oral rinses market.
TABLE OF CONTENTS
1 INTRODUCTION
- 1.1 STUDY OBJECTIVES
- 1.2 MARKET DEFINITION
- 1.3 STUDY SCOPE
- 1.3.1 ORAL RINSES MARKET SEGMENTATION & REGIONAL SCOPE
- 1.3.2 INCLUSIONS & EXCLUSIONS
- 1.3.3 YEARS CONSIDERED
- 1.3.4 CURRENCY CONSIDERED
- 1.4 STAKEHOLDERS
2 RESEARCH METHODOLOGY
- 2.1 RESEARCH DATA
- 2.1.1 SECONDARY DATA
- 2.1.1.1 Key secondary sources
- 2.1.1.2 Key data from secondary sources
- 2.1.2 PRIMARY DATA
- 2.1.2.1 Objectives of primary research
- 2.1.2.2 Key data from primary sources
- 2.1.2.3 Key industry insights
- 2.1.1 SECONDARY DATA
- 2.2 MARKET SIZE ESTIMATION
- 2.2.1 REVENUE SHARE ANALYSIS
- 2.2.2 BOTTOM-UP APPROACH (SUPPLY-SIDE ANALYSIS)
- 2.2.3 COMPANY PRESENTATIONS & PRIMARY INTERVIEWS
- 2.2.4 TOP-DOWN APPROACH
- 2.3 DATA TRIANGULATION
- 2.4 MARKET SHARE ESTIMATION
- 2.5 STUDY ASSUMPTIONS
- 2.6 RESEARCH LIMITATIONS
- 2.6.1 SCOPE-RELATED LIMITATIONS
- 2.6.2 METHODOLOGY-RELATED LIMITATIONS
- 2.7 RISK ANALYSIS
3 EXECUTIVE SUMMARY
4 PREMIUM INSIGHTS
- 4.1 ORAL RINSES MARKET OVERVIEW
- 4.2 ASIA PACIFIC: ORAL RINSES MARKET, BY PRODUCT TYPE AND COUNTRY
- 4.3 ORAL RINSES MARKET: GEOGRAPHIC GROWTH OPPORTUNITIES
- 4.4 ORAL RINSES MARKET: REGIONAL MIX
- 4.5 ORAL RINSES MARKET: DEVELOPED VS. EMERGING MARKETS, 2025 VS. 2030
5 MARKET OVERVIEW
- 5.1 INTRODUCTION
- 5.2 MARKET DYNAMICS
- 5.2.1 DRIVERS
- 5.2.1.1 High incidence of chronic dental diseases
- 5.2.1.2 Increasing household purchasing power of middle-class population in emerging economies
- 5.2.1.3 Rising focus on creating public awareness and targeted educational campaigns
- 5.2.2 RESTRAINTS
- 5.2.2.1 High cost of therapeutic and specialty formula-based oral rinses
- 5.2.2.2 Side effects from prolonged use of therapeutic and alcohol-based mouthwashes
- 5.2.3 OPPORTUNITIES
- 5.2.3.1 Rising trends of online purchasing and e-commerce
- 5.2.4 CHALLENGES
- 5.2.4.1 Rising number of product recalls
- 5.2.4.2 Limited penetration in rural and semi-urban areas in emerging economies
- 5.2.1 DRIVERS
- 5.3 INDUSTRY TRENDS
- 5.3.1 STRATEGIC DEMERGER OF CONSUMER HEALTHCARE DIVISIONS BY LEADING PHARMACEUTICAL COMPANIES
- 5.3.2 RISE OF NATURAL AND HERBAL ORAL RINSES AMID CLEAN-LABEL CONSUMER SHIFT
- 5.4 TECHNOLOGY ANALYSIS
- 5.4.1 KEY TECHNOLOGIES
- 5.4.1.1 Flouride
- 5.4.1.2 Anti-microbial agents
- 5.4.2 COMPLEMENTARY TECHNOLOGIES
- 5.4.2.1 Essential oils
- 5.4.3 ADJACENT TECHNOLOGIES
- 5.4.3.1 Electric dental flossers
- 5.4.1 KEY TECHNOLOGIES
- 5.5 PRICING ANALYSIS
- 5.5.1 AVERAGE SELLING PRICE TREND OF ORAL RINSES, BY KEY PLAYER, 2022-2024
- 5.5.2 AVERAGE SELLING PRICE TREND OF ORAL RINSES, BY REGION, 2022-2024
- 5.6 ECOSYSTEM ANALYSIS
- 5.6.1 ROLE IN ECOSYSTEM
- 5.7 REIMBURSEMENT SCENARIO ANALYSIS
- 5.8 VALUE CHAIN ANALYSIS
- 5.9 PORTER'S FIVE FORCES ANALYSIS
- 5.9.1 INTENSITY OF COMPETITIVE RIVALRY
- 5.9.2 BARGAINING POWER OF SUPPLIERS
- 5.9.3 BARGAINING POWER OF BUYERS
- 5.9.4 THREAT OF SUBSTITUTES
- 5.9.5 THREAT OF NEW ENTRANTS
- 5.10 KEY STAKEHOLDERS & BUYING CRITERIA
- 5.10.1 KEY STAKEHOLDERS IN BUYING PROCESS
- 5.10.2 KEY BUYING CRITERIA
- 5.11 SUPPLY CHAIN ANALYSIS
- 5.12 TRADE ANALYSIS
- 5.12.1 IMPORT DATA FOR HS CODE 330690, 2020-2024
- 5.12.2 EXPORT DATA FOR HS CODE 330690, 2020-2024
- 5.13 REGULATORY ANALYSIS
- 5.13.1 REGULATORY FRAMEWORK
- 5.13.1.1 North America
- 5.13.1.1.1 US
- 5.13.1.2 European Union
- 5.13.1.3 Asia Pacific
- 5.13.1.3.1 China
- 5.13.1.1 North America
- 5.13.2 REGULATORY BODIES, GOVERNMENT AGENCIES, AND OTHER ORGANIZATIONS
- 5.13.1 REGULATORY FRAMEWORK
- 5.14 PATENT ANALYSIS
- 5.14.1 PATENT PUBLICATION TRENDS FOR ORAL RINSES MARKET
- 5.14.2 JURISDICTION ANALYSIS: TOP APPLICANTS FOR PATENTS IN ORAL RINSES MARKET
- 5.14.3 LIST OF MAJOR PATENTS
- 5.15 KEY CONFERENCES & EVENTS, 2025-2026
- 5.16 ADJACENT MARKET ANALYSIS
- 5.17 TRENDS/DISRUPTIONS IMPACTING CUSTOMERS' BUSINESSES
- 5.18 UNMET NEEDS/END-USER EXPECTATIONS
- 5.18.1 UNMET NEEDS
- 5.18.2 END-USER EXPECTATIONS
- 5.19 IMPACT OF AI/GEN AI ON ORAL RINSES MARKET
- 5.20 CASE STUDY ANALYSIS
- 5.20.1 CAPHOSOL ORAL RINSE TO EFFECTIVELY MANAGE CHEMOTHERAPY-INDUCED ORAL MUCOSITIS
- 5.20.2 ANTISPECTIC MOUTHWASHES TO PREVENT VENTILATOR-ASSOCIATED PNEUMONIA (VAP) AMONG MECHANICALLY VENTILATED PATIENTS
- 5.20.3 HERBAL MOUTHRINSE TO BE EFFECIVE FOR CHLORHEXIDINE WITHOUT ADVERSE EFFECTS
- 5.21 INVESTMENT & FUNDING SCENARIO
- 5.22 IMPACT OF 2025 US TARIFF ON ORAL RINSES MARKET
- 5.22.1 INTRODUCTION
- 5.22.2 KEY TARIFF RATES
- 5.22.3 KEY TARIFF RATES
- 5.22.4 PRICE IMPACT ANALYSIS
- 5.22.5 IMPACT ON COUNTRY/REGION
- 5.22.5.1 North America
- 5.22.5.1.1 US
- 5.22.5.2 Europe
- 5.22.5.3 Asia Pacific
- 5.22.5.1 North America
- 5.22.6 IMPACT ON END-USE INDUSTRIES
6 ORAL RINSES MARKET, BY PRODUCT TYPE
- 6.1 INTRODUCTION
- 6.2 THERAPEUTIC RINSES
- 6.2.1 INCREASING PREVALENCE OF ORAL DISEASES TO BOOST ADOPTION OF THERAPEUTIC RINSES
- 6.3 COSMETIC RINSES
- 6.3.1 RISE IN AESTHETIC CONSCIOUSNESS TO PROMOTE ADOPTION OF COSMETIC RINSES
- 6.4 OTHER RINSES
7 ORAL RINSES MARKET, BY INDICATION
- 7.1 INTRODUCTION
- 7.2 GENERAL ORAL HEALTH
- 7.2.1 GENERAL USE MOUTHWASHES TO REDUCE PLAQUE, FRESHEN BREATH, SUPPORT GUM HEALTH, AND ENHANCE ORAL CLEANLINESS
- 7.3 GINGIVITIS & PERIODONTAL DISEASES
- 7.3.1 WIDESPREAD PREVALENCE OF GUM-RELATED CONDITIONS AND HIGH DEMAND FOR NON-INVASIVE TREATMENTS TO DRIVE MARKET
- 7.4 HALITOSIS
- 7.4.1 RISING AESTHETIC CONSCIOUSNESS TO FUEL ADOPTION OF ORAL RINSES FOR BAD BREATH
- 7.5 DRY MOUTH
- 7.5.1 RISING GERIATRIC POPULATION WITH CHRONIC DISEASES TO PROPEL SEGMENT GROWTH
- 7.6 OTHER INDICATIONS
8 ORAL RINSES MARKET, BY DISTRIBUTION CHANNEL
- 8.1 INTRODUCTION
- 8.2 CONSUMER STORES
- 8.2.1 BROAD ACCESSIBILITY, IN-STORE MARKETING, AND SEASONAL PROMOTIONS TO INCREASE SALES IN CONSUMER STORE
- 8.3 RETAIL PHARMACIES & DENTAL DISPENSARIES
- 8.3.1 STRONG CLINICAL ENDORSEMENT AND INCREASED CONSUMER TRUST TO FUEL SALES OF ORAL RINSES
- 8.4 ONLINE DISTRIBUTION
- 8.4.1 RISE IN INTERNET USE, EVOLVED DIGITAL SHOPPING HABITS, AND CONVENIENCE OF DIRECT-TO-DOOR DELIVERY TO DRIVE MARKET
9 ORAL RINSES MARKET, BY REGION
- 9.1 INTRODUCTION
- 9.2 NORTH AMERICA
- 9.2.1 MACROECONOMIC OUTLOOK FOR NORTH AMERICA
- 9.2.2 US
- 9.2.2.1 US to dominate North American oral rinses market during forecast period
- 9.2.3 CANADA
- 9.2.3.1 Better network of dental professionals and robust healthcare infrastructure to propel market growth
- 9.3 EUROPE
- 9.3.1 MACROECONOMIC OUTLOOK FOR EUROPE
- 9.3.2 GERMANY
- 9.3.2.1 High prevalence of edentulism and willingness to invest in advanced personal care products to augment market growth
- 9.3.3 UK
- 9.3.3.1 Rising geriatric population and increasing demand for oral hygiene products to encourage market growth
- 9.3.4 FRANCE
- 9.3.4.1 Persistent burden of dental diseases and favorable government initiatives to spur market growth
- 9.3.5 ITALY
- 9.3.5.1 Aging demographic and prevalence of chronic dental diseases to aid market growth
- 9.3.6 SPAIN
- 9.3.6.1 Strong dental care infrastructure and high focus on quality healthcare to support market growth
- 9.3.7 SWITZERLAND
- 9.3.7.1 Focus on high standard of living to drive popularity of advanced oral hygiene products
- 9.3.8 POLAND
- 9.3.8.1 Strong public healthcare system and wider access to high-quality dental care products to propel market growth
- 9.3.9 REST OF EUROPE
- 9.4 ASIA PACIFIC
- 9.4.1 MACROECONOMIC OUTLOOK FOR ASIA PACIFIC
- 9.4.2 CHINA
- 9.4.2.1 Focus on oral hygiene and high burden of age-related dental conditions to fuel demand for preventive oral care products
- 9.4.3 JAPAN
- 9.4.3.1 Strong dental health awareness and presence of key players to augment market growth
- 9.4.4 INDIA
- 9.4.4.1 Increasing awareness about dental health and growing consumer purchasing power to support market growth
- 9.4.5 AUSTRALIA
- 9.4.5.1 Favorable government initiatives and high incidence of dental diseases to accelerate market growth
- 9.4.6 SOUTH KOREA
- 9.4.6.1 Rising disposable income and increasing demand for advanced dental care solutions to favor market growth
- 9.4.7 REST OF ASIA PACIFIC
- 9.5 LATIN AMERICA
- 9.5.1 MACROECONOMIC OUTLOOK FOR LATIN AMERICA
- 9.5.2 BRAZIL
- 9.5.2.1 High rate of urbanization to sustain demand for quality oral care products
- 9.5.3 MEXICO
- 9.5.3.1 Easy access to modern dental clinics, pharmacies, and e-commerce platforms to aid market growth
- 9.5.4 REST OF LATIN AMERICA
- 9.6 MIDDLE EAST & AFRICA
- 9.6.1 EASY AVAILABILITY OF ORAL CARE PRODUCTS THROUGH URBAN CONVENIENCE STORES AND E-COMMERCE TO DRIVE MARKET
- 9.6.2 MACROECONOMIC OUTLOOK FOR MIDDLE EAST & AFRICA
- 9.7 GCC COUNTRIES
- 9.7.1 INCREASING DEMAND FOR ADAVNCED DENTAL CARE SERVICES TO AUGMENT MARKET GROWTH
- 9.7.2 MACROECONOMIC OUTLOOK FOR GCC COUNTRIES
10 COMPETITIVE LANDSCAPE
- 10.1 INTRODUCTION
- 10.2 KEY PLAYER STRATEGIES/RIGHT TO WIN
- 10.2.1 OVERVIEW OF MAJOR STRATEGIES ADOPTED BY KEY PLAYERS IN ORAL RINSES MARKET
- 10.3 REVENUE ANALYSIS, 2020-2024
- 10.4 MARKET SHARE ANALYSIS, 2024
- 10.5 COMPANY EVALUATION MATRIX: KEY PLAYERS, 2024
- 10.5.1 STARS
- 10.5.2 EMERGING LEADERS
- 10.5.3 PERVASIVE PLAYERS
- 10.5.4 PARTICIPANTS
- 10.5.5 COMPANY FOOTPRINT: KEY PLAYERS, 2024
- 10.5.5.1 Company footprint
- 10.5.5.2 Region footprint
- 10.5.5.3 Product type footprint
- 10.5.5.4 Indication footprint
- 10.6 COMPANY EVALUATION MATRIX: STARTUPS/SMES, 2024
- 10.6.1 PROGRESSIVE COMPANIES
- 10.6.2 RESPONSIVE COMPANIES
- 10.6.3 DYNAMIC COMPANIES
- 10.6.4 STARTING BLOCKS
- 10.6.5 COMPETITIVE BENCHMARKING: STARTUPS/SMES, 2024
- 10.6.5.1 Detailed list of key startups/SMEs
- 10.6.5.2 Competitive benchmarking of key startups/SMEs
- 10.7 COMPANY VALUATION & FINANCIAL METRICS
- 10.7.1 FINANCIAL METRICS
- 10.7.2 COMPANY VALUATION
- 10.8 BRAND/PRODUCT COMPARISON
- 10.9 R&D EXPENDITURE OF KEY PLAYERS
- 10.10 COMPETITIVE SCENARIO
- 10.10.1 PRODUCT LAUNCHES
- 10.10.2 DEALS
- 10.10.3 EXPANSIONS
- 10.10.4 OTHER DEVELOPMENTS
11 COMPANY PROFILES
- 11.1 KEY PLAYERS
- 11.1.1 KENVUE
- 11.1.1.1 Business overview
- 11.1.1.2 Products offered
- 11.1.1.3 Recent developments
- 11.1.1.3.1 Product launches
- 11.1.1.3.2 Deals
- 11.1.1.3.3 Expansions
- 11.1.1.4 MnM view
- 11.1.1.4.1 Right to win
- 11.1.1.4.2 Strategic choices
- 11.1.1.4.3 Weaknesses & competitive threats
- 11.1.2 COLGATE-PALMOLIVE COMPANY
- 11.1.2.1 Business overview
- 11.1.2.2 Products offered
- 11.1.2.3 Recent developments
- 11.1.2.3.1 Product launches
- 11.1.2.3.2 Deals
- 11.1.2.3.3 Other developments
- 11.1.2.4 MnM view
- 11.1.2.4.1 Right to win
- 11.1.2.4.2 Strategic choices
- 11.1.2.4.3 Weaknesses & competitive threats
- 11.1.3 PROCTER & GAMBLE
- 11.1.3.1 Business overview
- 11.1.3.2 Products offered
- 11.1.3.3 Recent developments
- 11.1.3.3.1 Product launches
- 11.1.3.3.2 Deals
- 11.1.3.4 MnM view
- 11.1.3.4.1 Right to win
- 11.1.3.4.2 Strategic choices
- 11.1.3.4.3 Weaknesses & competitive threats
- 11.1.4 HALEON GROUP OF COMPANIES
- 11.1.4.1 Business overview
- 11.1.4.2 Products offered
- 11.1.4.3 Recent developments
- 11.1.4.3.1 Product launches
- 11.1.4.3.2 Deals
- 11.1.4.3.3 Expansions
- 11.1.4.4 MnM view
- 11.1.4.4.1 Right to win
- 11.1.4.4.2 Strategic choices
- 11.1.4.4.3 Weaknesses & competitive threats
- 11.1.5 UNILEVER
- 11.1.5.1 Business overview
- 11.1.5.2 Products offered
- 11.1.5.3 Recent developments
- 11.1.5.3.1 Deals
- 11.1.5.4 MnM view
- 11.1.5.4.1 Right to win
- 11.1.5.4.2 Strategic choices
- 11.1.5.4.3 Weaknesses & competitive threats
- 11.1.6 CHURCH & DWIGHT CO., INC.
- 11.1.6.1 Business overview
- 11.1.6.2 Products offered
- 11.1.6.3 Recent developments
- 11.1.6.3.1 Product launches
- 11.1.6.3.2 Deals
- 11.1.7 LION CORPORATION
- 11.1.7.1 Business overview
- 11.1.7.2 Products offered
- 11.1.7.3 Recent developments
- 11.1.7.3.1 Product launches
- 11.1.7.3.2 Deals
- 11.1.7.3.3 Expansions
- 11.1.8 AMWAY CORP.
- 11.1.8.1 Business overview
- 11.1.8.2 Products offered
- 11.1.9 SUNSTAR SUISSE S.A.
- 11.1.9.1 Business overview
- 11.1.9.2 Products offered
- 11.1.9.3 Recent developments
- 11.1.9.3.1 Product launches
- 11.1.10 PERRIGO COMPANY PLC
- 11.1.10.1 Business overview
- 11.1.10.2 Products offered
- 11.1.10.3 Recent developments
- 11.1.10.3.1 Deals
- 11.1.11 DABUR
- 11.1.11.1 Business overview
- 11.1.11.2 Products offered
- 11.1.11.3 Recent developments
- 11.1.11.3.1 Deals
- 11.1.12 HIMALAYA WELLNESS COMPANY
- 11.1.12.1 Business overview
- 11.1.12.2 Products offered
- 11.1.13 KAO CORPORATION
- 11.1.13.1 Business overview
- 11.1.13.2 Products offered
- 11.1.14 OPELLA HEALTHCARE GROUP SAS
- 11.1.14.1 Business overview
- 11.1.14.2 Products offered
- 11.1.14.3 Recent developments
- 11.1.14.3.1 Deals
- 11.1.15 SMARTMOUTH ORAL HEALTH LABORATORIES
- 11.1.15.1 Business overview
- 11.1.15.2 Products offered
- 11.1.15.3 Recent developments
- 11.1.15.3.1 Product launches
- 11.1.1 KENVUE
- 11.2 OTHER PLAYERS
- 11.2.1 DENTAID
- 11.2.2 CLOSYS
- 11.2.3 SCANDERRA GMBH
- 11.2.4 PEARLIE WHITE
- 11.2.5 WILD
- 11.2.6 BOKA
- 11.2.7 PERFORA
- 11.2.8 SALT ORAL CARE
- 11.2.9 ORABIO
- 11.2.10 LUMINEUX
12 APPENDIX
- 12.1 DISCUSSION GUIDE
- 12.2 KNOWLEDGESTORE: MARKETSANDMARKETS' SUBSCRIPTION PORTAL
- 12.3 CUSTOMIZATION OPTIONS
- 12.4 RELATED REPORTS
- 12.5 AUTHOR DETAILS
List of Tables
- TABLE 1 ORAL RINSES MARKET: INCLUSIONS & EXCLUSIONS
- TABLE 2 STANDARD CURRENCY CONVERSION RATES
- TABLE 3 ORAL RINSES MARKET: STUDY ASSUMPTIONS
- TABLE 4 ORAL RINSES MARKET: RISK ANALYSIS
- TABLE 5 AVERAGE SELLING PRICE TREND OF ORAL RINSES, BY KEY PLAYER, 2022-2024 (USD)
- TABLE 6 AVERAGE SELLING PRICE TREND OF ORAL RINSES, BY REGION, 2022-2024 (USD)
- TABLE 7 ORAL RINSES MARKET: ROLE IN ECOSYSTEM
- TABLE 8 ORAL RINSES MARKET: PORTER'S FIVE FORCES
- TABLE 9 INFLUENCE OF KEY STAKEHOLDERS ON BUYING PROCESS, BY DISTRIBUTION CHANNEL
- TABLE 10 KEY BUYING CRITERIA FOR MAJOR DISTRIBUTION CHANNELS
- TABLE 11 IMPORT DATA FOR HS CODE 330690, BY COUNTRY, 2020-2024 (USD THOUSAND)
- TABLE 12 EXPORT DATA FOR HS CODE 330690, BY COUNTRY, 2020-2024 (USD THOUSAND)
- TABLE 13 NORTH AMERICA: REGULATORY BODIES, GOVERNMENT AGENCIES, AND OTHER ORGANIZATIONS
- TABLE 14 EUROPE: REGULATORY BODIES, GOVERNMENT AGENCIES, AND OTHER ORGANIZATIONS
- TABLE 15 ASIA PACIFIC: REGULATORY BODIES, GOVERNMENT AGENCIES, AND OTHER ORGANIZATIONS
- TABLE 16 LATIN AMERICA: REGULATORY BODIES, GOVERNMENT AGENCIES, AND OTHER ORGANIZATIONS
- TABLE 17 MIDDLE EAST & AFRICA: REGULATORY BODIES, GOVERNMENT AGENCIES, AND OTHER ORGANIZATIONS
- TABLE 18 ORAL RINSES MARKET: LIST OF MAJOR PATENTS, 2022-2024
- TABLE 19 ORAL RINSES MARKET: DETAILED LIST OF KEY CONFERENCES & EVENTS, JANUARY 2025-DECEMBER 2026
- TABLE 20 ORAL RINSES MARKET: UNMET NEEDS
- TABLE 21 ORAL RINSES MARKET: END-USER EXPECTATIONS
- TABLE 22 CASE STUDY 1: CAPHOSOL ORAL RINSE TO EFFECTIVELY MANAGE CHEMOTHERAPY-INDUCED ORAL MUCOSITIS
- TABLE 23 CASE STUDY 2: ANTISPETIC MOUTHWASHES TO PREVENT VENTILATOR-ASSOCIATED PNEUMONIA (VAP) AMONG MECHANICALLY VENTILATED PATIENTS
- TABLE 24 CASE STUDY 3: HERBAL MOUTHRINSE TO BE EFFECIVE FOR CHLORHEXIDINE WITHOUT ADVERSE EFFECTS
- TABLE 25 US-ADJUSTED RECIPROCAL TARIFF RATES
- TABLE 26 KEY PRODUCT-RELATED TARIFFS EFFECTIVE FOR ORAL CARE PRODUCTS
- TABLE 27 ORAL RINSES MARKET, BY PRODUCT TYPE, 2023-2030 (USD MILLION)
- TABLE 28 ORAL RINSES MARKET, BY PRODUCT TYPE, 2023-2030 (MILLION UNITS)
- TABLE 29 THERAPEUTIC ORAL RINSES MARKET, BY COUNTRY, 2023-2030 (USD MILLION)
- TABLE 30 COSMETIC ORAL RINSES MARKET, BY COUNTRY, 2023-2030 (USD MILLION)
- TABLE 31 OTHER ORAL RINSES MARKET, BY COUNTRY, 2023-2030 (USD MILLION)
- TABLE 32 ORAL RINSES MARKET, BY INDICATION, 2023-2030 (USD MILLION)
- TABLE 33 ORAL RINSES MARKET FOR GENERAL ORAL HEALTH, BY COUNTRY, 2023-2030 (USD MILLION)
- TABLE 34 ORAL RINSES MARKET FOR GINGIVITIS & PERIODONTAL DISEASES, BY COUNTRY, 2023-2030 (USD MILLION)
- TABLE 35 ORAL RINSES MARKET FOR HALITOSIS, BY COUNTRY, 2023-2030 (USD MILLION)
- TABLE 36 ORAL RINSES MARKET FOR DRY MOUTH, BY COUNTRY, 2023-2030 (USD MILLION)
- TABLE 37 ORAL RINSES MARKET FOR OTHER INDICATIONS, BY COUNTRY, 2023-2030 (USD MILLION)
- TABLE 38 ORAL RINSES MARKET, BY DISTRIBUTION CHANNEL, 2023-2030 (USD MILLION)
- TABLE 39 ORAL RINSES MARKET FOR CONSUMER STORES, BY COUNTRY, 2023-2030 (USD MILLION)
- TABLE 40 ORAL RINSES MARKET FOR RETAIL PHARMACIES & DENTAL DISPENSARIES, BY COUNTRY, 2023-2030 (USD MILLION)
- TABLE 41 ORAL RINSES MARKET FOR ONLINE DISTRIBUTION, BY COUNTRY, 2023-2030 (USD MILLION)
- TABLE 42 ORAL RINSES MARKET, BY REGION, 2023-2030 (USD MILLION)
- TABLE 43 NORTH AMERICA: ORAL RINSES MARKET, BY COUNTRY, 2023-2030 (USD MILLION)
- TABLE 44 NORTH AMERICA: ORAL RINSES MARKET, BY PRODUCT TYPE, 2023-2030 (USD MILLION)
- TABLE 45 NORTH AMERICA: ORAL RINSES MARKET, BY INDICATION, 2023-2030 (USD MILLION)
- TABLE 46 NORTH AMERICA: ORAL RINSES MARKET, BY DISTRIBUTION CHANNEL, 2023-2030 (USD MILLION)
- TABLE 47 US: KEY MACROINDICATORS
- TABLE 48 US: ORAL RINSES MARKET, BY PRODUCT TYPE, 2023-2030 (USD MILLION)
- TABLE 49 US: ORAL RINSES MARKET, BY INDICATION, 2023-2030 (USD MILLION)
- TABLE 50 US: ORAL RINSES MARKET, BY DISTRIBUTION CHANNEL, 2023-2030 (USD MILLION)
- TABLE 51 CANADA: KEY MACROINDICATORS
- TABLE 52 CANADA: ORAL RINSES MARKET, BY PRODUCT TYPE , 2023-2030 (USD MILLION)
- TABLE 53 CANADA: ORAL RINSES MARKET, BY INDICATION, 2023-2030 (USD MILLION)
- TABLE 54 CANADA: ORAL RINSES MARKET, BY DISTRIBUTION CHANNEL, 2023-2030 (USD MILLION)
- TABLE 55 EUROPE: ORAL RINSES MARKET, BY COUNTRY, 2023-2030 (USD MILLION)
- TABLE 56 EUROPE: ORAL RINSES MARKET, BY PRODUCT TYPE, 2023-2030 (USD MILLION)
- TABLE 57 EUROPE: ORAL RINSES MARKET, BY INDICATION, 2023-2030 (USD MILLION)
- TABLE 58 EUROPE: ORAL RINSES MARKET, BY DISTRIBUTION CHANNEL, 2023-2030 (USD MILLION)
- TABLE 59 GERMANY: KEY MACROINDICATORS
- TABLE 60 GERMANY: ORAL RINSES MARKET, BY PRODUCT TYPE, 2023-2030 (USD MILLION)
- TABLE 61 GERMANY: ORAL RINSES MARKET, BY INDICATION, 2023-2030 (USD MILLION)
- TABLE 62 GERMANY: ORAL RINSES MARKET, BY DISTRIBUTION CHANNEL, 2023-2030 (USD MILLION)
- TABLE 63 UK: KEY MACROINDICATORS
- TABLE 64 UK: ORAL RINSES MARKET, BY PRODUCT TYPE, 2023-2030 (USD MILLION)
- TABLE 65 UK: ORAL RINSES MARKET, BY INDICATION, 2023-2030 (USD MILLION)
- TABLE 66 UK: ORAL RINSES MARKET, BY DISTRIBUTION CHANNEL, 2023-2030 (USD MILLION)
- TABLE 67 FRANCE: KEY MACROINDICATORS
- TABLE 68 FRANCE: ORAL RINSES MARKET, BY PRODUCT TYPE, 2023-2030 (USD MILLION)
- TABLE 69 FRANCE: ORAL RINSES MARKET, BY INDICATION, 2023-2030 (USD MILLION)
- TABLE 70 FRANCE: ORAL RINSES MARKET, BY DISTRIBUTION CHANNEL, 2023-2030 (USD MILLION)
- TABLE 71 ITALY: KEY MACROINDICATORS
- TABLE 72 ITALY: ORAL RINSES MARKET, BY PRODUCT TYPE, 2023-2030 (USD MILLION)
- TABLE 73 ITALY: ORAL RINSES MARKET, BY INDICATION, 2023-2030 (USD MILLION)
- TABLE 74 ITALY: ORAL RINSES MARKET, BY DISTRIBUTION CHANNEL, 2023-2030 (USD MILLION)
- TABLE 75 SPAIN: KEY MACROINDICATORS
- TABLE 76 SPAIN: ORAL RINSES MARKET, BY PRODUCT TYPE, 2023-2030 (USD MILLION)
- TABLE 77 SPAIN: ORAL RINSES MARKET, BY INDICATION, 2023-2030 (USD MILLION)
- TABLE 78 SPAIN: ORAL RINSES MARKET, BY DISTRIBUTION CHANNEL, 2023-2030 (USD MILLION)
- TABLE 79 SWITZERLAND: KEY MACROINDICATORS
- TABLE 80 SWITZERLAND: ORAL RINSES MARKET, BY PRODUCT TYPE, 2023-2030 (USD MILLION)
- TABLE 81 SWITZERLAND: ORAL RINSES MARKET, BY INDICATION, 2023-2030 (USD MILLION)
- TABLE 82 SWITZERLAND: ORAL RINSES MARKET, BY DISTRIBUTION CHANNEL, 2023-2030 (USD MILLION)
- TABLE 83 POLAND: KEY MACROINDICATORS
- TABLE 84 POLAND: ORAL RINSES MARKET, BY PRODUCT TYPE, 2023-2030 (USD MILLION)
- TABLE 85 POLAND: ORAL RINSES MARKET, BY INDICATION, 2023-2030 (USD MILLION)
- TABLE 86 POLAND: ORAL RINSES MARKET, BY DISTRIBUTION CHANNEL, 2023-2030 (USD MILLION)
- TABLE 87 REST OF EUROPE: ORAL RINSES MARKET, BY PRODUCT TYPE, 2023-2030 (USD MILLION)
- TABLE 88 REST OF EUROPE: ORAL RINSES MARKET, BY INDICATION, 2023-2030 (USD MILLION)
- TABLE 89 REST OF EUROPE: ORAL RINSES MARKET, BY DISTRIBUTION CHANNEL, 2023-2030 (USD MILLION)
- TABLE 90 ASIA PACIFIC: ORAL RINSES MARKET, BY COUNTRY, 2023-2030 (USD MILLION)
- TABLE 91 ASIA PACIFIC: ORAL RINSES MARKET, BY PRODUCT TYPE, 2023-2030 (USD MILLION)
- TABLE 92 ASIA PACIFIC: ORAL RINSES MARKET, BY INDICATION, 2023-2030 (USD MILLION)
- TABLE 93 ASIA PACIFIC: ORAL RINSES MARKET, BY DISTRIBUTION CHANNEL, 2023-2030 (USD MILLION)
- TABLE 94 CHINA: KEY MACROINDICATORS
- TABLE 95 CHINA: ORAL RINSES MARKET, BY PRODUCT TYPE, 2023-2030 (USD MILLION)
- TABLE 96 CHINA: ORAL RINSES MARKET, BY INDICATION, 2023-2030 (USD MILLION)
- TABLE 97 CHINA: ORAL RINSES MARKET, BY DISTRIBUTION CHANNEL, 2023-2030 (USD MILLION)
- TABLE 98 JAPAN: KEY MACROINDICATORS
- TABLE 99 JAPAN: ORAL RINSES MARKET, BY PRODUCT TYPE, 2023-2030 (USD MILLION)
- TABLE 100 JAPAN: ORAL RINSES MARKET, BY INDICATION, 2023-2030 (USD MILLION)
- TABLE 101 JAPAN: ORAL RINSES MARKET, BY DISTRIBUTION CHANNEL, 2023-2030 (USD MILLION)
- TABLE 102 INDIA: KEY MACROINDICATORS
- TABLE 103 INDIA: ORAL RINSES MARKET, BY PRODUCT TYPE, 2023-2030 (USD MILLION)
- TABLE 104 INDIA: ORAL RINSES MARKET, BY INDICATION, 2023-2030 (USD MILLION)
- TABLE 105 INDIA: ORAL RINSES MARKET, BY DISTRIBUTION CHANNEL, 2023-2030 (USD MILLION)
- TABLE 106 AUSTRALIA: KEY MACROINDICATORS
- TABLE 107 AUSTRALIA: ORAL RINSES MARKET, BY PRODUCT TYPE, 2023-2030 (USD MILLION)
- TABLE 108 AUSTRALIA: ORAL RINSES MARKET, BY INDICATION, 2023-2030 (USD MILLION)
- TABLE 109 AUSTRALIA: ORAL RINSES MARKET, BY DISTRIBUTION CHANNEL, 2023-2030 (USD MILLION)
- TABLE 110 SOUTH KOREA: KEY MACROINDICATORS
- TABLE 111 SOUTH KOREA: ORAL RINSES MARKET, BY PRODUCT TYPE, 2023-2030 (USD MILLION)
- TABLE 112 SOUTH KOREA: ORAL RINSES MARKET, BY INDICATION, 2023-2030 (USD MILLION)
- TABLE 113 SOUTH KOREA: ORAL RINSES MARKET, BY DISTRIBUTION CHANNEL, 2023-2030 (USD MILLION)
- TABLE 114 REST OF ASIA PACIFIC: ORAL RINSES MARKET, BY PRODUCT TYPE, 2023-2030 (USD MILLION)
- TABLE 115 REST OF ASIA PACIFIC: ORAL RINSES MARKET, BY INDICATION, 2023-2030 (USD MILLION)
- TABLE 116 REST OF ASIA PACIFIC: ORAL RINSES MARKET, BY DISTRIBUTION CHANNEL, 2023-2030 (USD MILLION)
- TABLE 117 LATIN AMERICA: ORAL RINSES MARKET, BY COUNTRY, 2023-2030 (USD MILLION)
- TABLE 118 LATIN AMERICA: ORAL RINSES MARKET, BY PRODUCT TYPE, 2023-2030 (USD MILLION)
- TABLE 119 LATIN AMERICA: ORAL RINSES MARKET, BY INDICATION, 2023-2030 (USD MILLION)
- TABLE 120 LATIN AMERICA: ORAL RINSES MARKET, BY DISTRIBUTION CHANNEL, 2023-2030 (USD MILLION)
- TABLE 121 BRAZIL: KEY MACROINDICATORS
- TABLE 122 BRAZIL: ORAL RINSES MARKET, BY PRODUCT TYPE, 2023-2030 (USD MILLION)
- TABLE 123 BRAZIL: ORAL RINSES MARKET, BY INDICATION, 2023-2030 (USD MILLION)
- TABLE 124 BRAZIL: ORAL RINSES MARKET, BY DISTRIBUTION CHANNEL, 2023-2030 (USD MILLION)
- TABLE 125 MEXICO: KEY MACROINDICATORS
- TABLE 126 MEXICO: ORAL RINSES MARKET, BY PRODUCT TYPE, 2023-2030 (USD MILLION)
- TABLE 127 MEXICO: ORAL RINSES MARKET, BY INDICATION, 2023-2030 (USD MILLION)
- TABLE 128 MEXICO: ORAL RINSES MARKET, BY DISTRIBUTION CHANNEL, 2023-2030 (USD MILLION)
- TABLE 129 REST OF LATIN AMERICA: ORAL RINSES MARKET, BY PRODUCT TYPE, 2023-2030 (USD MILLION)
- TABLE 130 REST OF LATIN AMERICA: ORAL RINSES MARKET, BY INDICATION, 2023-2030 (USD MILLION)
- TABLE 131 REST OF LATIN AMERICA: ORAL RINSES MARKET, BY DISTRIBUTION CHANNEL, 2023-2030 (USD MILLION)
- TABLE 132 MIDDLE EAST & AFRICA: ORAL RINSES MARKET, BY PRODUCT TYPE, 2023-2030 (USD MILLION)
- TABLE 133 MIDDLE EAST & AFRICA: ORAL RINSES MARKET, BY INDICATION, 2023-2030 (USD MILLION)
- TABLE 134 MIDDLE EAST & AFRICA: ORAL RINSES MARKET, BY DISTRIBUTION CHANNEL, 2023-2030 (USD MILLION)
- TABLE 135 GCC COUNTRIES: ORAL RINSES MARKET, BY PRODUCT TYPE, 2023-2030 (USD MILLION)
- TABLE 136 GCC COUNTRIES: ORAL RINSES MARKET, BY INDICATION, 2023-2030 (USD MILLION)
- TABLE 137 GCC COUNTRIES: ORAL RINSES MARKET, BY DISTRIBUTION CHANNEL, 2023-2030 (USD MILLION)
- TABLE 138 MAJOR STRATEGIES DEPLOYED BY KEY PLAYERS IN ORAL RINSES MARKET, JANUARY 2022-JUNE 2025
- TABLE 139 ORLA RINSES MARKET: DEGREE OF COMPETITION
- TABLE 140 ORAL RINSES MARKET: REGION FOOTPRINT
- TABLE 141 ORAL RINSES MARKET: PRODUCT TYPE FOOTPRINT
- TABLE 142 ORAL RINSES MARKET: INDICATION FOOTPRINT
- TABLE 143 ORAL RINSES MARKET: DETAILED LIST OF KEY STARTUPS/SME PLAYERS
- TABLE 144 ORAL RINSES MARKET: COMPETITIVE BENCHMARKING OF KEY STARTUPS/SME PLAYERS, BY PRODUCT TYPE AND REGION
- TABLE 145 ORAL RINSES MARKET: PRODUCT LAUNCHES, JANUARY 2022-JUNE 2025
- TABLE 146 ORAL RINSES MARKET: DEALS, JANUARY 2022-JUNE 2025
- TABLE 147 ORAL RINSES MARKET: EXPANSIONS, JANUARY 2022-JUNE 2025
- TABLE 148 ORAL RINSES MARKET: OTHER DEVELOPMENTS, JANUARY 2022-JUNE 2025
- TABLE 149 KENVUE: COMPANY OVERVIEW
- TABLE 150 KENVUE: PRODUCTS OFFERED
- TABLE 151 KENVUE: PRODUCT LAUNCHES, JANUARY 2022-JUNE 2025
- TABLE 152 KENVUE: DEALS, JANUARY 2022-JUNE 2025
- TABLE 153 KENVUE: EXPANSIONS, JANUARY 2022-JUNE 2025
- TABLE 154 COLGATE-PALMOLIVE COMPANY: COMPANY OVERVIEW
- TABLE 155 COLGATE-PALMOLIVE COMPANY: PRODUCTS OFFERED
- TABLE 156 COLGATE-PALMOLIVE COMPANY: PRODUCT LAUNCHES, JANUARY 2022-JUNE 2025
- TABLE 157 COLGATE-PALMOLIVE COMPANY: DEALS, JANUARY 2022-JUNE 2025
- TABLE 158 COLGATE-PALMOLIVE COMPANY: OTHER DEVELOPMENTS, JANUARY 2022-JUNE 2025
- TABLE 159 PROCTER & GAMBLE: COMPANY OVERVIEW
- TABLE 160 PROCTER & GAMBLE: PRODUCTS OFFERED
- TABLE 161 PROCTER & GAMBLE: PRODUCT LAUNCHES, JANUARY 2022-JUNE 2025
- TABLE 162 PROCTER & GAMBLE: DEALS, JANUARY 2022-JUNE 2025
- TABLE 163 HALEON GROUP OF COMPANIES: COMPANY OVERVIEW
- TABLE 164 HALEON GROUP OF COMPANIES: PRODUCTS OFFERED
- TABLE 165 HALEON GROUP OF COMPANIES: PRODUCT LAUNCHES, JANUARY 2022-JUNE 2025
- TABLE 166 HALEON GROUP OF COMPANIES: DEALS, JANUARY 2022-JUNE 2025
- TABLE 167 HALEON GROUP OF COMPANIES: EXPANSIONS, JANUARY 2022-JUNE 2025
- TABLE 168 UNILEVER: COMPANY OVERVIEW
- TABLE 169 UNILEVER: PRODUCTS OFFERED
- TABLE 170 UNILEVER: DEALS, JANUARY 2022-JUNE 2025
- TABLE 171 CHURCH & DWIGHT CO., INC.: COMPANY OVERVIEW
- TABLE 172 CHURCH & DWIGHT CO., INC.: PRODUCTS OFFERED
- TABLE 173 CHURCH & DWIGHT CO., INC.: PRODUCT LAUNCHES, JANUARY 2022-JUNE 2025
- TABLE 174 CHURCH & DWIGHT CO., INC.: DEALS, JANUARY 2022-JUNE 2025
- TABLE 175 LION CORPORATION: COMPANY OVERVIEW
- TABLE 176 LION CORPORATION: PRODUCTS OFFERED
- TABLE 177 LION CORPORATION: PRODUCT LAUNCHES, JANUARY 2022-JUNE 2025
- TABLE 178 LION CORPORATION: DEALS, JANUARY 2022-JUNE 2025
- TABLE 179 LION CORPORATION: EXPANSIONS, JANUARY 2022-JUNE 2025
- TABLE 180 AMWAY CORP.: COMPANY OVERVIEW
- TABLE 181 AMWAY CORP.: PRODUCTS OFFERED
- TABLE 182 SUNSTAR SUISSE S.A.: COMPANY OVERVIEW
- TABLE 183 SUNSTAR SUISSE S.A.: PRODUCTS OFFERED
- TABLE 184 SUNSTAR SUISSE S.A.: PRODUCT LAUNCHES, JANUARY 2022-JUNE 2025
- TABLE 185 PERRIGO COMPANY PLC: COMPANY OVERVIEW
- TABLE 186 PERRIGO COMPANY PLC: PRODUCTS OFFERED
- TABLE 187 PERRIGO COMPANY PLC: DEALS, JANUARY 2022-JUNE 2025
- TABLE 188 DABUR: COMPANY OVERVIEW
- TABLE 189 DABUR: PRODUCTS OFFERED
- TABLE 190 DABUR: DEALS, JANUARY 2022-JUNE 2025
- TABLE 191 HIMALAYA WELLNESS COMPANY: COMPANY OVERVIEW
- TABLE 192 HIMALAYA WELLNESS COMPANY: PRODUCTS OFFERED
- TABLE 193 KAO CORPORATION: COMPANY OVERVIEW
- TABLE 194 KAO CORPORATION: PRODUCTS OFFERED
- TABLE 195 OPELLA HEALTHCARE GROUP SAS: COMPANY OVERVIEW
- TABLE 196 OPELLA HEALTHCARE GROUP SAS: PRODUCTS OFFERED
- TABLE 197 OPELLA HEALTHCARE GROUP SAS: DEALS, JANUARY 2022-JUNE 2025
- TABLE 198 SMARTMOUTH ORAL HEALTH LABORATORIES: COMPANY OVERVIEW
- TABLE 199 SMARTMOUTH ORAL HEALTH LABORATORIES: PRODUCTS OFFERED
- TABLE 200 SMARTMOUTH ORAL HEALTH LABORATORIES: PRODUCT LAUNCHES, JANUARY 2022-JUNE 2025
- TABLE 201 DENTAID: COMPANY OVERVIEW
- TABLE 202 CLOSYS: COMPANY OVERVIEW
- TABLE 203 SCANDERRA GMBH: COMPANY OVERVIEW
- TABLE 204 PEARLIE WHITE: COMPANY OVERVIEW
- TABLE 205 WILD: COMPANY OVERVIEW
- TABLE 206 BOKA: COMPANY OVERVIEW
- TABLE 207 PERFORA: COMPANY OVERVIEW
- TABLE 208 SALT ORAL CARE: COMPANY OVERVIEW
- TABLE 209 ORABIO: COMPANY OVERVIEW
- TABLE 210 LUMINEUX: COMPANY OVERVIEW
List of Figures
- FIGURE 1 ORAL RINSES MARKET SEGMENTATION & REGIONAL SCOPE
- FIGURE 2 ORAL RINSES MARKET: YEARS CONSIDERED
- FIGURE 3 ORAL RINSES MARKET: RESEARCH DESIGN
- FIGURE 4 ORAL RINSES MARKET: KEY DATA FROM SECONDARY SOURCES
- FIGURE 5 ORAL RINSES MARKET: KEY PRIMARY DATA SOURCES
- FIGURE 6 ORAL RINSES MARKET: KEY DATA FROM PRIMARY SOURCES
- FIGURE 7 ORAL RINSES MARKET: KEY INSIGHTS FROM INDUSTRY EXPERTS
- FIGURE 8 BREAKDOWN OF PRIMARY INTERVIEWS: SUPPLY- AND DEMAND-SIDE PARTICIPANTS
- FIGURE 9 BREAKDOWN OF PRIMARY INTERVIEWS: BY COMPANY TYPE, DESIGNATION, AND REGION
- FIGURE 10 ORAL RINSES SIZE ESTIMATION: REVENUE SHARE ANALYSIS (2024)
- FIGURE 11 REVENUE SHARE ANALYSIS FOR HALEON GROUP OF COMPANIES (2024)
- FIGURE 12 ORAL RINSES MARKET: SUPPLY-SIDE ANALYSIS (2024)
- FIGURE 13 ORAL RINSES MARKET: CAGR PROJECTIONS (SUPPLY-SIDE ANALYSIS)
- FIGURE 14 ORAL RINSES MARKET: BOTTOM-UP APPROACH (SUPPLY-SIDE ANALYSIS)
- FIGURE 15 CAGR PROJECTIONS FROM ANALYSIS OF DRIVERS, RESTRAINTS, OPPORTUNITIES, AND CHALLENGES (2025-2030)
- FIGURE 16 ORAL RINSES MARKET: TOP-DOWN APPROACH
- FIGURE 17 ORAL RINSES MARKET: DATA TRIANGULATION METHODOLOGY
- FIGURE 20 ORAL RINSES MARKET, BY DISTRIBUTION CHANNEL, 2025 VS. 2030 (USD MILLION)
- FIGURE 21 ORAL RINSES MARKET: REGIONAL SNAPSHOT
- FIGURE 22 RISING AWARENESS OF PREVENTIVE DENTAL CARE AND ORAL HYGIENE TO DRIVE MARKET
- FIGURE 23 JAPAN AND THERAPEUTIC RINSES ACCOUNTED FOR LARGEST ASIA PACIFIC ORAL RINSES MARKET SHARE IN 2024
- FIGURE 24 INDIA TO GROW AT HIGHEST CAGR DURING STUDY PERIOD
- FIGURE 25 NORTH AMERICA TO COMMAND LARGEST MARKET SHARE DURING FORECAST PERIOD
- FIGURE 26 EMERGING MARKETS TO REGISTER HIGHER GROWTH RATES FROM 2025 TO 2030
- FIGURE 27 ORAL RINSES MARKET: DRIVERS, RESTRAINTS, OPPORTUNITIES, AND CHALLENGES
- FIGURE 28 ORAL RINSES MARKET: ECOSYSTEM ANALYSIS
- FIGURE 29 ORAL RINSES MARKET: VALUE CHAIN ANALYSIS
- FIGURE 30 ORAL RINSES MARKET: PORTER'S FIVE FORCES ANALYSIS
- FIGURE 31 INFLUENCE OF KEY STAKEHOLDERS ON BUYING PROCESS, BY DISTRIBUTION CHANNEL
- FIGURE 32 KEY BUYING CRITERIA FOR MAJOR DISTRIBUTION CHANNELS
- FIGURE 33 ORAL RINSES MARKET: SUPPLY CHAIN ANALYSIS
- FIGURE 34 TOP PATENT APPLICANTS/OWNERS (COMPANIES/INSTITUTES) FOR ORAL RINSES MARKET (JANUARY 2014-DECEMBER 2024)
- FIGURE 35 TOP PATENT APPLICANT COUNTRIES FOR ORAL RINSES MARKET (JANUARY 2014-DECEMBER 2024)
- FIGURE 36 MARKETS ADJACENT TO ORAL RINSES MARKET
- FIGURE 37 ORAL RINSES MARKET: TRENDS/DISRUPTIONS IMPACTING CUSTOMERS' BUSINESSES
- FIGURE 38 ORAL RINSES MARKET: FUNDING AND NUMBER OF DEALS, 2019-2023
- FIGURE 39 ORAL RINSES MARKET: GEOGRAPHICAL GROWTH OPPORTUNITIES
- FIGURE 40 NORTH AMERICA: ORAL RINSES MARKET SNAPSHOT
- FIGURE 41 ASIA PACIFIC: ORAL RINSES MARKET SNAPSHOT
- FIGURE 42 REVENUE SHARE ANALYSIS OF KEY PLAYERS IN ORAL RINSES MARKET (2020-2024)
- FIGURE 43 MARKET SHARE ANALYSIS OF KEY PLAYERS IN ORAL RINSES MARKET (2024)
- FIGURE 44 ORAL RINSES MARKET: COMPANY EVALUATION MATRIX (KEY PLAYERS), 2024
- FIGURE 45 ORAL RINSES MARKET: COMPANY FOOTPRINT
- FIGURE 46 ORAL RINSES MARKET: COMPANY EVALUATION MATRIX (STARTUPS/SMES), 2024
- FIGURE 47 EV/EBITDA OF KEY VENDORS
- FIGURE 48 YEAR-TO-DATE (YTD) PRICE TOTAL RETURN AND 5-YEAR STOCK BETA OF KEY VENDORS
- FIGURE 49 ORAL RINSES MARKET: BRAND/PRODUCT COMPARATIVE ANALYSIS
- FIGURE 50 ORAL RINSES MARKET: R&D EXPENDITURE OF KEY PLAYERS (2022-2024)
- FIGURE 51 KENVUE: COMPANY SNAPSHOT
- FIGURE 52 COLGATE-PALMOLIVE COMPANY: COMPANY SNAPSHOT
- FIGURE 53 PROCTER & GAMBLE: COMPANY SNAPSHOT
- FIGURE 54 HALEON GROUP OF COMPANIES: COMPANY SNAPSHOT
- FIGURE 55 UNILEVER: COMPANY SNAPSHOT
- FIGURE 56 CHURCH & DWIGHT CO., INC.: COMPANY SNAPSHOT
- FIGURE 57 LION CORPORATION: COMPANY SNAPSHOT
- FIGURE 58 AMWAY CORP.: COMPANY SNAPSHOT
- FIGURE 59 SUNSTAR SUISSE S.A.: COMPANY SNAPSHOT
- FIGURE 60 PERRIGO COMPANY PLC: COMPANY SNAPSHOT
- FIGURE 61 DABUR: COMPANY SNAPSHOT
- FIGURE 62 KAO CORPORATION: COMPANY SNAPSHOT

