
PUBLISHER: MarketsandMarkets | PRODUCT CODE: 1869550
PUBLISHER: MarketsandMarkets | PRODUCT CODE: 1869550
Security Solutions Market by System (Fire Protection, Video Surveillance, Multi-technology Reader, Biometric Reader, Electronic Lock, Entrance Control, Intruder Alarm, Thermal Imaging), Service (Remote Monitoring, VSaaS, ACaaS) - Global Forecast to 2030
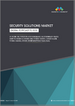
The global security solutions market is projected to grow from USD 370.15 billion in 2025 to USD 523.98 billion by 2030, at a CAGR of 7.2%. The rapid adoption of AI-powered surveillance and biometric access control is fueling growth by significantly enhancing the accuracy, efficiency, and reliability of security systems. AI enables real-time video analytics, facial recognition, and behavior detection, allowing for quicker threat identification and response while reducing false alarms. Biometric access control, using fingerprint, iris, or facial scans, offers highly secure and convenient authentication methods that are difficult to forge or bypass.
| Scope of the Report | |
|---|---|
| Years Considered for the Study | 2021-2030 |
| Base Year | 2024 |
| Forecast Period | 2025-2030 |
| Units Considered | Value (USD Billion) |
| Segments | By System, Services, Vertical and Region |
| Regions covered | North America, Europe, APAC, RoW |
Together, these technologies provide smarter, automated security solutions that meet the growing demand for advanced protection in both commercial and residential settings, driving widespread adoption and expanding the overall market.
"Video Surveillance service to grow at the fastest rate during the forecasted period"
Video surveillance services are growing fastest due to their ability to provide continuous, real-time monitoring and enhanced security across various sectors. Cloud-based platforms enable remote access, easy scalability, and lower upfront costs, making these services accessible to both businesses and homeowners. Advanced technologies, such as AI-driven analytics, facial recognition, and automated alerts, improve the accuracy of threat detection and reduce false alarms, leading to faster responses. Increasing regulatory requirements and the need for reliable evidence in investigations also drive demand for these services. Moreover, the rise of subscription-based and managed video surveillance models offers cost-effective solutions that require minimal initial investment, appealing to organizations of all sizes. As concerns about safety and asset protection continue to rise, video surveillance services offer a flexible, efficient, and scalable way to monitor and secure properties, contributing to their rapid growth in the security market.
"Commercial segment to grow at the fastest rate during the forecasted period. "
The commercial segment is experiencing the fastest growth in security solutions due to heightened concerns about safeguarding employees, sensitive data, and valuable assets. Offices require advanced security measures such as access control, video surveillance, and intrusion detection to prevent unauthorized access and maintain a safe working environment. Increasing regulatory requirements and industry compliance standards further compel businesses to invest in comprehensive security systems. The rise of smart buildings and IoT integration allows offices to implement more efficient, automated security solutions that can be monitored remotely, supporting multi-location operations. Additionally, the growth of sectors like retail, healthcare, finance, and logistics-where office spaces are critical-drives demand for scalable and customizable security technologies. As organizations prioritize risk management and business continuity, the commercial segment continues to adopt innovative and integrated security solutions, fueling its rapid expansion within the overall security market.
"US is expected to hold the most prominent market share in North America during the forecast period."
The US dominates the North American security solutions market due to its advanced technological infrastructure, high security awareness, and substantial investments across various sectors. The country hosts many leading security companies that drive innovation in access control, video surveillance, and integrated security systems. Strict regulatory frameworks and compliance requirements in industries like finance, healthcare, and government also push organizations to adopt robust security measures. Additionally, widespread urbanization, a large commercial real estate sector, and the increasing focus on workplace and residential safety contribute to strong demand. The US market's early adoption of emerging technologies such as AI, cloud-based solutions, and biometrics further strengthens its leadership position in the region's security solutions landscape.
In-depth interviews have been conducted with chief executive officers (CEOs), directors, and other executives from various key organizations operating in the security solutions marketplace.
- By Company Type: Tier 1 - 40%, Tier 2 - 35%, and Tier 3 - 25%
- By Designation: C-level Executives - 45%, Directors - 35%, and Others - 20%
- By Region: North America - 45%, Europe - 25%, Asia Pacific - 20%, and RoW - 10%
The study includes an in-depth competitive analysis of these key players in the security solutions market, with their company profiles, recent developments, and key market strategies.
Research Coverage
This research report categorizes the security solutions market by system, services, vertical, and region (North America, Europe, Asia Pacific, RoW). The report covers detailed information regarding major factors influencing market growth, such as drivers, restraints, challenges, and opportunities. A thorough analysis of the key industry players has provided insights into their business overview, solutions and services, key strategies, contracts, partnerships, and agreements. Product and service launches, acquisitions, and recent developments associated with the security solutions market. This report covers a competitive analysis of upcoming startups in the security solutions market ecosystem.
Reasons to Buy This Report
The report will help market leaders and new entrants with information on the closest approximations of the revenue numbers for the security solutions market and subsegments. It will also help stakeholders understand the competitive landscape and gain more insights to position their businesses better and plan suitable go-to-market strategies. The report also helps stakeholders understand the market pulse and provides information on key market drivers, restraints, challenges, and opportunities.
The report provides insights on the following pointers:
- Analysis of key drivers (Increasing concerns regarding public safety and infrastructure protection, rapid adoption of AI-powered surveillance and biometric access control is redefining global security standards, rising incidents of theft, vandalism, and unauthorized access, expansion of smart infrastructure and smart city projects globally, modernization of physical security and access control systems), restraints (Concerns over privacy and data protection regulations, risk of system vulnerabilities and exploits, complexity in integration with existing infrastructure), opportunities (Increasing demand for remote monitoring and surveillance solutions, growing adoption of cloud-based security solutions, requirement for robust security in retail and commercial sectors, expansion in emerging markets), and challenges (Risk of rapid technological changes and obsolescence, complex regulatory landscape and compliance challenges, high initial costs) influencing the growth of the security solutions market.
- Product Development/Innovation: Detailed insights on upcoming technologies, research and development activities, and product launches in the security solutions market
- Market Development: Comprehensive information about lucrative markets with an analysis of the security solutions market across varied regions
- Market Diversification: Exhaustive information about new products, untapped geographies, recent developments, and investments in the security solutions market
- Competitive Assessment: In-depth assessment of market shares, growth strategies, and service offerings of leading players in the security solutions market, such as Johnson Controls (Ireland), Honeywell International Inc (US), Robert Bosch GmbH (Germany), ADT Security Services (US), and Hangzhou Hikvision Digital Technology Co., Ltd (China).
TABLE OF CONTENTS
1 INTRODUCTION
- 1.1 STUDY OBJECTIVES
- 1.2 MARKET DEFINITION
- 1.3 STUDY SCOPE
- 1.3.1 MARKETS COVERED AND REGIONAL SCOPE
- 1.3.2 INCLUSIONS AND EXCLUSIONS
- 1.3.3 YEARS CONSIDERED
- 1.4 CURRENCY CONSIDERED
- 1.5 LIMITATIONS
- 1.6 STAKEHOLDERS
- 1.7 SUMMARY OF CHANGES
2 RESEARCH METHODOLOGY
- 2.1 RESEARCH DATA
- 2.1.1 SECONDARY AND PRIMARY RESEARCH
- 2.1.2 SECONDARY DATA
- 2.1.2.1 List of key secondary sources
- 2.1.2.2 Key data from secondary sources
- 2.1.3 PRIMARY DATA
- 2.1.3.1 List of primary interview participants
- 2.1.3.2 Key data from primary sources
- 2.1.3.3 Key industry insights
- 2.1.3.4 Breakdown of primaries
- 2.2 FACTOR ANALYSIS
- 2.3 MARKET SIZE ESTIMATION
- 2.3.1 BOTTOM-UP APPROACH
- 2.3.1.1 Approach to estimate market size using bottom-up analysis (demand side)
- 2.3.2 TOP-DOWN APPROACH
- 2.3.2.1 Approach to estimate market size using top-down analysis (supply side)
- 2.3.1 BOTTOM-UP APPROACH
- 2.4 DATA TRIANGULATION
- 2.5 RESEARCH ASSUMPTIONS
- 2.6 RESEARCH LIMITATIONS
- 2.7 RISK ANALYSIS
3 EXECUTIVE SUMMARY
4 PREMIUM INSIGHTS
- 4.1 ATTRACTIVE OPPORTUNITIES FOR PLAYERS IN SECURITY SOLUTIONS MARKET
- 4.2 SECURITY SOLUTIONS MARKET, BY SYSTEM
- 4.3 SECURITY SOLUTIONS MARKET, BY SERVICE
- 4.4 SECURITY SOLUTIONS MARKET, BY VERTICAL AND REGION
- 4.5 SECURITY SOLUTIONS MARKET, BY REGION
5 MARKET OVERVIEW
- 5.1 INTRODUCTION
- 5.2 MARKET DYNAMICS
- 5.2.1 DRIVERS
- 5.2.1.1 Increasing concerns regarding public safety and infrastructure protection
- 5.2.1.2 Adoption of AI-powered surveillance and biometric access control
- 5.2.1.3 Rising incidents of theft, vandalism, and unauthorized access
- 5.2.1.4 Expansion of smart infrastructure and smart city projects
- 5.2.1.5 Modernization of physical security and access control systems
- 5.2.2 RESTRAINTS
- 5.2.2.1 Concerns regarding privacy and data protection regulations
- 5.2.2.2 Risks associated with unauthorized access
- 5.2.2.3 Complexity of integrating modern security solutions with existing infrastructure
- 5.2.3 OPPORTUNITIES
- 5.2.3.1 Increasing adoption of remote monitoring
- 5.2.3.2 Deployment of cloud-based security solutions
- 5.2.3.3 Expansion of security requirements in retail and commercial sectors
- 5.2.3.4 Rapid urbanization in developed countries
- 5.2.4 CHALLENGES
- 5.2.4.1 Competitive pressure for technological updates
- 5.2.4.2 Complex regulatory landscape and compliance challenges
- 5.2.4.3 High initial costs
- 5.2.1 DRIVERS
- 5.3 VALUE CHAIN ANALYSIS
- 5.4 ECOSYSTEM ANALYSIS
- 5.5 INVESTMENT AND FUNDING SCENARIO
- 5.6 PRICING ANALYSIS
- 5.6.1 PRICING RANGE OF SECURITY SOLUTIONS OFFERED BY KEY PLAYERS, BY SYSTEM, 2024
- 5.6.2 AVERAGE SELLING PRICE TREND OF SECURITY SOLUTIONS, BY SYSTEM, 2020-2024
- 5.6.3 AVERAGE SELLING PRICE TREND OF SECURITY SOLUTIONS, BY REGION, 2020-2024
- 5.7 TRENDS/DISRUPTIONS IMPACTING CUSTOMER BUSINESS
- 5.8 TECHNOLOGY ANALYSIS
- 5.8.1 KEY TECHNOLOGIES
- 5.8.1.1 Video surveillance
- 5.8.1.2 Biometrics
- 5.8.1.3 AI and ML
- 5.8.1.4 Wireless technologies
- 5.8.2 COMPLEMENTARY TECHNOLOGIES
- 5.8.2.1 Integrated security management systems
- 5.8.2.2 Physical and cyber convergence
- 5.8.2.3 GIS integration
- 5.8.2.4 Incident response platforms
- 5.8.3 ADJACENT TECHNOLOGIES
- 5.8.3.1 IoT security
- 5.8.3.2 Edge computing security
- 5.8.3.3 Behavioral analytics
- 5.8.1 KEY TECHNOLOGIES
- 5.9 PORTER'S FIVE FORCES ANALYSIS
- 5.10 KEY STAKEHOLDERS AND BUYING CRITERIA
- 5.11 KEY STAKEHOLDERS IN BUYING PROCESS
- 5.12 BUYING CRITERIA
- 5.13 CASE STUDY ANALYSIS
- 5.13.1 AUTOMATED SURVEILLANCE SYSTEM ENHANCES THREAT DETECTION AND RESPONSE FOR FPSO OPERATIONS
- 5.13.2 HONEYWELL DELIVERS ADVANCED FIRE AND SECURITY ECOSYSTEM FOR DUBAI MALL
- 5.13.3 BOSCH DEPLOYS INTELLIGENT VIDEO SURVEILLANCE SYSTEM FOR STADIUM-WIDE SECURITY
- 5.13.4 AXIS COMMUNICATIONS DELIVERS INTEGRATED VIDEO SURVEILLANCE ACROSS THE SHARD
- 5.13.5 AVIGILON ALTA SOLUTION UNIFIES AND STRENGTHENS VIDEO SURVEILLANCE FOR SUPERDRY
- 5.14 TRADE ANALYSIS
- 5.14.1 IMPORT SCENARIO (HS CODE 854231)
- 5.14.2 EXPORT SCENARIO (HS CODE 854231)
- 5.15 PATENT ANALYSIS
- 5.16 KEY CONFERENCES AND EVENTS, 2025-2027
- 5.17 TARIFF ANALYSIS
- 5.18 STANDARDS AND REGULATORY LANDSCAPE
- 5.18.1 REGULATORY BODIES, GOVERNMENT AGENCIES, AND OTHER ORGANIZATIONS
- 5.18.2 STANDARDS AND REGULATIONS RELATED TO SECURITY SOLUTIONS MARKET
- 5.18.2.1 ISO 27001 - Information Security Management
- 5.18.2.2 UL 2900 - Standard for Software Cybersecurity for Network-Connectable Products
- 5.18.2.3 EN 50130 Series - Alarm Systems
- 5.18.2.4 BS EN 50131 Series - Alarm Systems
- 5.18.2.5 IEC 62676
- 5.18.3 GOVERNMENT REGULATIONS
- 5.18.3.1 US
- 5.18.3.2 Canada
- 5.18.3.3 Europe
- 5.18.3.4 UK
- 5.18.3.5 Japan
- 5.18.3.6 India
- 5.19 IMPACT OF AI/GEN AI ON SECURITY SOLUTIONS MARKET
- 5.19.1 INTRODUCTION
- 5.20 IMPACT OF 2025 US TARIFF ON SECURITY SOLUTIONS MARKET
- 5.20.1 INTRODUCTION
- 5.20.2 KEY TARIFF RATES
- 5.20.3 PRICE IMPACT ANALYSIS
- 5.20.4 IMPACT ON COUNTRIES/REGIONS
- 5.20.4.1 US
- 5.20.4.2 Europe
- 5.20.4.3 Asia Pacific
- 5.20.5 IMPACT ON VERTICALS
6 FUTURE OF PHYSICAL SECURITY
- 6.1 INTRODUCTION
- 6.2 ROLE OF AI, DRONES, AND ROBOTICS IN NEXT-GEN SECURITY
- 6.3 EMERGENCE OF SMART CITIES
- 6.4 CONVERGENCE OF PHYSICAL AND CYBERSECURITY
- 6.5 TRENDS IN PREDICTIVE ANALYTICS FOR THREAT PREVENTION
7 SECURITY SOLUTIONS MARKET, BY SYSTEM
- 7.1 INTRODUCTION
- 7.2 FIRE PROTECTION SYSTEMS
- 7.2.1 FIRE SUPPRESSION SYSTEMS
- 7.2.1.1 Growing trend of modular and adaptable fire suppression solutions to drive market
- 7.2.2 FIRE SPRINKLERS
- 7.2.2.1 Rising demand for environmentally conscious fire suppression solutions to fuel market growth
- 7.2.3 FIRE DETECTION SYSTEMS
- 7.2.3.1 Increasing awareness of fire hazards to drive market
- 7.2.4 FIRE ANALYTICS SYSTEMS
- 7.2.4.1 Integration of IoT and cloud-based platforms to support market growth
- 7.2.5 FIRE RESPONSE SYSTEMS
- 7.2.5.1 Adoption of integrated and data-driven fire response solutions to fuel market growth
- 7.2.1 FIRE SUPPRESSION SYSTEMS
- 7.3 VIDEO SURVEILLANCE SYSTEMS
- 7.3.1 CAMERAS
- 7.3.1.1 Increasing adoption of AI-enabled IP cameras to boost demand
- 7.3.1.2 IP cameras and analytics
- 7.3.1.3 PTZ and fixed cameras
- 7.3.2 MONITORS
- 7.3.2.1 Growing demand for touchscreen and interactive monitors to support market growth
- 7.3.3 STORAGE DEVICES
- 7.3.3.1 Rising use of high-resolution 4K and 8K cameras to drive market
- 7.3.4 ACCESSORIES
- 7.3.4.1 Increasing deployment of weather-resistant mounts and enclosures to boost demand
- 7.3.5 SOFTWARE
- 7.3.5.1 Deployment of AI-powered video management software to offer growth opportunities
- 7.3.1 CAMERAS
- 7.4 ACCESS CONTROL SYSTEMS
- 7.4.1 CARD-BASED READERS
- 7.4.1.1 Increasing deployment in corporate offices, educational institutions, and government facilities to drive market growth
- 7.4.2 BIOMETRIC READERS
- 7.4.2.1 Growing adoption of fingerprint recognition to fuel market growth
- 7.4.3 MULTI-TECHNOLOGY READERS
- 7.4.3.1 Flexibility for visitor management and access across multiple sites to offer growth opportunities
- 7.4.4 ELECTRONIC LOCKS
- 7.4.4.1 Growth in smart lock installations for offices and residences to fuel market growth
- 7.4.5 ACCESS CONTROLLERS
- 7.4.5.1 Need for enhanced security across diverse security environments to boost demand
- 7.4.6 SOFTWARE SOLUTIONS
- 7.4.6.1 Rising use of AI and predictive analytics for threat detection to support market growth
- 7.4.7 OTHERS
- 7.4.1 CARD-BASED READERS
- 7.5 ENTRANCE CONTROL SYSTEMS
- 7.5.1 INTEGRATION WITH VIDEO SURVEILLANCE AND SECURITY PLATFORMS TO OFFER LUCRATIVE GROWTH OPPORTUNITIES
- 7.6 INTRUDER ALARM SYSTEMS
- 7.6.1 RISING CONCERNS OVER THEFT, VANDALISM, AND UNAUTHORIZED ACCESS TO FUEL SEGMENTAL GROWTH
- 7.7 THERMAL IMAGING SYSTEMS
- 7.7.1 THERMAL CAMERAS
- 7.7.1.1 Growing application in border security and critical infrastructure protection to boost demand
- 7.7.2 THERMAL MODULES
- 7.7.2.1 Enhanced detection, tracking, and analysis with thermal imaging into existing infrastructure to drive market
- 7.7.1 THERMAL CAMERAS
8 SECURITY SOLUTIONS MARKET, BY SERVICE
- 8.1 INTRODUCTION
- 8.2 FIRE PROTECTION SERVICES
- 8.2.1 MAINTENANCE SERVICES
- 8.2.1.1 Growing application in residential complexes, public venues, and transportation hubs to fuel market growth
- 8.2.2 MANAGED SERVICES
- 8.2.2.1 Optimized fire protection performance to drive market
- 8.2.3 INSTALLATION AND DESIGN SERVICES
- 8.2.3.1 Growing importance of customized fire protection solutions to foster market growth
- 8.2.4 ENGINEERING SERVICES
- 8.2.4.1 Rising demand for integrated and adaptive fire safety approaches to support market growth
- 8.2.5 OTHER SERVICES
- 8.2.1 MAINTENANCE SERVICES
- 8.3 VIDEO SURVEILLANCE SERVICES
- 8.3.1 VSAAS
- 8.3.1.1 Rising demand for cloud-based surveillance solutions to offer growth opportunities
- 8.3.2 INSTALLATION AND MAINTENANCE
- 8.3.2.1 Reduced risk of failures during critical events to augment market growth
- 8.3.1 VSAAS
- 8.4 ACCESS CONTROL SERVICES
- 8.4.1 INSTALLATION AND INTEGRATION
- 8.4.1.1 Enhanced protection for assets, personnel, and sensitive information to fuel market growth
- 8.4.2 SUPPORT AND MAINTENANCE
- 8.4.2.1 Growing improvement-related initiatives to boost demand
- 8.4.1 INSTALLATION AND INTEGRATION
- 8.5 SECURITY SYSTEM INTEGRATION SERVICES
- 8.5.1 ENHANCED REAL-TIME MONITORING, INCIDENT DETECTION, AND COORDINATED RESPONSES TO FUEL MARKET GROWTH
- 8.6 REMOTE MONITORING SERVICES
- 8.6.1 INCREASING DEMAND FOR REAL-TIME SURVEILLANCE TO SUPPORT MARKET GROWTH
9 SECURITY SOLUTIONS MARKET, BY VERTICAL
- 9.1 INTRODUCTION
- 9.2 RESIDENTIAL
- 9.2.1 INCREASING DEMAND FOR CONVENIENCE AND AUTOMATION TO BENEFIT MARKET
- 9.2.1.1 Smart home security
- 9.2.1.2 Gated community solutions
- 9.2.1 INCREASING DEMAND FOR CONVENIENCE AND AUTOMATION TO BENEFIT MARKET
- 9.3 COMMERCIAL
- 9.3.1 ADOPTION OF AI, CLOUD PLATFORMS, AND BIOMETRIC SOLUTIONS TO OFFER GROWTH OPPORTUNITIES
- 9.3.2 CORPORATE OFFICES AND FACILITIES
- 9.3.2.1 Employee access management
- 9.3.2.2 Visitor management system
- 9.3.2.3 Asset protection
- 9.3.2.4 Compliance management
- 9.3.3 MALLS
- 9.4 GOVERNMENT
- 9.4.1 INCREASING THREATS OF TERRORISM AND CYBER-PHYSICAL ATTACKS IN PUBLIC SPACES TO BOOST DEMAND
- 9.4.2 CITY SURVEILLANCE
- 9.4.3 COURTS AND PRISONS
- 9.5 TRANSPORTATION
- 9.5.1 NEED FOR INTEGRATED, INTELLIGENT, AND SCALABLE SECURITY SYSTEMS TO FOSTER MARKET GROWTH
- 9.5.2 AIRPORTS
- 9.5.3 RAILWAYS
- 9.5.4 MARITIME
- 9.5.5 CARGO AND WAREHOUSE SECURITY
- 9.6 RETAIL
- 9.6.1 ADOPTION OF AI-POWERED VIDEO ANALYTICS TO ENABLE REAL-TIME MONITORING TO FUEL MARKET GROWTH
- 9.6.2 LOSS PREVENTION SYSTEM
- 9.6.3 POS SECURITY
- 9.6.4 INVENTORY PROTECTION
- 9.7 BANKING AND FINANCE
- 9.7.1 NEED TO SAFEGUARD PHYSICAL BRANCHES AND ONLINE ASSETS TO DRIVE MARKET
- 9.7.2 BRANCH SECURITY SOLUTIONS
- 9.7.3 ATM SECURITY SOLUTIONS
- 9.7.4 DATA CENTER PROTECTION
- 9.8 EDUCATION
- 9.8.1 SMART CAMPUS INITIATIVES TO OFFER GROWTH OPPORTUNITIES
- 9.8.2 CAMPUS SECURITY
- 9.8.3 RESEARCH AND FACILITY
- 9.9 INDUSTRIAL
- 9.9.1 GROWING INCIDENTS OF THEFT, SABOTAGE, AND WORKPLACE ACCIDENTS TO DRIVE MARKET
- 9.9.2 MANUFACTURING PLANTS
- 9.9.3 WAREHOUSES
- 9.10 ENERGY & UTILITIES
- 9.10.1 RISING RENEWABLE ENERGY INFRASTRUCTURE TO FUEL MARKET GROWTH
- 9.11 SPORTS & LEISURE
- 9.11.1 EMPHASIS ON SAFEGUARDING STADIUMS, ARENAS, AND RECREATION CENTERS TO FOSTER MARKET GROWTH
- 9.12 HEALTHCARE
- 9.12.1 ADOPTION OF INTELLIGENT SECURITY SOLUTIONS TO SUPPORT MARKET GROWTH
- 9.12.2 HOSPITALITY SECURITY SYSTEMS
- 9.12.3 PHARMACEUTICAL SECURITY
- 9.13 MILITARY & DEFENSE
- 9.13.1 EVOLVING SECURITY THREATS TO BOOST DEMAND
- 9.13.2 BORDER SECURITY
- 9.13.3 LAW ENFORCEMENT SOLUTIONS
10 SECURITY SOLUTIONS MARKET, BY REGION
- 10.1 INTRODUCTION
- 10.2 NORTH AMERICA
- 10.2.1 MACROECONOMIC OUTLOOK FOR NORTH AMERICA
- 10.2.2 US
- 10.2.2.1 Growing urban crime to boost demand
- 10.2.3 CANADA
- 10.2.3.1 Shift toward integrated and cloud-enabled solutions to foster market growth
- 10.2.4 MEXICO
- 10.2.4.1 Government-led initiatives and investments in public safety to drive market
- 10.3 EUROPE
- 10.3.1 MACROECONOMIC OUTLOOK FOR EUROPE
- 10.3.2 GERMANY
- 10.3.2.1 Emphasis on Industry 4.0 to offer growth opportunities
- 10.3.3 UK
- 10.3.3.1 Increasing emphasis on secure infrastructure to drive market
- 10.3.4 FRANCE
- 10.3.4.1 Rising adoption of AI-powered security solutions for industrial and commercial sectors to propel market growth
- 10.3.5 ITALY
- 10.3.5.1 Adoption of smart building technologies to fuel market growth
- 10.3.6 SPAIN
- 10.3.6.1 Push toward digital transformation to foster market growth
- 10.3.7 NORDICS
- 10.3.7.1 Convergence of technological innovation to offer growth opportunities
- 10.3.8 REST OF EUROPE
- 10.4 ASIA PACIFIC
- 10.4.1 MACROECONOMIC OUTLOOK FOR ASIA PACIFIC
- 10.4.2 CHINA
- 10.4.2.1 Expansion of smart city initiatives to support market growth
- 10.4.3 JAPAN
- 10.4.3.1 Emphasis on upgrading safety in transportation networks to drive market
- 10.4.4 SOUTH KOREA
- 10.4.4.1 Increasing focus on smart infrastructure to fuel market growth
- 10.4.5 INDIA
- 10.4.5.1 Rapid urbanization to offer growth opportunities
- 10.4.6 AUSTRALIA
- 10.4.6.1 Increasing safety standards across industrial facilities to fuel market growth
- 10.4.7 INDONESIA
- 10.4.7.1 Rising demand for modern video surveillance and access control systems to foster market growth
- 10.4.8 MALAYSIA
- 10.4.8.1 Increasing adoption of AI-based monitoring and robotic security to boost demand
- 10.4.9 THAILAND
- 10.4.9.1 Growing tourism to boost demand
- 10.4.10 VIETNAM
- 10.4.10.1 Increasing investment in infrastructure projects to drive market
- 10.4.11 REST OF ASIA PACIFIC
- 10.5 ROW
- 10.5.1 MACROECONOMIC OUTLOOK FOR ROW
- 10.5.2 MIDDLE EAST
- 10.5.2.1 Saudi Arabia
- 10.5.2.1.1 Growing focus on life safety and risk management to boost demand
- 10.5.2.2 UAE
- 10.5.2.2.1 Increasing investments in commercial properties to drive market
- 10.5.2.3 Qatar
- 10.5.2.3.1 Investment in large infrastructure and airport expansions fuel market growth
- 10.5.2.4 Kuwait
- 10.5.2.4.1 Increasing demand in oil & gas facilities and public institutions to drive market
- 10.5.2.5 Oman
- 10.5.2.5.1 Importance of improved safety standards to support market growth
- 10.5.2.6 Bahrain
- 10.5.2.6.1 Emphasis on infrastructure modernization to fuel market growth
- 10.5.2.7 Rest of Middle East
- 10.5.2.1 Saudi Arabia
- 10.5.3 SOUTH AMERICA
- 10.5.3.1 Rising technological innovation to foster market growth
- 10.5.4 AFRICA
- 10.5.5 SOUTH AFRICA
- 10.5.5.1 Need to protect critical infrastructure to boost demand
- 10.5.6 REST OF AFRICA
11 COMPETITIVE LANDSCAPE
- 11.1 OVERVIEW
- 11.2 KEY PLAYER STRATEGIES/RIGHT TO WIN, 2021-2025
- 11.3 REVENUE ANALYSIS, 2020-2024
- 11.4 MARKET SHARE ANALYSIS, 2O24
- 11.5 COMPANY VALUATION AND FINANCIAL METRICS
- 11.6 BRAND COMPARISON
- 11.7 COMPANY EVALUATION MATRIX: KEY PLAYERS, 2024
- 11.7.1 STARS
- 11.7.2 EMERGING LEADERS
- 11.7.3 PERVASIVE PLAYERS
- 11.7.4 PARTICIPANTS
- 11.7.5 COMPANY FOOTPRINT: KEY PLAYERS, 2024
- 11.7.5.1 Company footprint
- 11.7.5.2 Region footprint
- 11.7.5.3 System footprint
- 11.7.5.4 Service footprint
- 11.7.5.5 Vertical footprint
- 11.8 COMPANY EVALUATION MATRIX: STARTUPS/SMES, 2024
- 11.8.1 PROGRESSIVE COMPANIES
- 11.8.2 RESPONSIVE COMPANIES
- 11.8.3 DYNAMIC COMPANIES
- 11.8.4 STARTING BLOCKS
- 11.8.5 COMPETITIVE BENCHMARKING: STARTUPS/SMES, 2024
- 11.8.5.1 Detailed list of key startups/SMEs
- 11.8.5.2 Competitive benchmarking of key startups/SMEs
- 11.9 COMPETITIVE SCENARIO
- 11.9.1 PRODUCT LAUNCHES
- 11.9.2 DEALS
12 COMPANY PROFILES
- 12.1 KEY PLAYERS
- 12.1.1 JOHNSON CONTROLS
- 12.1.1.1 Business overview
- 12.1.1.2 Products/Solutions/Services offered
- 12.1.1.3 Recent developments
- 12.1.1.3.1 Product launches
- 12.1.1.3.2 Deals
- 12.1.1.4 MnM view
- 12.1.1.4.1 Key strengths/Right to win
- 12.1.1.4.2 Strategic choices
- 12.1.1.4.3 Weaknesses/Competitive threats
- 12.1.2 HONEYWELL INTERNATIONAL INC.
- 12.1.2.1 Business overview
- 12.1.2.2 Products/Solutions/Services offered
- 12.1.2.3 Recent developments
- 12.1.2.3.1 Product launches
- 12.1.2.3.2 Deals
- 12.1.2.4 MnM view
- 12.1.2.4.1 Key strengths/Right to win
- 12.1.2.4.2 Strategic choices
- 12.1.2.4.3 Weaknesses/Competitive threats
- 12.1.3 ROBERT BOSCH GMBH
- 12.1.3.1 Business overview
- 12.1.3.2 Products/Solutions/Services offered
- 12.1.3.3 Recent developments
- 12.1.3.3.1 Product launches
- 12.1.3.3.2 Deals
- 12.1.3.4 MnM view
- 12.1.3.4.1 Key strengths/Right to win
- 12.1.3.4.2 Strategic choices
- 12.1.3.4.3 Weaknesses/Competitive threats
- 12.1.4 ADT SECURITY SERVICES
- 12.1.4.1 Business overview
- 12.1.4.2 Products/Solutions/Services offered
- 12.1.4.3 Recent developments
- 12.1.4.3.1 Product launches
- 12.1.4.3.2 Deals
- 12.1.4.4 MnM view
- 12.1.4.4.1 Key strengths/Right to win
- 12.1.4.4.2 Strategic choices
- 12.1.4.4.3 Weaknesses/Competitive threats
- 12.1.5 HANGZHOU HIKVISION DIGITAL TECHNOLOGY CO., LTD
- 12.1.5.1 Business overview
- 12.1.5.2 Products/Solutions/Services offered
- 12.1.5.3 Recent developments
- 12.1.5.3.1 Product launches
- 12.1.5.3.2 Deals
- 12.1.5.4 MnM view
- 12.1.5.4.1 Key strengths/Right to win
- 12.1.5.4.2 Strategic choices
- 12.1.5.4.3 Weaknesses/Competitive threats
- 12.1.6 AXIS COMMUNICATIONS AB
- 12.1.6.1 Business overview
- 12.1.6.2 Products/Solutions/Services offered
- 12.1.6.3 Recent developments
- 12.1.6.3.1 Product launches
- 12.1.6.3.2 Deals
- 12.1.7 DAHUA TECHNOLOGY CO., LTD
- 12.1.7.1 Business overview
- 12.1.7.2 Products/Solutions/Services offered
- 12.1.7.2.1 Product launches
- 12.1.8 SECOM CO., LTD
- 12.1.8.1 Business overview
- 12.1.8.2 Products/Solutions/Services offered
- 12.1.8.3 Recent developments
- 12.1.8.3.1 Product launches
- 12.1.9 SIEMENS
- 12.1.9.1 Business overview
- 12.1.9.2 Products/Solutions/Services offered
- 12.1.10 ASSA ABLOY
- 12.1.10.1 Business overview
- 12.1.10.2 Products/Solutions/Services offered
- 12.1.10.3 Recent developments
- 12.1.10.3.1 Deals
- 12.1.11 KEENFINITY
- 12.1.11.1 Business overview
- 12.1.11.2 Products/Solutions/Services offered
- 12.1.1 JOHNSON CONTROLS
- 12.2 OTHER PLAYERS
- 12.2.1 HALMA PLC
- 12.2.2 HOCHIKI CORPORATION
- 12.2.3 DORMAKABA GROUP
- 12.2.4 TELEDYNE FLIR LLC
- 12.2.5 ALLEGION PLC
- 12.2.6 NICE S.P.A.
- 12.2.7 GODREJ GROUP
- 12.2.8 ALARM.COM
- 12.2.9 MOTOROLA SOLUTIONS, INC.
- 12.2.10 DALLMEIER ELECTRONIC GMBH & CO KG
- 12.2.11 SECURITAS TECHNOLOGY
- 12.2.12 GUNNEBO AB
- 12.2.13 BRIVO SYSTEMS, LLC
- 12.2.14 BRINKS HOME
- 12.2.15 VERKADA INC.
13 APPENDIX
- 13.1 INSIGHTS FROM INDUSTRY EXPERTS
- 13.2 DISCUSSION GUIDE
- 13.3 KNOWLEDGESTORE: MARKETSANDMARKETS' SUBSCRIPTION PORTAL
- 13.4 AVAILABLE CUSTOMIZATIONS
- 13.5 RELATED REPORTS
- 13.6 AUTHOR DETAILS
List of Tables
- TABLE 1 LIST OF SECONDARY SOURCES
- TABLE 2 SECURITY SOLUTIONS MARKET: ROLE OF KEY PLAYERS IN ECOSYSTEM
- TABLE 3 PRICING RANGE OF SECURITY SOLUTIONS OFFERED BY KEY PLAYERS, BY SYSTEM, 2024
- TABLE 4 AVERAGE SELLING PRICE TREND OF SECURITY SOLUTIONS, BY SYSTEM, 2020-2024
- TABLE 5 AVERAGE SELLING PRICE TREND OF SECURITY SOLUTIONS, BY REGION, 2020-2024
- TABLE 6 SECURITY SOLUTIONS MARKET: PORTER'S FIVE FORCES ANALYSIS
- TABLE 7 INFLUENCE OF STAKEHOLDERS ON BUYING PROCESS, BY VERTICAL (%)
- TABLE 8 KEY BUYING CRITERIA FOR VERTICALS
- TABLE 9 IMPORT DATA FOR HS CODE 854231-COMPLIANT PRODUCTS, BY COUNTRY, 2020-2024 (USD MILLION)
- TABLE 10 EXPORT DATA FOR HS CODE 854231-COMPLIANT PRODUCTS, BY COUNTRY, 2020-2024 (USD MILLION)
- TABLE 11 PATENTS APPLIED AND GRANTED, 2023-2025
- TABLE 12 SECURITY SOLUTIONS MARKET: CONFERENCES AND EVENTS, 2025-2027
- TABLE 13 MFN TARIFF FOR HS CODE 854231-COMPLIANT PRODUCTS EXPORTED BY US
- TABLE 14 NORTH AMERICA: LIST OF REGULATORY BODIES, GOVERNMENT AGENCIES, AND OTHER ORGANIZATIONS
- TABLE 15 EUROPE: LIST OF REGULATORY BODIES, GOVERNMENT AGENCIES, AND OTHER ORGANIZATIONS
- TABLE 16 ASIA PACIFIC: LIST OF REGULATORY BODIES, GOVERNMENT AGENCIES, AND OTHER ORGANIZATIONS
- TABLE 17 ROW: LIST OF REGULATORY BODIES, GOVERNMENT AGENCIES, AND OTHER ORGANIZATIONS
- TABLE 18 US-ADJUSTED RECIPROCAL TARIFF RATES
- TABLE 19 SECURITY SOLUTIONS MARKET, BY SYSTEM, 2021-2024 (USD MILLION)
- TABLE 20 SECURITY SOLUTIONS MARKET, BY SYSTEM, 2025-2030 (USD MILLION)
- TABLE 21 FIRE PROTECTION SYSTEMS: SECURITY SOLUTIONS MARKET, BY TYPE, 2021-2024 (USD MILLION)
- TABLE 22 FIRE PROTECTION SYSTEMS: SECURITY SOLUTIONS MARKET, BY TYPE, 2025-2030 (USD MILLION)
- TABLE 23 FIRE PROTECTION SYSTEMS: SECURITY SOLUTIONS MARKET, BY REGION, 2021-2024 (USD MILLION)
- TABLE 24 FIRE PROTECTION SYSTEMS: SECURITY SOLUTIONS MARKET, BY REGION, 2025-2030 (USD MILLION)
- TABLE 25 FIRE SUPPRESSION SYSTEMS: SECURITY SOLUTIONS MARKET, BY REGION, 2021-2024 (USD MILLION)
- TABLE 26 FIRE SUPPRESSION SYSTEMS: SECURITY SOLUTIONS MARKET, BY REGION, 2025-2030 (USD MILLION)
- TABLE 27 FIRE SPRINKLERS: SECURITY SOLUTIONS MARKET, BY REGION, 2021-2024 (USD MILLION)
- TABLE 28 FIRE SPRINKLERS: SECURITY SOLUTIONS MARKET, BY REGION, 2025-2030 (USD MILLION)
- TABLE 29 FIRE DETECTION SYSTEMS: SECURITY SOLUTIONS MARKET, BY REGION, 2021-2024 (USD MILLION)
- TABLE 30 FIRE DETECTION SYSTEMS: SECURITY SOLUTIONS MARKET, BY REGION, 2025-2030 (USD MILLION)
- TABLE 31 FIRE ANALYTICS SOLUTIONS: SECURITY SOLUTIONS MARKET, BY REGION, 2021-2024 (USD MILLION)
- TABLE 32 FIRE ANALYTICS SOLUTIONS: SECURITY SOLUTIONS MARKET, BY REGION, 2025-2030 (USD MILLION)
- TABLE 33 FIRE RESPONSE SYSTEMS: SECURITY SOLUTIONS MARKET, BY REGION, 2021-2024 (USD MILLION)
- TABLE 34 FIRE RESPONSE SYSTEMS: SECURITY SOLUTIONS MARKET, BY REGION, 2025-2030 (USD MILLION)
- TABLE 35 VIDEO SURVEILLANCE SYSTEMS: SECURITY SOLUTIONS MARKET, BY TYPE, 2021-2024 (USD MILLION)
- TABLE 36 VIDEO SURVEILLANCE SYSTEMS: SECURITY SOLUTIONS MARKET, BY TYPE, 2025-2030 (USD MILLION)
- TABLE 37 VIDEO SURVEILLANCE SYSTEMS: SECURITY SOLUTIONS MARKET, BY REGION, 2021-2024 (USD MILLION)
- TABLE 38 VIDEO SURVEILLANCE SYSTEMS: SECURITY SOLUTIONS MARKET, BY REGION, 2025-2030 (USD MILLION)
- TABLE 39 CAMERAS: SECURITY SOLUTIONS MARKET, BY REGION, 2021-2024 (USD MILLION)
- TABLE 40 CAMERAS: SECURITY SOLUTIONS MARKET, BY REGION, 2025-2030 (USD MILLION)
- TABLE 41 MONITORS: SECURITY SOLUTIONS MARKET, BY REGION, 2021-2024 (USD MILLION)
- TABLE 42 MONITORS: SECURITY SOLUTIONS MARKET, BY REGION, 2025-2030 (USD MILLION)
- TABLE 43 STORAGE DEVICES: SECURITY SOLUTIONS MARKET, BY REGION, 2021-2024 (USD MILLION)
- TABLE 44 STORAGE DEVICES: SECURITY SOLUTIONS MARKET, BY REGION, 2025-2030 (USD MILLION)
- TABLE 45 ACCESSORIES: SECURITY SOLUTIONS MARKET, BY REGION, 2021-2024 (USD MILLION)
- TABLE 46 ACCESSORIES: SECURITY SOLUTIONS MARKET, BY REGION, 2025-2030 (USD MILLION)
- TABLE 47 SOFTWARE: SECURITY SOLUTIONS MARKET, BY REGION, 2021-2024 (USD MILLION)
- TABLE 48 SOFTWARE: SECURITY SOLUTIONS MARKET, BY REGION, 2025-2030 (USD MILLION)
- TABLE 49 ACCESS CONTROL SYSTEMS: SECURITY SOLUTIONS MARKET, BY TYPE, 2021-2024 (USD MILLION)
- TABLE 50 ACCESS CONTROL SYSTEMS: SECURITY SOLUTIONS MARKET, BY TYPE, 2025-2030 (USD MILLION)
- TABLE 51 ACCESS CONTROL SYSTEMS: SECURITY SOLUTIONS MARKET, BY REGION, 2021-2024 (USD MILLION)
- TABLE 52 ACCESS CONTROL SYSTEMS: SECURITY SOLUTIONS MARKET, BY REGION, 2025-2030 (USD MILLION)
- TABLE 53 ENTRANCE CONTROL SYSTEMS: SECURITY SOLUTIONS MARKET, BY REGION, 2021-2024 (USD MILLION)
- TABLE 54 ENTRANCE CONTROL SYSTEMS: SECURITY SOLUTIONS MARKET, BY REGION, 2025-2030 (USD MILLION)
- TABLE 55 INTRUDER ALARM SYSTEMS: SECURITY SOLUTIONS MARKET, BY REGION, 2021-2024 (USD MILLION)
- TABLE 56 INTRUDER ALARM SYSTEMS: SECURITY SOLUTIONS MARKET, BY REGION, 2025-2030 (USD MILLION)
- TABLE 57 THERMAL IMAGING SYSTEMS: SECURITY SOLUTIONS MARKET, BY TYPE, 2021-2024 (USD MILLION)
- TABLE 58 THERMAL IMAGING SYSTEMS: SECURITY SOLUTIONS MARKET, BY TYPE, 2025-2030 (USD MILLION)
- TABLE 59 THERMAL IMAGING SYSTEMS: SECURITY SOLUTIONS MARKET, BY REGION, 2021-2024 (USD MILLION)
- TABLE 60 THERMAL IMAGING SYSTEMS: SECURITY SOLUTIONS MARKET, BY REGION, 2025-2030 (USD MILLION)
- TABLE 61 SECURITY SOLUTIONS MARKET, BY SERVICE, 2021-2024 (USD MILLION)
- TABLE 62 SECURITY SOLUTIONS MARKET, BY SERVICE, 2025-2030 (USD MILLION)
- TABLE 63 FIRE PROTECTION SERVICES: SECURITY SOLUTIONS MARKET, BY TYPE, 2021-2024 (USD MILLION)
- TABLE 64 FIRE PROTECTION SERVICES: SECURITY SOLUTIONS MARKET, BY TYPE, 2025-2030 (USD MILLION)
- TABLE 65 FIRE PROTECTION SERVICES: SECURITY SOLUTIONS MARKET, BY REGION, 2021-2024 (USD MILLION)
- TABLE 66 FIRE PROTECTION SERVICES: SECURITY SOLUTIONS MARKET, BY REGION, 2025-2030 (USD MILLION)
- TABLE 67 VIDEO SURVEILLANCE SERVICES: SECURITY SOLUTIONS MARKET, BY TYPE, 2021-2024 (USD MILLION)
- TABLE 68 VIDEO SURVEILLANCE SERVICES: SECURITY SOLUTIONS MARKET, BY TYPE, 2025-2030 (USD MILLION)
- TABLE 69 VIDEO SURVEILLANCE SERVICES: SECURITY SOLUTIONS MARKET, BY REGION, 2021-2024 (USD MILLION)
- TABLE 70 VIDEO SURVEILLANCE SERVICES: SECURITY SOLUTIONS MARKET, BY REGION, 2025-2030 (USD MILLION)
- TABLE 71 VIDEO SURVEILLANCE AS A SERVICE: SECURITY SOLUTIONS MARKET, BY REGION, 2021-2024 (USD MILLION)
- TABLE 72 VIDEO SURVEILLANCE AS A SERVICE: SECURITY SOLUTIONS MARKET, BY REGION, 2025-2030 (USD MILLION)
- TABLE 73 INSTALLATION AND MAINTENANCE: SECURITY SOLUTIONS MARKET, BY REGION, 2021-2024 (USD MILLION)
- TABLE 74 INSTALLATION AND MAINTENANCE: SECURITY SOLUTIONS MARKET, BY REGION, 2025-2030 (USD MILLION)
- TABLE 75 ACCESS CONTROL SERVICES: SECURITY SOLUTIONS MARKET, BY TYPE, 2021-2024 (USD MILLION)
- TABLE 76 ACCESS CONTROL SERVICES: SECURITY SOLUTIONS MARKET, BY TYPE, 2025-2030 (USD MILLION)
- TABLE 77 ACCESS CONTROL SERVICES: SECURITY SOLUTIONS MARKET, BY REGION, 2021-2024 (USD MILLION)
- TABLE 78 ACCESS CONTROL SERVICES: SECURITY SOLUTIONS MARKET, BY REGION, 2025-2030 (USD MILLION)
- TABLE 79 SECURITY SYSTEM INTEGRATION SERVICES: SECURITY SOLUTIONS MARKET, BY REGION, 2021-2024 (USD MILLION)
- TABLE 80 SECURITY SYSTEM INTEGRATION SERVICES: SECURITY SOLUTIONS MARKET, BY REGION, 2025-2030 (USD MILLION)
- TABLE 81 REMOTE MONITORING SERVICES: SECURITY SOLUTIONS MARKET, BY REGION, 2021-2024 (USD MILLION)
- TABLE 82 REMOTE MONITORING SERVICES: SECURITY SOLUTIONS MARKET, BY REGION, 2025-2030 (USD MILLION)
- TABLE 83 SECURITY SOLUTIONS MARKET, BY VERTICAL, 2021-2024 (USD MILLION)
- TABLE 84 SECURITY SOLUTIONS MARKET, BY VERTICAL, 2025-2030 (USD MILLION)
- TABLE 85 RESIDENTIAL: SECURITY SOLUTIONS MARKET, BY REGION, 2021-2024 (USD MILLION)
- TABLE 86 RESIDENTIAL: SECURITY SOLUTIONS MARKET, BY REGION, 2025-2030 (USD MILLION)
- TABLE 87 COMMERCIAL: SECURITY SOLUTIONS MARKET, BY REGION, 2021-2024 (USD MILLION)
- TABLE 88 COMMERCIAL: SECURITY SOLUTIONS MARKET, BY REGION, 2025-2030 (USD MILLION)
- TABLE 89 GOVERNMENT: SECURITY SOLUTIONS MARKET, BY REGION, 2021-2024 (USD MILLION)
- TABLE 90 GOVERNMENT: SECURITY SOLUTIONS MARKET, BY REGION, 2025-2030 (USD MILLION)
- TABLE 91 TRANSPORTATION: SECURITY SOLUTIONS MARKET, BY REGION, 2021-2024 (USD MILLION)
- TABLE 92 TRANSPORTATION: SECURITY SOLUTIONS MARKET, BY REGION, 2025-2030 (USD MILLION)
- TABLE 93 RETAIL: SECURITY SOLUTIONS MARKET, BY REGION, 2021-2024 (USD MILLION)
- TABLE 94 RETAIL: SECURITY SOLUTIONS MARKET, BY REGION, 2025-2030 (USD MILLION)
- TABLE 95 BANKING AND FINANCE: SECURITY SOLUTIONS MARKET, BY REGION, 2021-2024 (USD MILLION)
- TABLE 96 BANKING AND FINANCE: SECURITY SOLUTIONS MARKET, BY REGION, 2025-2030 (USD MILLION)
- TABLE 97 EDUCATION: SECURITY SOLUTIONS MARKET, BY REGION, 2021-2024 (USD MILLION)
- TABLE 98 EDUCATION: SECURITY SOLUTIONS MARKET, BY REGION, 2025-2030 (USD MILLION)
- TABLE 99 INDUSTRIAL: SECURITY SOLUTIONS MARKET, BY REGION, 2021-2024 (USD MILLION)
- TABLE 100 INDUSTRIAL: SECURITY SOLUTIONS MARKET, BY REGION, 2025-2030 (USD MILLION)
- TABLE 101 ENERGY & UTILITIES: SECURITY SOLUTIONS MARKET, BY REGION, 2021-2024 (USD MILLION)
- TABLE 102 ENERGY & UTILITIES: SECURITY SOLUTIONS MARKET, BY REGION, 2025-2030 (USD MILLION)
- TABLE 103 SPORTS & LAISURE: SECURITY SOLUTIONS MARKET, BY REGION, 2021-2024 (USD MILLION)
- TABLE 104 SPORTS & LAISURE: SECURITY SOLUTIONS MARKET, BY REGION, 2025-2030 (USD MILLION)
- TABLE 105 HEALTHCARE: SECURITY SOLUTIONS MARKET, BY REGION, 2021-2024 (USD MILLION)
- TABLE 106 HEALTHCARE: SECURITY SOLUTIONS MARKET, BY REGION, 2025-2030 (USD MILLION)
- TABLE 107 MILITARY AND DEFENSE: SECURITY SOLUTIONS MARKET, BY REGION, 2021-2024 (USD MILLION)
- TABLE 108 MILITARY AND DEFENSE: SECURITY SOLUTIONS MARKET, BY REGION, 2025-2030 (USD MILLION)
- TABLE 109 SECURITY SOLUTIONS MARKET, BY REGION, 2021-2024 (USD MILLION)
- TABLE 110 SECURITY SOLUTIONS MARKET, BY REGION, 2025-2030 (USD MILLION)
- TABLE 111 NORTH AMERICA: SECURITY SOLUTIONS MARKET, BY COUNTRY, 2021-2024 (USD MILLION)
- TABLE 112 NORTH AMERICA: SECURITY SOLUTIONS MARKET, BY COUNTRY, 2025-2030 (USD MILLION)
- TABLE 113 NORTH AMERICA: SECURITY SOLUTIONS MARKET, BY SYSTEM, 2021-2024 (USD MILLION)
- TABLE 114 NORTH AMERICA: SECURITY SOLUTIONS MARKET, BY SYSTEM, 2025-2030 (USD MILLION)
- TABLE 115 NORTH AMERICA: SECURITY SOLUTIONS MARKET FOR FIRE PROTECTION SYSTEMS, BY TYPE, 2021-2024 (USD MILLION)
- TABLE 116 NORTH AMERICA: SECURITY SOLUTIONS MARKET FOR FIRE PROTECTION SYSTEMS, BY TYPE, 2025-2030 (USD MILLION)
- TABLE 117 NORTH AMERICA: SECURITY SOLUTIONS MARKET FOR VIDEO SURVEILLANCE SYSTEMS, BY TYPE, 2021-2024 (USD MILLION)
- TABLE 118 NORTH AMERICA: SECURITY SOLUTIONS MARKET FOR VIDEO SURVEILLANCE SYSTEMS, BY TYPE, 2025-2030 (USD MILLION)
- TABLE 119 NORTH AMERICA: SECURITY SOLUTIONS MARKET, BY SERVICE, 2021-2024 (USD MILLION)
- TABLE 120 NORTH AMERICA: SECURITY SOLUTIONS MARKET, BY SERVICE, 2025-2030 (USD MILLION)
- TABLE 121 NORTH AMERICA: SECURITY SOLUTIONS MARKET FOR VIDEO SURVEILLANCE SERVICES, BY TYPE, 2021-2024 (USD MILLION)
- TABLE 122 NORTH AMERICA SECURITY SOLUTIONS MARKET FOR VIDEO SURVEILLANCE SERVICES, BY TYPE, 2025-2030 (USD MILLION)
- TABLE 123 NORTH AMERICA: SECURITY SOLUTIONS MARKET, BY VERTICAL, 2021-2024 (USD MILLION)
- TABLE 124 NORTH AMERICA: SECURITY SOLUTIONS MARKET, BY VERTICAL, 2025-2030 (USD MILLION)
- TABLE 125 EUROPE: SECURITY SOLUTIONS MARKET, BY COUNTRY, 2021-2024 (USD MILLION)
- TABLE 126 EUROPE: SECURITY SOLUTIONS MARKET, BY COUNTRY, 2025-2030 (USD MILLION)
- TABLE 127 EUROPE: SECURITY SOLUTIONS MARKET, BY SYSTEM, 2021-2024 (USD MILLION)
- TABLE 128 EUROPE: SECURITY SOLUTIONS MARKET, BY SYSTEM, 2025-2030 (USD MILLION)
- TABLE 129 EUROPE: SECURITY SOLUTIONS MARKET FOR FIRE PROTECTION SYSTEMS, BY TYPE, 2021-2024 (USD MILLION)
- TABLE 130 EUROPE: SECURITY SOLUTIONS MARKET FOR FIRE PROTECTION SYSTEMS, BY TYPE, 2025-2030 (USD MILLION)
- TABLE 131 EUROPE: SECURITY SOLUTIONS MARKET FOR VIDEO SURVEILLANCE SYSTEMS, BY TYPE, 2021-2024 (USD MILLION)
- TABLE 132 EUROPE: SECURITY SOLUTIONS MARKET FOR VIDEO SURVEILLANCE SYSTEMS, BY TYPE, 2025-2030 (USD MILLION)
- TABLE 133 EUROPE: SECURITY SOLUTIONS MARKET, BY SERVICE, 2021-2024 (USD MILLION)
- TABLE 134 EUROPE: SECURITY SOLUTIONS MARKET, BY SERVICE, 2025-2030 (USD MILLION)
- TABLE 135 EUROPE: SECURITY SOLUTIONS MARKET FOR VIDEO SURVEILLANCE SERVICES, BY TYPE, 2021-2024 (USD MILLION)
- TABLE 136 EUROPE: SECURITY SOLUTIONS MARKET FOR VIDEO SURVEILLANCE SERVICES, BY TYPE, 2025-2030 (USD MILLION)
- TABLE 137 EUROPE: SECURITY SOLUTIONS MARKET, BY VERTICAL, 2021-2024 (USD MILLION)
- TABLE 138 EUROPE: SECURITY SOLUTIONS MARKET, BY VERTICAL, 2025-2030 (USD MILLION)
- TABLE 139 ASIA PACIFIC: SECURITY SOLUTIONS MARKET, BY COUNTRY, 2021-2024 (USD MILLION)
- TABLE 140 ASIA PACIFIC: SECURITY SOLUTIONS MARKET, BY COUNTRY, 2025-2030 (USD MILLION)
- TABLE 141 ASIA PACIFIC: SECURITY SOLUTIONS MARKET, BY SYSTEM, 2021-2024 (USD MILLION)
- TABLE 142 ASIA PACIFIC: SECURITY SOLUTIONS MARKET, BY SYSTEM, 2025-2030 (USD MILLION)
- TABLE 143 ASIA PACIFIC: SECURITY SOLUTIONS MARKET FOR FIRE PROTECTION SYSTEMS, BY TYPE, 2021-2024 (USD MILLION)
- TABLE 144 ASIA PACIFIC: SECURITY SOLUTIONS MARKET FOR FIRE PROTECTION SYSTEMS, BY TYPE, 2025-2030 (USD MILLION)
- TABLE 145 ASIA PACIFIC: SECURITY SOLUTIONS MARKET FOR VIDEO SURVEILLANCE SYSTEMS, BY TYPE, 2021-2024 (USD MILLION)
- TABLE 146 ASIA PACIFIC: SECURITY SOLUTIONS MARKET FOR VIDEO SURVEILLANCE SYSTEMS, BY TYPE, 2025-2030 (USD MILLION)
- TABLE 147 ASIA PACIFIC: SECURITY SOLUTIONS MARKET, BY SERVICE, 2021-2024 (USD MILLION)
- TABLE 148 ASIA PACIFIC: SECURITY SOLUTIONS MARKET, BY SERVICE, 2025-2030 (USD MILLION)
- TABLE 149 ASIA PACIFIC: SECURITY SOLUTIONS MARKET FOR VIDEO SURVEILLANCE SERVICES, BY TYPE, 2021-2024 (USD MILLION)
- TABLE 150 ASIA PACIFIC: SECURITY SOLUTIONS MARKET FOR VIDEO SURVEILLANCE SERVICES, BY TYPE, 2025-2030 (USD MILLION)
- TABLE 151 ASIA PACIFIC: SECURITY SOLUTIONS MARKET, BY VERTICAL, 2021-2024 (USD MILLION)
- TABLE 152 ASIA PACIFIC: SECURITY SOLUTIONS MARKET, BY VERTICAL, 2025-2030 (USD MILLION)
- TABLE 153 ROW: SECURITY SOLUTIONS MARKET, BY REGION, 2021-2024 (USD MILLION)
- TABLE 154 ROW: SECURITY SOLUTIONS MARKET, BY REGION, 2025-2030 (USD MILLION)
- TABLE 155 ROW: SECURITY SOLUTIONS MARKET, BY SYSTEM, 2021-2024 (USD MILLION)
- TABLE 156 ROW: SECURITY SOLUTIONS MARKET, BY SYSTEM, 2025-2030 (USD MILLION)
- TABLE 157 ROW: SECURITY SOLUTIONS MARKET FOR FIRE PROTECTION SYSTEMS, BY TYPE, 2021-2024 (USD MILLION)
- TABLE 158 ROW: SECURITY SOLUTIONS MARKET FOR FIRE PROTECTION SYSTEMS, BY TYPE, 2025-2030 (USD MILLION)
- TABLE 159 ROW SECURITY SOLUTIONS MARKET FOR VIDEO SURVEILLANCE SYSTEMS, BY TYPE, 2021-2024 (USD MILLION)
- TABLE 160 ROW: SECURITY SOLUTIONS MARKET FOR VIDEO SURVEILLANCE SYSTEMS, BY TYPE, 2025-2030 (USD MILLION)
- TABLE 161 ROW: SECURITY SOLUTIONS MARKET, BY SERVICE, 2021-2024 (USD MILLION)
- TABLE 162 ROW: SECURITY SOLUTIONS MARKET, BY SERVICE, 2025-2030 (USD MILLION)
- TABLE 163 ROW: SECURITY SOLUTIONS MARKET FOR VIDEO SURVEILLANCE SERVICES, BY TYPE, 2021-2024 (USD MILLION)
- TABLE 164 ROW: SECURITY SOLUTIONS MARKET FOR VIDEO SURVEILLANCE SERVICES, BY TYPE, 2025-2030 (USD MILLION)
- TABLE 165 ROW: SECURITY SOLUTIONS MARKET, BY VERTICAL, 2021-2024 (USD MILLION)
- TABLE 166 ROW: SECURITY SOLUTIONS MARKET, BY VERTICAL, 2025-2030 (USD MILLION)
- TABLE 167 MIDDLE EAST: SECURITY SOLUTIONS MARKET, BY COUNTRY, 2021-2024 (USD MILLION)
- TABLE 168 MIDDLE EAST: SECURITY SOLUTIONS MARKET, BY COUNTRY, 2025-2030 (USD MILLION)
- TABLE 169 AFRICA: SECURITY SOLUTIONS MARKET, BY COUNTRY, 2021-2024 (USD MILLION)
- TABLE 170 AFRICA: SECURITY SOLUTIONS MARKET, BY COUNTRY, 2025-2030 (USD MILLION)
- TABLE 171 SECURITY SOLUTIONS MARKET: OVERVIEW OF STRATEGIES ADOPTED BY KEY PLAYERS, 2021-2025
- TABLE 172 SECURITY SOLUTIONS MARKET FOR SYSTEMS: DEGREE OF COMPETITION, 2024
- TABLE 173 SECURITY SOLUTIONS MARKET FOR SERVICES: DEGREE OF COMPETITION, 2024
- TABLE 174 SECURITY SOLUTIONS MARKET: REGION FOOTPRINT
- TABLE 175 SECURITY SOLUTIONS MARKET: SYSTEM FOOTPRINT
- TABLE 176 SECURITY SOLUTIONS MARKET: SERVICE FOOTPRINT
- TABLE 177 SECURITY SOLUTIONS MARKET: VERTICAL FOOTPRINT
- TABLE 178 SECURITY SOLUTIONS MARKET: DETAILED LIST OF KEY STARTUPS/SMES
- TABLE 179 SECURITY SOLUTIONS MARKET: COMPETITIVE BENCHMARKING OF KEY STARTUPS/SMES
- TABLE 180 SECURITY SOLUTIONS MARKET: PRODUCT LAUNCHES, JANUARY 2021- AUGUST 2025
- TABLE 181 SECURITY SOLUTIONS MARKET: DEALS JANUARY 2021- AUGUST 2025
- TABLE 182 JOHNSON CONTROLS: COMPANY OVERVIEW
- TABLE 183 JOHNSON CONTROLS: PRODUCTS/SOLUTIONS/SERVICES OFFERED
- TABLE 184 JOHNSON CONTROLS: PRODUCT LAUNCHES
- TABLE 185 JOHNSON CONTROLS: DEALS
- TABLE 186 HONEYWELL INTERNATIONAL INC.: COMPANY OVERVIEW
- TABLE 187 HONEYWELL INTERNATIONAL INC.: PRODUCTS/SOLUTIONS/SERVICES OFFERED
- TABLE 188 HONEYWELL INTERNATIONAL INC.: PRODUCT LAUNCHES
- TABLE 189 HONEYWELL INTERNATIONAL INC.: DEALS
- TABLE 190 ROBERT BOSCH GMBH: COMPANY OVERVIEW
- TABLE 191 ROBERT BOSCH GMBH: PRODUCTS/SOLUTIONS/SERVICES OFFERED
- TABLE 192 ROBERT BOSCH GMBH: PRODUCT LAUNCHES
- TABLE 193 ROBERT BOSCH GMBH: DEALS
- TABLE 194 ADT SECURITY SERVICES: COMPANY OVERVIEW
- TABLE 195 ADT SECURITY SERVICES: PRODUCTS/SOLUTIONS/SERVICES OFFERED
- TABLE 196 ADT SECURITY SERVICES: PRODUCT LAUNCHES
- TABLE 197 ADT SECURITY SERVICES: DEALS
- TABLE 198 HANGZHOU HIKVISION DIGITAL TECHNOLOGY CO., LTD: COMPANY OVERVIEW
- TABLE 199 HANGZHOU HIKVISION DIGITAL TECHNOLOGY CO., LTD: PRODUCTS/SOLUTIONS/SERVICES OFFERED
- TABLE 200 HANGZHOU HIKVISION DIGITAL TECHNOLOGY CO., LTD: PRODUCT LAUNCHES
- TABLE 201 HANGZHOU HIKVISION DIGITAL TECHNOLOGY CO., LTD.: DEALS
- TABLE 202 AXIS COMMUNICATIONS AB: COMPANY OVERVIEW
- TABLE 203 AXIS COMMUNICATIONS AB.: PRODUCTS/SOLUTIONS/SERVICES OFFERED
- TABLE 204 AXIS COMMUNICATIONS AB: PRODUCT LAUNCHES
- TABLE 205 AXIS COMMUNICATIONS AB: DEALS
- TABLE 206 DAHUA TECHNOLOGY CO., LTD: COMPANY OVERVIEW
- TABLE 207 DAHUA TECHNOLOGY CO., LTD: PRODUCTS/SOLUTIONS/SERVICES OFFERED
- TABLE 208 DAHUA TECHNOLOGY CO., LTD: PRODUCT LAUNCHES
- TABLE 209 SECOM CO., LTD: COMPANY OVERVIEW
- TABLE 210 SECOM CO., LTD: PRODUCTS/SOLUTIONS/SERVICES OFFERED
- TABLE 211 SECOM CO., LTD: PRODUCT LAUNCHES
- TABLE 212 SIEMENS: COMPANY OVERVIEW
- TABLE 213 SIEMENS: PRODUCTS/SOLUTIONS/SERVICES OFFERED
- TABLE 214 ASSA ABLOY.: COMPANY OVERVIEW
- TABLE 215 ASSA ABLOY: PRODUCTS/SOLUTIONS/SERVICES OFFERED
- TABLE 216 ASSA ABLOY: DEALS
- TABLE 217 KEENFINITY: COMPANY OVERVIEW
- TABLE 218 KEENFINITY: PRODUCTS/SOLUTIONS/SERVICES OFFERED
List of Figures
- FIGURE 1 SECURITY SOLUTIONS MARKET SEGMENTATION AND REGIONAL SCOPE
- FIGURE 2 SECURITY SOLUTIONS MARKET: RESEARCH DESIGN
- FIGURE 3 REVENUE GENERATED BY COMPANIES FROM SALES OF SECURITY SYSTEMS
- FIGURE 4 REVENUE GENERATED BY COMPANIES FROM SALES OF SECURITY SERVICES
- FIGURE 5 SECURITY SOLUTIONS MARKET: BOTTOM-UP APPROACH
- FIGURE 6 SECURITY SOLUTIONS MARKET: TOP-DOWN APPROACH
- FIGURE 7 SECURITY SOLUTIONS MARKET: DATA TRIANGULATION
- FIGURE 8 VIDEO SURVEILLANCE SYSTEMS TO EXHIBIT HIGHEST CAGR DURING FORECAST PERIOD
- FIGURE 9 SECURITY SYSTEM INTEGRATION SERVICES SEGMENT TO ACCOUNT FOR LARGEST MARKET SHARE IN 2025
- FIGURE 10 COMMERCIAL SEGMENT TO RECORD HIGHEST CAGR DURING FORECAST PERIOD
- FIGURE 11 ASIA PACIFIC TO EXHIBIT HIGHEST CAGR DURING FORECAST PERIOD
- FIGURE 12 RAPID URBANIZATION AND INVESTMENTS IN SMART INFRASTRUCTURE TO BOOST DEMAND
- FIGURE 13 VIDEO SURVEILANCE SYSTEMS SEGMENT TO CAPTURE LARGEST MARKET SHARE IN 2025
- FIGURE 14 VIDEO SURVEILLANCE SERVICES SEGMENT TO RECORD HIGHEST CAGR DURING FORECAST PERIOD
- FIGURE 15 RESIDENTIAL SEGMENT AND ASIA PACIFIC TO HOLD LARGEST SHARES OF SECURITY SOLUTIONS MARKET IN 2030
- FIGURE 16 SOUTH KOREA TO REGISTER HIGHEST CAGR IN GLOBAL SECURITY SOLUTIONS MARKET FROM 2025 TO 2030
- FIGURE 17 SECURITY SOLUTIONS MARKET: DRIVERS, RESTRAINTS, OPPORTUNITIES, AND CHALLENGES
- FIGURE 18 SECURITY SOLUTIONS MARKET: IMPACT ANALYSIS OF DRIVERS
- FIGURE 19 SECURITY SOLUTIONS MARKET: IMPACT ANALYSIS OF RESTRAINTS
- FIGURE 20 SECURITY SOLUTIONS MARKET: IMPACT ANALYSIS OF OPPORTUNITIES
- FIGURE 21 SECURITY SOLUTIONS MARKET: IMPACT ANALYSIS OF CHALLENGES
- FIGURE 22 SECURITY SOLUTIONS MARKET: VALUE CHAIN ANALYSIS
- FIGURE 23 SECURITY SOLUTIONS MARKET: ECOSYSTEM ANALYSIS
- FIGURE 24 INVESTMENT AND FUNDING SCENARIO, 2024
- FIGURE 25 AVERAGE SELLING PRICE TREND OF SECURITY SOLUTIONS, BY SYSTEM, 2020-2024
- FIGURE 26 AVERAGE SELLING PRICE TREND OF SECURITY SOLUTIONS, BY REGION, 2020-2024
- FIGURE 27 TRENDS/DISRUPTIONS IMPACTING CUSTOMER BUSINESS
- FIGURE 28 SECURITY SOLUTIONS MARKET: PORTER'S FIVE FORCES ANALYSIS
- FIGURE 29 INFLUENCE OF STAKEHOLDERS ON BUYING PROCESS, BY VERTICAL
- FIGURE 30 KEY BUYING CRITERIA FOR VERTICALS
- FIGURE 31 IMPORTS DATA FOR HS CODE 854231-COMPLIANT PRODUCTS, BY KEY COUNTRY, 2020-2024 (USD MILLION)
- FIGURE 32 EXPORT DATA FOR HS CODE 854231-COMPLIANT PRODUCTS, BY COUNTRY, 2020-2024 (USD MILLION)
- FIGURE 33 SECURITY SOLUTIONS MARKET: PATENT ANALYSIS, 2015-2024
- FIGURE 34 IMPACT OF AI ON SECURITY SOLUTIONS MARKET
- FIGURE 35 VIDEO SURVEILLANCE SYSTEMS SEGMENT TO REGISTER HIGHEST CAGR IN SECURITY SOLUTIONS MARKET DURING FORECAST PERIOD
- FIGURE 36 SECURITY SYSTEM INTEGRATION SERVICES SEGMENT TO HOLD LARGEST MARKET SHARE IN 2030
- FIGURE 37 COMMERCIAL SEGMENT TO DOMINATE SECURITY SOLUTIONS MARKET IN 2030
- FIGURE 38 ASIA PACIFIC TO RECORD HIGHEST CAGR DURING FORECAST PERIOD
- FIGURE 39 NORTH AMERICA: SECURITY SOLUTIONS MARKET SNAPSHOT
- FIGURE 40 EUROPE: SECURITY SOLUTIONS MARKET SNAPSHOT
- FIGURE 41 ASIA PACIFIC: SECURITY SOLUTIONS MARKET SNAPSHOT
- FIGURE 42 SECURITY SOLUTIONS MARKET: REVENUE ANALYSIS OF TOP FIVE PLAYERS, 2020-2024
- FIGURE 43 MARKET SHARE ANALYSIS OF KEY PLAYERS OFFERING SYSTEMS IN SECURITY SOLUTIONS MARKET, 2024
- FIGURE 44 MARKET SHARE ANALYSIS OF KEY PLAYERS OFFERING SERVICES IN SECURITY SOLUTIONS MARKET, 2024
- FIGURE 45 COMPANY VALUATION
- FIGURE 46 FINANCIAL METRICS (EV/EBITDA)
- FIGURE 47 BRAND COMPARISON
- FIGURE 48 SECURITY SOLUTIONS MARKET: COMPANY EVALUATION MATRIX (KEY COMPANIES), 2024
- FIGURE 49 SECURITY SOLUTIONS MARKET: COMPANY FOOTPRINT
- FIGURE 50 SECURITY SOLUTIONS MARKET: COMPANY EVALUATION MATRIX (STARTUPS/SMES), 2024
- FIGURE 51 JOHNSON CONTROLS: COMPANY SNAPSHOT
- FIGURE 52 HONEYWELL INTERNATIONAL INC.: COMPANY SNAPSHOT
- FIGURE 53 ROBERT BOSCH GMBH: COMPANY SNAPSHOT
- FIGURE 54 ADT SECURITY SERVICES: COMPANY SNAPSHOT
- FIGURE 55 HANGZHOU HIKVISION DIGITAL TECHNOLOGY CO., LTD: COMPANY SNAPSHOT
- FIGURE 56 SECOM CO., LTD: COMPANY SNAPSHOT
- FIGURE 57 SIEMENS: COMPANY SNAPSHOT
- FIGURE 58 ASSA ABLOY: COMPANY SNAPSHOT

