
PUBLISHER: MarketsandMarkets | PRODUCT CODE: 1928851

PUBLISHER: MarketsandMarkets | PRODUCT CODE: 1928851
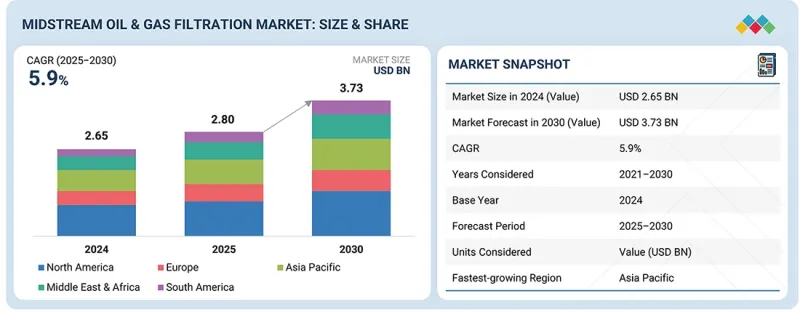
Midstream Oil & Gas Filtration Market by Filter Technology, Filter Media, Application, Filtration Phase, and Region - Global Forecast to 2030
The midstream oil & gas filtration market is projected to grow from USD 2.80 billion in 2025 to USD 3.73 billion by 2030, at a CAGR of 5.9% during the forecast period. Coalescer filter technology is the fastest-growing type in the midstream oil and gas filtration market due to its crucial role in efficiently separating liquid contaminants from gas and hydrocarbon streams. These filters effectively remove fine aerosols, water droplets, and liquid hydrocarbons, enhancing the quality of the gas and protecting downstream equipment such as compressors and pipelines. The high separation efficiency, low pressure drop, and ability to handle large flow rates make coalescer filters ideal for midstream applications like gas processing plants, pipeline networks, and storage terminals.
| Scope of the Report | |
|---|---|
| Years Considered for the Study | 2021-2030 |
| Base Year | 2024 |
| Forecast Period | 2025-2030 |
| Units Considered | Value (USD Billion) |
| Segments | by Filter Technology, Filter Media, Application, Filtration Phase, and Region |
| Regions covered | North America, Asia Pacific, Europe, South America, Middle East & Africa |
Additionally, advancements in coalescer media materials have increased durability and chemical resistance, reducing maintenance requirements and lowering operating costs. Despite these advancements, there remains a growing concern for reliability, regulatory compliance, and asset protection, which continues to drive the use of coalescer filters in midstream oil and gas infrastructure.
''Based on filter media, fiberglass is projected to register the second-fastest growth rate during the forecast period.''
The fiberglass segment is expected to register the second-fastest growth rate in the midstream oil and gas filtration market, in terms of value. This is due to its impressive combination of performance, durability, and cost-effectiveness. Fiberglass media has a large dirt-holding capacity and provides depth filtration, making it highly effective at capturing fine particles and aerosols commonly found in gas and liquid hydrocarbon streams. As a result, applications using fiberglass media offer increased filtration efficiency and extended service life. Furthermore, fiberglass exhibits excellent chemical resistance and thermal stability, allowing it to be used across a wide range of temperatures and pressures. This makes it suitable for demanding conditions in midstream pipelines, compressor stations, and gas processing facilities. Additionally, fiberglass is more affordable compared to expensive synthetic or specialty media while delivering comparable field performance. This makes it particularly popular for large installations. Investment in pipeline and gas infrastructure is a significant factor that will support market growth during the forecast period.
"Based on application, pipeline transportation accounted for the second-largest market share in terms of value."
Pipeline transportation holds the second-largest share of the midstream oil and gas filtration market, primarily due to its critical role in transporting large volumes of crude oil, natural gas, and refined products over long distances. This ensures flow assurance and maintains pipeline integrity. Continuous filtration is essential to remove solids, water, corrosion by-products, and condensates that can lead to erosion, blockages, and internal corrosion. Consequently, there is a constant demand for filters, separators, and coalescers at compressor stations, pump stations, and inlet points. Moreover, the extensive global pipeline network-particularly well developed in North America, the Middle East, and Russia-creates a large installed filtration capacity while still requiring ongoing filter replacements. Additionally, stringent safety regulations and standards regarding pipeline integrity, emissions control, and operational reliability compel operators to invest in high-quality filtration systems. This further strengthens pipeline transportation's prominent position in the market.
"Based on region, Asia Pacific is the second-largest market for midstream oil & gas filtration in terms of value."
The Asia Pacific region is the second-largest market for midstream oil and gas filtration systems, driven by industrialization, urbanization, and rising energy demand in countries like China, India, and those in Southeast Asia. The midstream infrastructure, which includes pipelines, LNG terminals, storage facilities, and gas processing plants, is currently in need of significant investment. This investment is essential to implementing efficient, reliable filtration systems. Additionally, governments in the region are focused on enhancing energy security by promoting natural gas as a cleaner fuel. As a result, pipeline networks and LNG import capacities are expanding. The strong regulatory emphasis on operational efficiency and environmental compliance, coupled with the growing involvement of global oil and gas companies, is driving the rapid growth of advanced filtration technology. Consequently, the Asia Pacific region has become the fastest-growing market for these solutions worldwide.
This study has been validated through primary interviews with industry experts globally. These primary sources have been divided into the following three categories:
- By Company Type: Tier 1 - 60%, Tier 2 - 20%, and Tier 3 - 20%
- By Designation: C Level - 33%, Director Level - 33%, and Managers - 34%
- By Region: North America - 20%, Europe - 25%, Asia Pacific - 25%, Middle East & Africa - 15%, and South America - 15%
The report provides a comprehensive analysis of company profiles on:
Prominent companies are Pall Corporation (US), Jonell Systems (US), Parker Hannifin (US), Eaton (Ireland), Pentair (US), Graver Technologies (US), 3M (US), CECO Environmental (US), FTC Filters (US), Clark Reliance (US), Hilliard Corporation (US), EnerWells (US), Saifilter (China), TM Filtration (US), Brother Filtration (China), Swift Filter (US), Fil-Trek (Canada), and Donaldson (US).
Research Coverage
This research report categorizes the midstream oil & gas filtration market by membrane type (hollow fiber, flat sheet, multi-tubular), system configuration (submerged MBR system, external MBR system), capacity (small capacity, medium capacity, large capacity), application, and region (North America, Europe, Asia Pacific, Middle East & Africa, and South America). The scope of the report includes detailed information on the major factors influencing the growth of the midstream oil & gas filtration market, including drivers, restraints, challenges, and opportunities. A thorough examination of the key industry players has been conducted to provide insights into their business overview, solutions and services, key strategies, contracts, partnerships, and agreements. Product launches, mergers and acquisitions, and recent developments in the midstream oil & gas filtration market are all covered. This report includes a competitive analysis of upcoming startups in the midstream oil & gas filtration market ecosystem.
Reasons to buy this report:
The report will help market leaders/new entrants in this market by providing revenue approximations for the overall midstream oil & gas filtration market and its subsegments. This report will help stakeholders understand the competitive landscape and gain deeper insights to better position their businesses and plan suitable go-to-market strategies. The report also helps stakeholders understand the pulse of the market and provides them with information on key market drivers, restraints, challenges, and opportunities.
The report provides insights on the following pointers:
- Analysis of key drivers (surge in LNG and midstream capacity buildout, aging pipeline & storage infrastructure, shifting production patterns & energy security moves), restraints (CAPEX volatility & project delays reduce equipment orders, high upfront cost and long payback hinder adoption in developing regions, alternative separation technologies and digital solutions create competitive pressure), opportunities (rising hydrocarbon production & associated gas, digitalization, predictive maintenance & analytics for filtration lifecycle monetization, energy transition-new product classes & retrofit demand), and challenges (supply-chain stress, raw-material inflation and delivery lead times, operational challenges-feed variability, fouling, and higher O&M costs).
- Product Development/Innovation: Detailed insights on upcoming technologies, research & development activities, and service launches in the midstream oil & gas filtration market.
- Market Development: Comprehensive information about lucrative markets - the report analyses the midstream oil & gas filtration market across varied regions.
- Market Diversification: Exhaustive information about services, untapped geographies, recent developments, and investments in the midstream oil & gas filtration market.
- Competitive Assessment: In-depth assessment of market shares, growth strategies, and service offerings of leading players like Pall Corporation (US), Jonell Systems (US), Parker Hannifin (US), Eaton (Ireland), Pentair (US), Graver Technologies (US), 3M (US), CECO Environmental (US), FTC Filters (US), Clark Reliance (US), Hilliard Corporation (US), EnerWells (US), Saifilter (China), TM Filtration (US), Brother Filtration (China), Swift Filter (US), Fil-Trek (Canada), and Donaldson (US), among others, in the midstream oil & gas filtration market.
TABLE OF CONTENTS
1 INTRODUCTION
- 1.1 STUDY OBJECTIVES
- 1.2 MARKET DEFINITION
- 1.3 STUDY SCOPE
- 1.3.1 MARKETS COVERED AND REGIONAL SCOPE
- 1.3.2 INCLUSIONS AND EXCLUSIONS
- 1.3.3 YEARS CONSIDERED
- 1.3.4 UNITS CONSIDERED
- 1.4 STAKEHOLDERS
2 EXECUTIVE SUMMARY
- 2.1 KEY INSIGHTS AND MARKET HIGHLIGHTS
- 2.2 KEY MARKET PARTICIPANTS: MAPPING OF STRATEGIC DEVELOPMENTS
- 2.3 DISRUPTIVE TRENDS IN MIDSTREAM OIL & GAS FILTRATION MARKET
- 2.4 HIGH-GROWTH SEGMENTS
- 2.5 REGIONAL SNAPSHOT: MARKET SIZE, GROWTH RATE, AND FORECAST
3 PREMIUM INSIGHTS
- 3.1 ATTRACTIVE OPPORTUNITIES FOR PLAYERS IN MIDSTREAM OIL & GAS FILTRATION MARKET
- 3.2 MIDSTREAM OIL & GAS FILTRATION MARKET, BY FILTER TECHNOLOGY AND REGION
- 3.3 MIDSTREAM OIL & GAS FILTRATION MARKET, BY FILTER MEDIA
- 3.4 MIDSTREAM OIL & GAS FILTRATION MARKET, BY APPLICATION
- 3.5 MIDSTREAM OIL & GAS FILTRATION MARKET, BY FILTRATION PHASE
- 3.6 MIDSTREAM OIL & GAS FILTRATION MARKET, BY COUNTRY
4 MARKET OVERVIEW
- 4.1 INTRODUCTION
- 4.2 MARKET DYNAMICS
- 4.2.1 DRIVERS
- 4.2.1.1 Surge in LNG and midstream capacity buildout
- 4.2.1.2 Aging pipeline & storage infrastructure
- 4.2.1.3 Tightening emissions/methane & air-pollution regulations
- 4.2.1.4 Shifting production patterns & energy security moves
- 4.2.2 RESTRAINTS
- 4.2.2.1 Capex volatility & project delays reduce equipment orders
- 4.2.2.2 High upfront cost and long payback hinder adoption in developing regions
- 4.2.2.3 Alternative separation technologies and digital solutions create competitive pressure
- 4.2.3 OPPORTUNITIES
- 4.2.3.1 Growth in hydrocarbon output and associated gas volumes
- 4.2.3.2 Digitalization, predictive maintenance, and analytics for filtration lifecycle monetization
- 4.2.3.3 Energy transition led product innovation and retrofit demand
- 4.2.4 CHALLENGES
- 4.2.4.1 Supply-chain stress, raw material inflation, and delivery lead times
- 4.2.4.2 Operational challenges such as feed variability, fouling, and higher O&M costs
- 4.2.1 DRIVERS
- 4.3 UNMET NEEDS AND WHITE SPACES
- 4.3.1 UNMET NEEDS IN MIDSTREAM OIL & GAS FILTRATION MARKET
- 4.3.2 WHITE SPACE OPPORTUNITIES
- 4.4 INTERCONNECTED MARKETS AND CROSS-SECTOR OPPORTUNITIES
- 4.4.1 INTERCONNECTED MARKETS
- 4.4.2 CROSS-SECTOR OPPORTUNITIES
- 4.5 EMERGING BUSINESS MODELS AND ECOSYSTEM SHIFTS
- 4.5.1 EMERGING BUSINESS MODELS
- 4.5.2 ECOSYSTEM SHIFTS
- 4.6 STRATEGIC MOVES BY TIER-1/2/3 PLAYERS
- 4.6.1 KEY MOVES AND STRATEGIC FOCUS
5 INDUSTRY TRENDS
- 5.1 PORTER'S FIVE FORCES ANALYSIS
- 5.1.1 THREAT OF NEW ENTRANTS
- 5.1.2 THREAT OF SUBSTITUTES
- 5.1.3 BARGAINING POWER OF SUPPLIERS
- 5.1.4 BARGAINING POWER OF BUYERS
- 5.1.5 INTENSITY OF COMPETITIVE RIVALRY
- 5.2 MACROECONOMICS INDICATORS
- 5.2.1 INTRODUCTION
- 5.2.2 GDP TRENDS AND FORECAST
- 5.3 VALUE CHAIN ANALYSIS
- 5.3.1 RAW MATERIAL SUPPLIERS
- 5.3.2 MANUFACTURERS
- 5.3.3 DISTRIBUTORS
- 5.3.4 END USERS
- 5.4 ECOSYSTEM ANALYSIS
- 5.5 PRICING ANALYSIS
- 5.5.1 PRICING TREND OF MIDSTREAM OIL & GAS FILTRATION SYSTEMS, BY FILTER TECHNOLOGY, 2022-2024
- 5.5.2 PRICING RANGE OF MIDSTREAM OIL & GAS FILTRATION SYSTEMS, BY REGION, 2024
- 5.6 TRADE ANALYSIS
- 5.6.1 IMPORT SCENARIO (HS CODE 842199)
- 5.6.2 EXPORT SCENARIO (HS CODE 842199)
- 5.7 KEY CONFERENCES AND EVENTS, 2025-2026
- 5.8 TRENDS/DISRUPTIONS IMPACTING CUSTOMER BUSINESS
- 5.9 INVESTMENT AND FUNDING SCENARIO
- 5.10 CASE STUDY ANALYSIS
- 5.10.1 NORTH AMERICAN NATURAL GAS PIPELINE OPERATOR IMPROVED OPERATIONAL RELIABILITY AND REDUCED DOWNTIME BY IMPLEMENTING MULTI-STAGE FILTRATION SYSTEM
- 5.10.2 JONELL SYSTEMS: IRON SULFIDE (BLACK POWDER) REMOVAL IN NATURAL-GAS PIPELINE
- 5.11 IMPACT OF 2025 US TARIFF - OVERVIEW
- 5.11.1 INTRODUCTION
- 5.11.2 KEY TARIFF RATES
- 5.11.3 PRICE IMPACT ANALYSIS
- 5.11.4 IMPACT ON COUNTRY/REGION
- 5.11.4.1 US
- 5.11.5 IMPACT ON END-USE INDUSTRIES
6 TECHNOLOGICAL ADVANCEMENTS, AI-DRIVEN IMPACTS, PATENTS, INNOVATIONS, AND FUTURE APPLICATIONS
- 6.1 KEY EMERGING TECHNOLOGIES
- 6.1.1 ADVANCED FILTER MEDIA: ELECTROSPUN NANOFIBERS, MOF-ENHANCED MEMBRANES, AND HYBRID ADSORPTIVE COATINGS
- 6.1.2 SMART FILTRATION: AI/IOT FOR PREDICTIVE MAINTENANCE, AUTONOMOUS SELF-CLEANING, AND SYSTEMS OPTIMIZATION
- 6.2 COMPLEMENTARY TECHNOLOGIES
- 6.2.1 ELECTROSTATIC AND ULTRASONIC COALESCENCE
- 6.3 TECHNOLOGY/PRODUCT ROADMAP
- 6.3.1 SHORT-TERM ROADMAP: PILOT DEPLOYMENT AND DIGITAL FOUNDATIONS
- 6.3.2 MID-TERM ROADMAP: SCALE-UP, SMART FILTRATION, & AUTOMATION
- 6.3.3 LONG-TERM ROADMAP: FULL AUTOMATION, DIGITAL TWINS, & OUTCOME-BASED MODELS
- 6.4 PATENT ANALYSIS
- 6.4.1 INTRODUCTION
- 6.4.2 LEGAL STATUS OF PATENTS
- 6.4.3 JURISDICTION ANALYSIS
- 6.5 FUTURE APPLICATIONS
- 6.5.1 HYDROGEN AND LOW-CARBON FUEL TRANSPORTATION FILTRATION
- 6.5.2 LNG AND SMALL-SCALE MODULAR GAS PROCESSING UNITS
- 6.5.3 CARBON CAPTURE, UTILIZATION, & STORAGE (CCUS) TRANSPORT FILTRATION
- 6.5.4 DIGITAL TWIN-DRIVEN AUTONOMOUS COMPRESSOR STATIONS
- 6.5.5 RENEWABLE NATURAL GAS (RNG) AND BIOGAS PIPELINE INJECTION
- 6.6 IMPACT OF AI/GEN AI ON MIDSTREAM OIL & GAS FILTRATION MARKET
- 6.6.1 TOP USE CASES AND MARKET POTENTIAL
- 6.6.2 BEST PRACTICES IN MIDSTREAM OIL & GAS FILTRATION PROCESSING
- 6.6.3 CASE STUDIES OF AI IMPLEMENTATION IN MIDSTREAM OIL & GAS FILTRATION MARKET
- 6.6.4 INTERCONNECTED ADJACENT ECOSYSTEM AND IMPACT ON MARKET PLAYERS
- 6.6.5 CLIENTS' READINESS TO ADOPT GENERATIVE AI IN MIDSTREAM OIL & GAS FILTRATION MARKET
7 REGULATORY LANDSCAPE AND SUSTAINABILITY INITIATIVES
- 7.1 REGIONAL REGULATIONS AND COMPLIANCE
- 7.1.1 REGULATORY BODIES, GOVERNMENT AGENCIES, AND OTHER ORGANIZATIONS
- 7.1.2 INDUSTRY STANDARDS
- 7.2 SUSTAINABILITY INITIATIVES
- 7.3 SUSTAINABILITY IMPACT AND REGULATORY POLICY INITIATIVES
- 7.4 CERTIFICATIONS, LABELING, AND ECO-STANDARDS
8 CUSTOMER LANDSCAPE & BUYER BEHAVIOR
- 8.1 DECISION-MAKING PROCESS
- 8.2 KEY STAKEHOLDERS AND BUYING CRITERIA
- 8.2.1 KEY STAKEHOLDERS IN BUYING PROCESS
- 8.2.2 BUYING CRITERIA
- 8.3 ADOPTION BARRIERS & INTERNAL CHALLENGES
- 8.4 UNMET NEEDS IN VARIOUS END-USE INDUSTRIES
9 MIDSTREAM OIL & GAS FILTRATION MARKET, BY FILTER TECHNOLOGY
- 9.1 INTRODUCTION
- 9.2 COALESCER FILTERS
- 9.2.1 IMPROVED DOWNSTREAM EQUIPMENT RELIABILITY AND COMPLIANCE WITH QUALITY SPECIFICATIONS TO DRIVE MARKET
- 9.3 CARTRIDGE FILTERS
- 9.3.1 STRENGTHENING OPERATIONAL RELIABILITY WITH HIGH-PRECISION FINE PARTICULATE FILTRATION TO PROPEL MARKET
- 9.4 MECHANICAL FILTERS
- 9.4.1 ENSURING PIPELINE INTEGRITY VIA ROBUST BULK SOLID REMOVAL SOLUTIONS TO SUPPORT MARKET GROWTH
- 9.5 BAG FILTERS
- 9.5.1 LOWER FILTRATION COSTS WITH HIGH-FLOW, HIGH-CAPACITY PARTICULATE HANDLING-KEY FACTOR DRIVING MARKET GROWTH
- 9.6 PARTICULATE FILTERS
- 9.6.1 MAXIMIZING EQUIPMENT LIFESPAN THROUGH HIGH-EFFICIENCY PARTICLE CONTROL TO DRIVE MARKET
- 9.7 ACTIVATED CARBON FILTERS
- 9.7.1 IMPROVED PRODUCT PURITY AND EMISSIONS COMPLIANCE THROUGH ADVANCED ADSORPTION TECHNOLOGIES TO PROPEL MARKET
- 9.8 STRAINERS
- 9.8.1 ENHANCING SYSTEM PROTECTION THROUGH FIRST-LINE DEFENSE AGAINST LARGE DEBRIS TO DRIVE MARKET
- 9.9 OTHER FILTER TECHNOLOGIES
10 MIDSTREAM OIL & GAS FILTRATION MARKET, BY FILTER MEDIA
- 10.1 INTRODUCTION
- 10.2 ACTIVATED CARBON
- 10.2.1 STRICTER VOC, H2S, AND EMISSIONS CONTROL REGULATIONS ACROSS MIDSTREAM OPERATIONS TO DRIVE MARKET
- 10.3 METALLIC
- 10.3.1 NEED FOR HIGH-TEMPERATURE, HIGH-PRESSURE, AND CORROSION-RESISTANT FILTRATION SOLUTIONS TO PROPEL MARKET
- 10.4 SYNTHETIC POLYMER
- 10.4.1 MOST WIDELY USED FILTRATION MATERIAL IN MIDSTREAM OIL & GAS OPERATIONS
- 10.5 FIBERGLASS
- 10.5.1 RISING REQUIREMENTS FOR ULTRA-FINE AEROSOL AND SUB-MICRON GAS FILTRATION IN COMPRESSOR PROTECTION TO DRIVE MARKET
- 10.6 OTHER FILTER MEDIA
11 MIDSTREAM OIL & GAS FILTRATION MARKET, BY APPLICATION
- 11.1 INTRODUCTION
- 11.2 GAS PROCESSING PLANTS
- 11.2.1 NEED FOR HIGH-PERFORMANCE, MULTI-STAGE FILTRATION SYSTEMS TO DRIVE MARKET
- 11.3 COMPRESSION STATIONS
- 11.3.1 NEED TO PROTECT HIGH-VALUE COMPRESSORS FROM CONTAMINATION AND WEAR TO PROPEL MARKET
- 11.4 STORAGE & DISTRIBUTION
- 11.4.1 RISING FUEL QUALITY STANDARDS AND TERMINAL AUTOMATION INITIATIVES TO DRIVE MARKET
- 11.5 PIPELINE TRANSPORTATION
- 11.5.1 NEED FOR CONTINUOUS FLOW ASSURANCE AND PIPELINE ASSET PROTECTION TO DRIVE MARKET
- 11.6 LNG PROCESSING
- 11.6.1 RISE IN GLOBAL LNG TRADE TO DRIVE MARKET
- 11.7 OTHER APPLICATIONS
12 MIDSTREAM OIL & GAS FILTRATION MARKET, BY FILTRATION PHASE
- 12.1 INTRODUCTION
- 12.2 OIL FILTRATION
- 12.2.1 RISING NEED FOR CLEAN CRUDE AND REFINED PRODUCT FLOW IN LONG-DISTANCE PIPELINES TO PROPEL MARKET
- 12.3 GAS FILTRATION
- 12.3.1 EXPANSION OF HIGH-PRESSURE GAS TRANSMISSION AND LNG FEED GAS INFRASTRUCTURE TO DRIVE MARKET
13 MIDSTREAM OIL & GAS FILTRATION MARKET, BY END USER
- 13.1 INTRODUCTION
- 13.2 REFINERIES
- 13.3 PETROCHEMICAL INDUSTRY
14 MIDSTREAM OIL & GAS FILTRATION MARKET, BY REGION
- 14.1 INTRODUCTION
- 14.2 NORTH AMERICA
- 14.2.1 US
- 14.2.1.1 Surging LNG capacity to drive sustained growth in midstream filtration systems
- 14.2.2 CANADA
- 14.2.2.1 LNG buildout to catalyze demand for high-performance midstream filtration and tertiary water treatment
- 14.2.3 MEXICO
- 14.2.3.1 Pemex deepwater investment and pipeline modernization to drive urgent demand for high-pressure filtration
- 14.2.1 US
- 14.3 EUROPE
- 14.3.1 GERMANY
- 14.3.1.1 Rapid LNG terminal buildout to boost demand for cryogenic and pre-treatment filtration
- 14.3.2 UK
- 14.3.2.1 Gas system reforms and resilience planning to drive upgrades in midstream filtration and monitoring
- 14.3.3 FRANCE
- 14.3.3.1 Growing LNG import mix and storage strategy to increase demand for cryogenic and metering filtration
- 14.3.4 ITALY
- 14.3.4.1 Rapid LNG import growth to drive investment in pre-treatment and cryogenic filtration
- 14.3.5 RUSSIA
- 14.3.5.1 Large domestic pipeline network to sustain strong demand for high-pressure filtration and integrity solutions
- 14.3.6 REST OF EUROPE
- 14.3.1 GERMANY
- 14.4 ASIA PACIFIC
- 14.4.1 CHINA
- 14.4.1.1 Pipeline density and storage expansion to power China's midstream filtration demand
- 14.4.2 INDIA
- 14.4.2.1 National pipeline interconnectivity and city gas distribution to drive filtration growth
- 14.4.3 JAPAN
- 14.4.3.1 Terminal modernization and carbon-control systems to propel filtration investment
- 14.4.4 AUSTRALIA
- 14.4.4.1 Produced-water management and long-distance pipeline protection to drive filtration demand
- 14.4.5 SOUTH KOREA
- 14.4.5.1 Energy security policies and infrastructure resilience to increase filtration spending
- 14.4.6 REST OF ASIA PACIFIC
- 14.4.1 CHINA
- 14.5 MIDDLE EAST & AFRICA
- 14.5.1 SAUDI ARABIA
- 14.5.1.1 Jafurah and main-network upgrades to drive demand for high-pressure and cryogenic filtration
- 14.5.2 UAE
- 14.5.2.1 Pipeline extensions and strategic midstream pacts to accelerate filtration capex and aftermarket spend
- 14.5.3 SOUTH AFRICA
- 14.5.3.1 Gas masterplan implementation and onshore industrialization to drive filtration demand
- 14.5.4 REST OF MIDDLE EAST & AFRICA
- 14.5.1 SAUDI ARABIA
- 14.6 SOUTH AMERICA
- 14.6.1 BRAZIL
- 14.6.1.1 Pre-salt ramp-up and offshore maintenance cycles to drive strong demand for high-pressure and cryogenic filtration
- 14.6.2 ARGENTINA
- 14.6.2.1 Vaca Muerta's scale-up and new evacuation pipelines to catalyze midstream filtration investment
- 14.6.3 REST OF SOUTH AMERICA
- 14.6.1 BRAZIL
15 COMPETITIVE LANDSCAPE
- 15.1 OVERVIEW
- 15.2 KEY PLAYER STRATEGIES/RIGHT TO WIN
- 15.2.1 OVERVIEW OF STRATEGIES ADOPTED BY KEY PLAYERS IN MIDSTREAM OIL & GAS FILTRATION MARKET BETWEEN JANUARY 2020 AND NOVEMBER 2025
- 15.3 REVENUE ANALYSIS, 2022-2024
- 15.4 MARKET SHARE ANALYSIS, 2024
- 15.4.1 PARKER HANNIFIN
- 15.4.2 EATON
- 15.4.3 PALL CORPORATION
- 15.4.4 3M
- 15.4.5 PENTAIR
- 15.5 COMPANY VALUATION AND FINANCIAL METRICS
- 15.6 BRAND/PRODUCT COMPARISON ANALYSIS
- 15.6.1 PALL CORPORATION
- 15.6.2 PARKER HANNIFIN
- 15.6.3 EATON
- 15.6.4 PENTAIR
- 15.7 COMPANY EVALUATION MATRIX: KEY PLAYERS, 2024
- 15.7.1 STARS
- 15.7.2 EMERGING LEADERS
- 15.7.3 PERVASIVE PLAYERS
- 15.7.4 PARTICIPANTS
- 15.7.5 COMPANY FOOTPRINT: KEY PLAYERS, 2024
- 15.7.5.1 Company footprint
- 15.7.5.2 Region footprint
- 15.7.5.3 Filter technology footprint
- 15.7.5.4 Filter media footprint
- 15.7.5.5 Application footprint
- 15.7.5.6 Filtration phase footprint
- 15.8 COMPANY EVALUATION MATRIX: STARTUPS/SMES, 2024
- 15.8.1 PROGRESSIVE COMPANIES
- 15.8.2 RESPONSIVE COMPANIES
- 15.8.3 DYNAMIC COMPANIES
- 15.8.4 STARTING BLOCKS
- 15.8.5 COMPETITIVE BENCHMARKING: KEY STARTUPS/SMES, 2024
- 15.8.5.1 Detailed list of key startups/SMEs
- 15.8.5.2 Competitive benchmarking of key startups/SMEs
- 15.9 COMPETITIVE SCENARIO
- 15.9.1 PRODUCT LAUNCHES
- 15.9.2 DEALS
- 15.9.3 EXPANSIONS
- 15.9.4 OTHER DEVELOPMENTS
16 COMPANY PROFILES
- 16.1 KEY PLAYERS
- 16.1.1 PALL CORPORATION
- 16.1.1.1 Business overview
- 16.1.1.2 Products/Solutions/Services offered
- 16.1.1.3 Recent developments
- 16.1.1.3.1 Product launches
- 16.1.1.3.2 Expansions
- 16.1.1.3.3 Other developments
- 16.1.1.4 MnM view
- 16.1.1.4.1 Key strengths
- 16.1.1.4.2 Strategic choices
- 16.1.1.4.3 Weaknesses and competitive threats
- 16.1.2 JONELL SYSTEMS
- 16.1.2.1 Business overview
- 16.1.2.2 Products/Solutions/Services offered
- 16.1.2.3 MnM view
- 16.1.2.3.1 Key strengths
- 16.1.2.3.2 Strategic choices
- 16.1.2.3.3 Weaknesses and competitive threats
- 16.1.3 PARKER HANNIFIN
- 16.1.3.1 Business overview
- 16.1.3.2 Products/Solutions/Services offered
- 16.1.3.3 Recent developments
- 16.1.3.3.1 Deals
- 16.1.3.4 MnM view
- 16.1.3.4.1 Key strengths
- 16.1.3.4.2 Strategic choices
- 16.1.3.4.3 Weaknesses and competitive threats
- 16.1.4 EATON
- 16.1.4.1 Business overview
- 16.1.4.2 Products/Solutions/Services offered
- 16.1.4.3 Recent developments
- 16.1.4.3.1 Product launches
- 16.1.4.3.2 Expansions
- 16.1.4.4 MnM view
- 16.1.4.4.1 Key strengths
- 16.1.4.4.2 Strategic choices
- 16.1.4.4.3 Weaknesses and competitive threats
- 16.1.5 PENTAIR
- 16.1.5.1 Business overview
- 16.1.5.2 Products/Solutions/Services offered
- 16.1.5.3 MnM view
- 16.1.5.3.1 Key strengths
- 16.1.5.3.2 Strategic choices
- 16.1.5.3.3 Weaknesses and competitive threats
- 16.1.6 GRAVER TECHNOLOGIES
- 16.1.6.1 Business overview
- 16.1.6.2 Products/Solutions/Services offered
- 16.1.6.3 MnM view
- 16.1.6.3.1 Key strengths
- 16.1.6.3.2 Strategic choices
- 16.1.6.3.3 Weaknesses and competitive threats
- 16.1.7 3M
- 16.1.7.1 Business overview
- 16.1.7.2 Products/Solutions/Services offered
- 16.1.7.3 Recent developments
- 16.1.7.3.1 Deals
- 16.1.7.4 MnM view
- 16.1.7.4.1 Key strengths
- 16.1.7.4.2 Strategic choices
- 16.1.7.4.3 Weaknesses and competitive threats
- 16.1.8 CECO ENVIRONMENTAL
- 16.1.8.1 Business overview
- 16.1.8.2 Products/Solutions/Services offered
- 16.1.8.3 Recent developments
- 16.1.8.3.1 Deals
- 16.1.8.4 MnM view
- 16.1.8.4.1 Key strengths
- 16.1.8.4.2 Strategic choices
- 16.1.8.4.3 Weaknesses and competitive threats
- 16.1.9 FTC FILTERS
- 16.1.9.1 Business overview
- 16.1.9.2 Products/Solutions/Services offered
- 16.1.9.3 MnM view
- 16.1.9.3.1 Key strengths
- 16.1.9.3.2 Strategic choices
- 16.1.9.3.3 Weaknesses and competitive threats
- 16.1.10 CLARK-RELIANCE
- 16.1.10.1 Business overview
- 16.1.10.2 Products/Solutions/Services offered
- 16.1.10.3 MnM view
- 16.1.10.3.1 Key strengths
- 16.1.10.3.2 Strategic choices
- 16.1.10.3.3 Weaknesses and competitive threats
- 16.1.11 HILLIARD CORPORATION
- 16.1.11.1 Business overview
- 16.1.11.2 Products/Solutions/Services offered
- 16.1.11.3 MnM view
- 16.1.11.3.1 Key strengths
- 16.1.11.3.2 Strategic choices
- 16.1.11.3.3 Weaknesses and competitive threats
- 16.1.12 ENERWELLS
- 16.1.12.1 Business overview
- 16.1.12.2 Products/Solutions/Services offered
- 16.1.12.3 MnM view
- 16.1.12.3.1 Key strengths
- 16.1.12.3.2 Strategic choices
- 16.1.12.3.3 Weaknesses and competitive threats
- 16.1.13 SAIFILTER
- 16.1.13.1 Business overview
- 16.1.13.2 Products/Solutions/Services offered
- 16.1.13.3 MnM view
- 16.1.13.3.1 Key strengths
- 16.1.13.3.2 Strategic choices
- 16.1.13.3.3 Weaknesses and competitive threats
- 16.1.14 TM FILTRATION
- 16.1.14.1 Business overview
- 16.1.14.2 Products/Solutions/Services offered
- 16.1.14.3 MnM view
- 16.1.14.3.1 Key strengths
- 16.1.14.3.2 Strategic choices
- 16.1.14.3.3 Weaknesses and competitive threats
- 16.1.15 BROTHER FILTRATION
- 16.1.15.1 Business overview
- 16.1.15.2 Products/Solutions/Services offered
- 16.1.15.3 MnM view
- 16.1.15.3.1 Key strengths
- 16.1.15.3.2 Strategic choices
- 16.1.15.3.3 Weaknesses and competitive threats
- 16.1.16 SWIFT FILTER
- 16.1.16.1 Business overview
- 16.1.16.2 Products/Solutions/Services offered
- 16.1.16.3 MnM view
- 16.1.16.3.1 Key strengths
- 16.1.16.3.2 Strategic choices
- 16.1.16.3.3 Weaknesses and competitive threats
- 16.1.17 FIL-TREK
- 16.1.17.1 Business overview
- 16.1.17.2 Products/Solutions/Services offered
- 16.1.17.3 MnM view
- 16.1.18 DONALDSON
- 16.1.18.1 Business overview
- 16.1.18.2 Products/Solutions/Services offered
- 16.1.18.3 MnM view
- 16.1.18.3.1 Key strengths
- 16.1.18.3.2 Strategic choices
- 16.1.18.3.3 Weaknesses and competitive threats
- 16.1.1 PALL CORPORATION
- 16.2 OTHER PLAYERS
- 16.2.1 PS FILTER
- 16.2.2 SMITHS GROUP
- 16.2.3 CRITICAL PROCESS FILTRATION
- 16.2.4 HOFF ENGINEERING
- 16.2.5 CLEANOVA
- 16.2.6 NORMAN FILTER COMPANY
- 16.2.7 COLEMAN FILTER COMPANY
- 16.2.8 FILTERS S.P.A
- 16.2.9 FILTER SCIENCES
- 16.2.10 CHASE FILTERS
- 16.2.11 MUELLER ENVIRONMENTAL
- 16.2.12 KINGTOOL
- 16.2.13 GAS TECH
- 16.2.14 ROYAL PRODUCTS
17 RESEARCH METHODOLOGY
- 17.1 RESEARCH DATA
- 17.1.1 SECONDARY DATA
- 17.1.1.1 List of key secondary sources
- 17.1.1.2 Key data from secondary sources
- 17.1.2 PRIMARY DATA
- 17.1.2.1 Key data from primary sources
- 17.1.2.2 List of primary interview participants-demand and supply sides
- 17.1.2.3 Breakdown of primary interviews
- 17.1.2.4 Key industry insights
- 17.1.1 SECONDARY DATA
- 17.2 MARKET SIZE ESTIMATION
- 17.2.1 BOTTOM-UP APPROACH
- 17.2.2 TOP-DOWN APPROACH
- 17.3 BASE NUMBER CALCULATION
- 17.3.1 APPROACH 1: SUPPLY-SIDE ANALYSIS
- 17.3.2 APPROACH 2: DEMAND-SIDE ANALYSIS
- 17.4 MARKET FORECAST APPROACH
- 17.4.1 SUPPLY SIDE
- 17.4.2 DEMAND SIDE
- 17.5 DATA TRIANGULATION
- 17.6 FACTOR ANALYSIS
- 17.7 RESEARCH ASSUMPTIONS
- 17.8 LIMITATIONS
18 APPENDIX
- 18.1 DISCUSSION GUIDE
- 18.2 KNOWLEDGESTORE: MARKETSANDMARKETS' SUBSCRIPTION PORTAL
- 18.3 CUSTOMIZATION OPTIONS
- 18.4 RELATED REPORTS
- 18.5 AUTHOR DETAILS
List of Tables
- TABLE 1 MIDSTREAM OIL & GAS FILTRATION MARKET: INCLUSIONS AND EXCLUSIONS
- TABLE 2 MIDSTREAM OIL & GAS FILTRATION MARKET: IMPACT OF PORTER'S FIVE FORCES ANALYSIS
- TABLE 3 GDP PERCENTAGE CHANGE, BY KEY COUNTRY, 2021-2029
- TABLE 4 PRICING TREND OF MIDSTREAM OIL & GAS FILTRATION TECHNOLOGIES, 2022-2024 (USD)
- TABLE 5 PRICING RANGE OF MIDSTREAM OIL & GAS FILTRATION SYSTEMS, BY REGION, 2024 (USD)
- TABLE 6 IMPORT DATA FOR HS CODE 842199-COMPLIANT PRODUCTS, 2020-2024 (USD THOUSAND)
- TABLE 7 EXPORT DATA FOR HS CODE 842199-COMPLIANT PRODUCTS, 2020-2024 (USD THOUSAND)
- TABLE 8 MIDSTREAM OIL & GAS FILTRATION MARKET: LIST OF KEY CONFERENCES AND EVENTS, 2025-2026
- TABLE 9 US ADJUSTED RECIPROCAL TARIFF RATES
- TABLE 10 TOP USE CASES AND MARKET POTENTIAL
- TABLE 11 BEST PRACTICES: NOTABLE INDUSTRY PRACTICES BY LEADING COMPANIES
- TABLE 12 MIDSTREAM OIL & GAS FILTRATION MARKET: CASE STUDIES RELATED TO GEN AI IMPLEMENTATION
- TABLE 13 INTERCONNECTED ADJACENT ECOSYSTEM AND IMPACT ON MARKET PLAYERS
- TABLE 14 NORTH AMERICA: REGULATORY BODIES, GOVERNMENT AGENCIES, AND OTHER ORGANIZATIONS
- TABLE 15 EUROPE: REGULATORY BODIES, GOVERNMENT AGENCIES, AND OTHER ORGANIZATIONS
- TABLE 16 ASIA PACIFIC: REGULATORY BODIES, GOVERNMENT AGENCIES, AND OTHER ORGANIZATIONS
- TABLE 17 GLOBAL STANDARDS IN MIDSTREAM OIL & GAS FILTRATION MARKET
- TABLE 18 CERTIFICATIONS, LABELING, AND ECO-STANDARDS IN MIDSTREAM OIL & GAS FILTRATION MARKET
- TABLE 19 INFLUENCE OF STAKEHOLDERS ON BUYING PROCESS, BY APPLICATION (%)
- TABLE 20 KEY BUYING CRITERIA, BY APPLICATION
- TABLE 21 MIDSTREAM OIL & GAS FILTRATION MARKET: UNMET NEEDS IN KEY END-USE INDUSTRIES
- TABLE 22 MIDSTREAM OIL & GAS FILTRATION MARKET, BY FILTER TECHNOLOGY, 2021-2024 (USD MILLION)
- TABLE 23 MIDSTREAM OIL & GAS FILTRATION MARKET, BY FILTER TECHNOLOGY, 2025-2030 (USD MILLION)
- TABLE 24 MIDSTREAM OIL & GAS FILTRATION MARKET, BY FILTER MEDIA, 2021-2024 (USD MILLION)
- TABLE 25 MIDSTREAM OIL & GAS FILTRATION MARKET, BY FILTER MEDIA, 2025-2030 (USD MILLION)
- TABLE 26 MIDSTREAM OIL & GAS FILTRATION MARKET, BY APPLICATION, 2021-2024 (USD MILLION)
- TABLE 27 MIDSTREAM OIL & GAS FILTRATION MARKET, BY APPLICATION, 2025-2030 (USD MILLION)
- TABLE 28 MIDSTREAM OIL & GAS FILTRATION MARKET, BY FILTRATION PHASE, 2021-2024 (USD MILLION)
- TABLE 29 MIDSTREAM OIL & GAS FILTRATION MARKET, BY FILTRATION PHASE, 2025-2030 (USD MILLION)
- TABLE 30 MIDSTREAM OIL & GAS FILTRATION MARKET, BY REGION, 2021-2024 (USD MILLION)
- TABLE 31 MIDSTREAM OIL & GAS FILTRATION MARKET, BY REGION, 2025-2030 (USD MILLION)
- TABLE 32 NORTH AMERICA: MIDSTREAM OIL & GAS FILTRATION MARKET, BY COUNTRY, 2021-2024 (USD MILLION)
- TABLE 33 NORTH AMERICA: MIDSTREAM OIL & GAS FILTRATION MARKET, BY COUNTRY, 2025-2030 (USD MILLION)
- TABLE 34 NORTH AMERICA: MIDSTREAM OIL & GAS FILTRATION MARKET, BY FILTER TECHNOLOGY, 2021-2024 (USD MILLION)
- TABLE 35 NORTH AMERICA: MIDSTREAM OIL & GAS FILTRATION MARKET, BY FILTER TECHNOLOGY, 2025-2030 (USD MILLION)
- TABLE 36 NORTH AMERICA: MIDSTREAM OIL & GAS FILTRATION MARKET, BY FILTER MEDIA, 2021-2024 (USD MILLION)
- TABLE 37 NORTH AMERICA: MIDSTREAM OIL & GAS FILTRATION MARKET, BY FILTER MEDIA, 2025-2030 (USD MILLION)
- TABLE 38 NORTH AMERICA: MIDSTREAM OIL & GAS FILTRATION MARKET, BY APPLICATION, 2021-2024 (USD MILLION)
- TABLE 39 NORTH AMERICA: MIDSTREAM OIL & GAS FILTRATION MARKET, BY APPLICATION, 2025-2030 (USD MILLION)
- TABLE 40 NORTH AMERICA: MIDSTREAM OIL & GAS FILTRATION MARKET, BY FILTRATION PHASE, 2021-2024 (USD MILLION)
- TABLE 41 NORTH AMERICA: MIDSTREAM OIL & GAS FILTRATION MARKET, BY FILTRATION PHASE, 2025-2030 (USD MILLION)
- TABLE 42 US: MIDSTREAM OIL & GAS FILTRATION MARKET, BY END USER, 2021-2024 (USD MILLION)
- TABLE 43 US: MIDSTREAM OIL & GAS FILTRATION MARKET, BY END USER, 2025-2030 (USD MILLION)
- TABLE 44 CANADA: MIDSTREAM OIL & GAS FILTRATION MARKET, BY END USER, 2021-2024 (USD MILLION)
- TABLE 45 CANADA: MIDSTREAM OIL & GAS FILTRATION MARKET, BY END USER, 2025-2030 (USD MILLION)
- TABLE 46 MEXICO: MIDSTREAM OIL & GAS FILTRATION MARKET, BY END USER, 2021-2024 (USD MILLION)
- TABLE 47 MEXICO: MIDSTREAM OIL & GAS FILTRATION MARKET, BY END USER, 2025-2030 (USD MILLION)
- TABLE 48 EUROPE: MIDSTREAM OIL & GAS FILTRATION MARKET, BY COUNTRY, 2021-2024 (USD MILLION)
- TABLE 49 EUROPE: MIDSTREAM OIL & GAS FILTRATION MARKET, BY COUNTRY, 2025-2030 (USD MILLION)
- TABLE 50 EUROPE: MIDSTREAM OIL & GAS FILTRATION MARKET, BY FILTER TECHNOLOGY, 2021-2024 (USD MILLION)
- TABLE 51 EUROPE: MIDSTREAM OIL & GAS FILTRATION MARKET, BY FILTER TECHNOLOGY, 2025-2030 (USD MILLION)
- TABLE 52 EUROPE: MIDSTREAM OIL & GAS FILTRATION MARKET, BY FILTER MEDIA, 2021-2024 (USD MILLION)
- TABLE 53 EUROPE: MIDSTREAM OIL & GAS FILTRATION MARKET, BY FILTER MEDIA, 2025-2030 (USD MILLION)
- TABLE 54 EUROPE: MIDSTREAM OIL & GAS FILTRATION MARKET, BY APPLICATION, 2021-2024 (USD MILLION)
- TABLE 55 EUROPE: MIDSTREAM OIL & GAS FILTRATION MARKET, BY APPLICATION, 2025-2030 (USD MILLION)
- TABLE 56 EUROPE: MIDSTREAM OIL & GAS FILTRATION MARKET, BY FILTRATION PHASE, 2021-2024 (USD MILLION)
- TABLE 57 EUROPE: MIDSTREAM OIL & GAS FILTRATION MARKET, BY FILTRATION PHASE, 2025-2030 (USD MILLION)
- TABLE 58 GERMANY: MIDSTREAM OIL & GAS FILTRATION MARKET, BY END USER, 2021-2024 (USD MILLION)
- TABLE 59 GERMANY: MIDSTREAM OIL & GAS FILTRATION MARKET, BY END USER, 2025-2030 (USD MILLION)
- TABLE 60 UK: MIDSTREAM OIL & GAS FILTRATION MARKET, BY END USER, 2021-2024 (USD MILLION)
- TABLE 61 UK: MIDSTREAM OIL & GAS FILTRATION MARKET, BY END USER, 2025-2030 (USD MILLION)
- TABLE 62 FRANCE: MIDSTREAM OIL & GAS FILTRATION MARKET, BY END USER, 2021-2024 (USD MILLION)
- TABLE 63 FRANCE: MIDSTREAM OIL & GAS FILTRATION MARKET, BY END USER, 2025-2030 (USD MILLION)
- TABLE 64 ITALY: MIDSTREAM OIL & GAS FILTRATION MARKET, BY END USER, 2021-2024 (USD MILLION)
- TABLE 65 ITALY: MIDSTREAM OIL & GAS FILTRATION MARKET, BY END USER, 2025-2030 (USD MILLION)
- TABLE 66 RUSSIA: MIDSTREAM OIL & GAS FILTRATION MARKET, BY END USER, 2021-2024 (USD MILLION)
- TABLE 67 RUSSIA: MIDSTREAM OIL & GAS FILTRATION MARKET, BY END USER, 2025-2030 (USD MILLION)
- TABLE 68 REST OF EUROPE: MIDSTREAM OIL & GAS FILTRATION MARKET, BY END USER, 2021-2024 (USD MILLION)
- TABLE 69 REST OF EUROPE: MIDSTREAM OIL & GAS FILTRATION MARKET, BY END USER, 2025-2030 (USD MILLION)
- TABLE 70 ASIA PACIFIC: MIDSTREAM OIL & GAS FILTRATION MARKET, BY COUNTRY, 2021-2024 (USD MILLION)
- TABLE 71 ASIA PACIFIC: MIDSTREAM OIL & GAS FILTRATION MARKET, BY COUNTRY, 2025-2030 (USD MILLION)
- TABLE 72 ASIA PACIFIC: MIDSTREAM OIL & GAS FILTRATION MARKET, BY FILTER TECHNOLOGY, 2021-2024 (USD MILLION)
- TABLE 73 ASIA PACIFIC: MIDSTREAM OIL & GAS FILTRATION MARKET, BY FILTER TECHNOLOGY, 2025-2030 (USD MILLION)
- TABLE 74 ASIA PACIFIC: MIDSTREAM OIL & GAS FILTRATION MARKET, BY FILTER MEDIA, 2021-2024 (USD MILLION)
- TABLE 75 ASIA PACIFIC: MIDSTREAM OIL & GAS FILTRATION MARKET, BY FILTER MEDIA, 2025-2030 (USD MILLION)
- TABLE 76 ASIA PACIFIC: MIDSTREAM OIL & GAS FILTRATION MARKET, BY APPLICATION, 2021-2024 (USD MILLION)
- TABLE 77 ASIA PACIFIC: MIDSTREAM OIL & GAS FILTRATION MARKET, BY APPLICATION, 2025-2030 (USD MILLION)
- TABLE 78 ASIA PACIFIC: MIDSTREAM OIL & GAS FILTRATION MARKET, BY FILTRATION PHASE, 2021-2024 (USD MILLION)
- TABLE 79 ASIA PACIFIC: MIDSTREAM OIL & GAS FILTRATION MARKET, BY FILTRATION PHASE, 2025-2030 (USD MILLION)
- TABLE 80 CHINA: MIDSTREAM OIL & GAS FILTRATION MARKET, BY END USER, 2021-2024 (USD MILLION)
- TABLE 81 CHINA: MIDSTREAM OIL & GAS FILTRATION MARKET, BY END USER, 2025-2030 (USD MILLION)
- TABLE 82 INDIA: MIDSTREAM OIL & GAS FILTRATION MARKET, BY END USER, 2021-2024 (USD MILLION)
- TABLE 83 INDIA: MIDSTREAM OIL & GAS FILTRATION MARKET, BY END USER, 2025-2030 (USD MILLION)
- TABLE 84 JAPAN: MIDSTREAM OIL & GAS FILTRATION MARKET, BY END USER, 2021-2024 (USD MILLION)
- TABLE 85 JAPAN: MIDSTREAM OIL & GAS FILTRATION MARKET, BY END USER, 2025-2030 (USD MILLION)
- TABLE 86 AUSTRALIA: MIDSTREAM OIL & GAS FILTRATION MARKET, BY END USER, 2021-2024 (USD MILLION)
- TABLE 87 AUSTRALIA: MIDSTREAM OIL & GAS FILTRATION MARKET, BY END USER, 2025-2030 (USD MILLION)
- TABLE 88 SOUTH KOREA: MIDSTREAM OIL & GAS FILTRATION MARKET, BY END USER, 2021-2024 (USD MILLION)
- TABLE 89 SOUTH KOREA: MIDSTREAM OIL & GAS FILTRATION MARKET, BY END USER, 2025-2030 (USD MILLION)
- TABLE 90 REST OF ASIA PACIFIC: MIDSTREAM OIL & GAS FILTRATION MARKET, BY END USER, 2021-2024 (USD MILLION)
- TABLE 91 REST OF ASIA PACIFIC: MIDSTREAM OIL & GAS FILTRATION MARKET, BY END USER, 2025-2030 (USD MILLION)
- TABLE 92 MIDDLE EAST & AFRICA: MIDSTREAM OIL & GAS FILTRATION MARKET, BY COUNTRY, 2021-2024 (USD MILLION)
- TABLE 93 MIDDLE EAST & AFRICA: MIDSTREAM OIL & GAS FILTRATION MARKET, BY COUNTRY, 2025-2030 (USD MILLION)
- TABLE 94 MIDDLE EAST & AFRICA: MIDSTREAM OIL & GAS FILTRATION MARKET, BY FILTER TECHNOLOGY, 2021-2024 (USD MILLION)
- TABLE 95 MIDDLE EAST & AFRICA: MIDSTREAM OIL & GAS FILTRATION MARKET, BY FILTER TECHNOLOGY, 2025-2030 (USD MILLION)
- TABLE 96 MIDDLE EAST & AFRICA: MIDSTREAM OIL & GAS FILTRATION MARKET, BY FILTER MEDIA, 2021-2024 (USD MILLION)
- TABLE 97 MIDDLE EAST & AFRICA: MIDSTREAM OIL & GAS FILTRATION MARKET, BY FILTER MEDIA, 2025-2030 (USD MILLION)
- TABLE 98 MIDDLE EAST & AFRICA: MIDSTREAM OIL & GAS FILTRATION MARKET, BY APPLICATION, 2021-2024 (USD MILLION)
- TABLE 99 MIDDLE EAST & AFRICA: MIDSTREAM OIL & GAS FILTRATION MARKET, BY APPLICATION, 2025-2030 (USD MILLION)
- TABLE 100 MIDDLE EAST & AFRICA: MIDSTREAM OIL & GAS FILTRATION MARKET, BY FILTRATION PHASE, 2021-2024 (USD MILLION)
- TABLE 101 MIDDLE EAST & AFRICA: MIDSTREAM OIL & GAS FILTRATION MARKET, BY FILTRATION PHASE, 2025-2030 (USD MILLION)
- TABLE 102 SAUDI ARABIA: MIDSTREAM OIL & GAS FILTRATION MARKET, BY END USER, 2021-2024 (USD MILLION)
- TABLE 103 SAUDI ARABIA: MIDSTREAM OIL & GAS FILTRATION MARKET, BY END USER, 2025-2030 (USD MILLION)
- TABLE 104 UAE: MIDSTREAM OIL & GAS FILTRATION MARKET, BY END USER, 2021-2024 (USD MILLION)
- TABLE 105 UAE: MIDSTREAM OIL & GAS FILTRATION MARKET, BY END USER, 2025-2030 (USD MILLION)
- TABLE 106 SOUTH AFRICA: MIDSTREAM OIL & GAS FILTRATION MARKET, BY END USER, 2021-2024 (USD MILLION)
- TABLE 107 SOUTH AFRICA: MIDSTREAM OIL & GAS FILTRATION MARKET, BY END USER, 2025-2030 (USD MILLION)
- TABLE 108 REST OF MIDDLE EAST & AFRICA: MIDSTREAM OIL & GAS FILTRATION MARKET, BY END USER, 2021-2024 (USD MILLION)
- TABLE 109 REST OF MIDDLE EAST & AFRICA: MIDSTREAM OIL & GAS FILTRATION MARKET, BY END USER, 2025-2030 (USD MILLION)
- TABLE 110 SOUTH AMERICA: MIDSTREAM OIL & GAS FILTRATION MARKET, BY COUNTRY, 2021-2024 (USD MILLION)
- TABLE 111 SOUTH AMERICA: MIDSTREAM OIL & GAS FILTRATION MARKET, BY COUNTRY, 2025-2030 (USD MILLION)
- TABLE 112 SOUTH AMERICA: MIDSTREAM OIL & GAS FILTRATION MARKET, BY FILTER TECHNOLOGY, 2021-2024 (USD MILLION)
- TABLE 113 SOUTH AMERICA: MIDSTREAM OIL & GAS FILTRATION MARKET, BY FILTER TECHNOLOGY, 2025-2030 (USD MILLION)
- TABLE 114 SOUTH AMERICA: MIDSTREAM OIL & GAS FILTRATION MARKET, BY FILTER MEDIA, 2021-2024 (USD MILLION)
- TABLE 115 SOUTH AMERICA: MIDSTREAM OIL & GAS FILTRATION MARKET, BY FILTER MEDIA, 2025-2030 (USD MILLION)
- TABLE 116 SOUTH AMERICA: MIDSTREAM OIL & GAS FILTRATION MARKET, BY APPLICATION, 2021-2024 (USD MILLION)
- TABLE 117 SOUTH AMERICA: MIDSTREAM OIL & GAS FILTRATION MARKET, BY APPLICATION, 2025-2030 (USD MILLION)
- TABLE 118 SOUTH AMERICA: MIDSTREAM OIL & GAS FILTRATION MARKET, BY FILTRATION PHASE, 2021-2024 (USD MILLION)
- TABLE 119 SOUTH AMERICA: MIDSTREAM OIL & GAS FILTRATION MARKET, BY FILTRATION PHASE, 2025-2030 (USD MILLION)
- TABLE 120 BRAZIL: MIDSTREAM OIL & GAS FILTRATION MARKET, BY END USER, 2021-2024 (USD MILLION)
- TABLE 121 BRAZIL: MIDSTREAM OIL & GAS FILTRATION MARKET, BY END USER, 2025-2030 (USD MILLION)
- TABLE 122 ARGENTINA: MIDSTREAM OIL & GAS FILTRATION MARKET, BY END USER, 2021-2024 (USD MILLION)
- TABLE 123 ARGENTINA: MIDSTREAM OIL & GAS FILTRATION MARKET, BY END USER, 2025-2030 (USD MILLION)
- TABLE 124 REST OF SOUTH AMERICA: MIDSTREAM OIL & GAS FILTRATION MARKET, BY END USER, 2021-2024 (USD MILLION)
- TABLE 125 REST OF SOUTH AMERICA: MIDSTREAM OIL & GAS FILTRATION MARKET, BY END USER, 2025-2030 (USD MILLION)
- TABLE 126 OVERVIEW OF STRATEGIES ADOPTED BY KEY PLAYERS IN MIDSTREAM OIL & GAS FILTRATION MARKET BETWEEN JANUARY 2020 AND NOVEMBER 2025
- TABLE 127 MIDSTREAM OIL & GAS FILTRATION MARKET: DEGREE OF COMPETITION
- TABLE 128 MIDSTREAM OIL & GAS FILTRATION MARKET: REGION FOOTPRINT
- TABLE 129 MIDSTREAM OIL & GAS FILTRATION MARKET: FILTER TECHNOLOGY FOOTPRINT
- TABLE 130 MIDSTREAM OIL & GAS FILTRATION MARKET: FILTER MEDIA FOOTPRINT
- TABLE 131 MIDSTREAM OIL & GAS FILTRATION MARKET: APPLICATION FOOTPRINT
- TABLE 132 MIDSTREAM OIL & GAS FILTRATION MARKET: FILTRATION PHASE FOOTPRINT
- TABLE 133 MIDSTREAM OIL & GAS FILTRATION MARKET: DETAILED LIST OF KEY STARTUPS/SMES
- TABLE 134 MIDSTREAM OIL & GAS FILTRATION MARKET: COMPETITIVE BENCHMARKING OF STARTUPS/SMES
- TABLE 135 MIDSTREAM OIL & GAS FILTRATION MARKET: PRODUCT LAUNCHES, JANUARY 2020- NOVEMBER 2025
- TABLE 136 MIDSTREAM OIL & GAS FILTRATION MARKET: DEALS, JANUARY 2020- NOVEMBER 2025
- TABLE 137 MIDSTREAM OIL & GAS FILTRATION MARKET: EXPANSIONS, JANUARY 2020-NOVEMBER 2025
- TABLE 138 MIDSTREAM OIL & GAS FILTRATION MARKET: OTHER DEVELOPMENTS, JANUARY 2020-NOVEMBER 2025
- TABLE 139 PALL CORPORATION: COMPANY OVERVIEW
- TABLE 140 PALL CORPORATION: PRODUCTS/SOLUTIONS/SERVICES OFFERED
- TABLE 141 PALL CORPORATION: PRODUCT LAUNCHES
- TABLE 142 PALL CORPORATION: EXPANSIONS
- TABLE 143 PALL CORPORATION: OTHER DEVELOPMENTS
- TABLE 144 JONELL SYSTEMS: COMPANY OVERVIEW
- TABLE 145 JONELL SYSTEMS: PRODUCTS/SOLUTIONS/SERVICES OFFERED
- TABLE 146 PARKER HANNIFIN: COMPANY OVERVIEW
- TABLE 147 PARKER HANNIFIN: PRODUCTS/SOLUTIONS/SERVICES OFFERED
- TABLE 148 PARKER HANNIFIN: DEALS
- TABLE 149 EATON: COMPANY OVERVIEW
- TABLE 150 EATON: PRODUCTS/SOLUTIONS/SERVICES OFFERED
- TABLE 151 EATON: PRODUCT LAUNCHES
- TABLE 152 EATON: EXPANSIONS
- TABLE 153 PENTAIR: COMPANY OVERVIEW
- TABLE 154 PENTAIR: PRODUCTS/SOLUTIONS/SERVICES OFFERED
- TABLE 155 GRAVER TECHNOLOGIES: COMPANY OVERVIEW
- TABLE 156 GRAVER TECHNOLOGIES: PRODUCTS/SOLUTIONS/SERVICES OFFERED
- TABLE 157 3M: COMPANY OVERVIEW
- TABLE 158 3M: PRODUCTS/SOLUTIONS/SERVICES OFFERED
- TABLE 159 3M: DEALS
- TABLE 160 CECO ENVIRONMENTAL: COMPANY OVERVIEW
- TABLE 161 CECO ENVIRONMENTAL: PRODUCTS/SOLUTIONS/SERVICES OFFERED
- TABLE 162 CECO ENVIRONMENTAL: DEALS
- TABLE 163 FTC FILTERS: COMPANY OVERVIEW
- TABLE 164 FTC FILTERS: PRODUCTS/SOLUTIONS/SERVICES OFFERED
- TABLE 165 CLARK-RELIANCE: COMPANY OVERVIEW
- TABLE 166 CLARK RELIANCE: PRODUCTS/SOLUTIONS/SERVICES OFFERED
- TABLE 167 HILLIARD CORPORATION: COMPANY OVERVIEW
- TABLE 168 HILLIARD CORPORATION: PRODUCTS/SOLUTIONS/SERVICES OFFERED
- TABLE 169 ENERWELLS: COMPANY OVERVIEW
- TABLE 170 ENERWELLS: PRODUCTS/SOLUTIONS/SERVICES OFFERED
- TABLE 171 SAIFILTER: COMPANY OVERVIEW
- TABLE 172 SAIFILTER: PRODUCTS/SOLUTIONS/SERVICES OFFERED
- TABLE 173 TM FILTRATION: COMPANY OVERVIEW
- TABLE 174 TM FILTRATION: PRODUCTS/SOLUTIONS/SERVICES OFFERED
- TABLE 175 BROTHER FILTRATION: COMPANY OVERVIEW
- TABLE 176 BROTHER FILTRATION: PRODUCTS/SOLUTIONS/SERVICES OFFERED
- TABLE 177 SWIFT FILTER: COMPANY OVERVIEW
- TABLE 178 SWIFT FILTER: PRODUCTS/SOLUTIONS/SERVICES OFFERED
- TABLE 179 FIL-TREK: COMPANY OVERVIEW
- TABLE 180 FIL TREK: PRODUCTS/SOLUTIONS/SERVICES OFFERED
- TABLE 181 DONALDSON: COMPANY OVERVIEW
- TABLE 182 DONALDSON: PRODUCTS/SOLUTIONS/SERVICES OFFERED
- TABLE 183 PS FILTER: COMPANY OVERVIEW
- TABLE 184 SMITHS GROUP: COMPANY OVERVIEW
- TABLE 185 CRITICAL PROCESS FILTRATION: COMPANY OVERVIEW
- TABLE 186 HOFF ENGINEERING: COMPANY OVERVIEW
- TABLE 187 CLEANOVA: COMPANY OVERVIEW
- TABLE 188 NORMAN FILTER COMPANY: COMPANY OVERVIEW
- TABLE 189 COLEMAN FILTER COMPANY: COMPANY OVERVIEW
- TABLE 190 FILTERS SPA: COMPANY OVERVIEW
- TABLE 191 FILTER SCIENCES: COMPANY OVERVIEW
- TABLE 192 CHASE FILTERS: COMPANY OVERVIEW
- TABLE 193 MUELLER ENVIRONMENTAL: COMPANY OVERVIEW
- TABLE 194 KINGTOOL: COMPANY OVERVIEW
- TABLE 195 GAS TECH: COMPANY OVERVIEW
- TABLE 196 ROYAL PRODUCTS: COMPANY OVERVIEW
- TABLE 197 LIST OF KEY SECONDARY SOURCES
List of Figures
- FIGURE 1 MIDSTREAM OIL & GAS FILTRATION MARKET SEGMENTATION AND REGIONAL SCOPE
- FIGURE 2 KEY INSIGHTS AND MARKET HIGHLIGHTS
- FIGURE 3 GLOBAL MIDSTREAM OIL & GAS FILTRATION MARKET, 2025-2030
- FIGURE 4 MAJOR STRATEGIES ADOPTED BY KEY PLAYERS IN MIDSTREAM OIL & GAS FILTRATION MARKET, 2020-2025
- FIGURE 5 DISRUPTIONS INFLUENCING GROWTH OF MIDSTREAM OIL & GAS FILTRATION MARKET
- FIGURE 6 HIGH-GROWTH SEGMENTS IN MIDSTREAM OIL & GAS FILTRATION MARKET, 2025-2030
- FIGURE 7 NORTH AMERICA TO REGISTER HIGHEST CAGR IN MIDSTREAM OIL & GAS FILTRATION MARKET DURING FORECAST PERIOD
- FIGURE 8 INCREASING DEMAND FOR ADVANCED FILTRATION IN GAS PROCESSING PLANTS AND COMPRESSION STATIONS TO DRIVE MARKET
- FIGURE 9 COALESCER FILTERS ACCOUNTED FOR LARGEST MARKET SHARE IN 2024
- FIGURE 10 SYNTHETIC POLYMER SEGMENT DOMINATED MIDSTREAM OIL & GAS FILTRATION MARKET IN 2024
- FIGURE 11 GAS PROCESSING PLANTS SEGMENT ACCOUNTED FOR LARGEST MARKET SHARE IN 2024
- FIGURE 12 OIL FILTRATION SEGMENT ACCOUNTED FOR LARGER SHARE OF MIDSTREAM OIL & GAS FILTRATION MARKET IN 2024
- FIGURE 13 CHINA TO REGISTER HIGHEST CAGR DURING FORECAST PERIOD
- FIGURE 14 MIDSTREAM OIL & GAS FILTRATION MARKET: DRIVERS, RESTRAINTS, OPPORTUNITIES, AND CHALLENGES
- FIGURE 15 MIDSTREAM OIL & GAS FILTRATION MARKET: PORTER'S FIVE FORCES ANALYSIS
- FIGURE 17 MIDSTREAM OIL & GAS FILTRATION MARKET: KEY PARTICIPANTS IN ECOSYSTEM
- FIGURE 18 MIDSTREAM OIL & GAS FILTRATION MARKET: ECOSYSTEM ANALYSIS
- FIGURE 19 IMPORT SCENARIO FOR HS CODE 842199-COMPLIANT PRODUCTS, BY KEY COUNTRY, 2020-2024
- FIGURE 20 EXPORT SCENARIO FOR HS CODE 842199-COMPLIANT PRODUCTS, BY KEY COUNTRY, 2020-2024
- FIGURE 21 TRENDS/DISRUPTIONS INFLUENCING CUSTOMER BUSINESS
- FIGURE 22 MIDSTREAM OIL & GAS FILTRATION MARKET: INVESTMENT AND FUNDING SCENARIO, 2021-2025
- FIGURE 23 PATENTS APPLIED AND GRANTED, 2014-2024
- FIGURE 24 LEGAL STATUS OF PATENTS, 2014-2024
- FIGURE 25 TOP JURISDICTIONS
- FIGURE 26 FUTURE APPLICATIONS OF MIDSTREAM OIL & GAS FILTRATION
- FIGURE 27 MIDSTREAM OIL & GAS FILTRATION MARKET: DECISION-MAKING FACTORS
- FIGURE 28 INFLUENCE OF STAKEHOLDERS ON BUYING PROCESS ON KEY APPLICATIONS
- FIGURE 29 KEY BUYING CRITERIA, BY APPLICATION
- FIGURE 30 ADOPTION BARRIERS & INTERNAL CHALLENGES
- FIGURE 31 COALESCER FILTER TECHNOLOGY SEGMENT TO ACCOUNT FOR LARGEST MARKET SHARE IN 2025
- FIGURE 32 SYNTHETIC POLYMER SEGMENT TO ACCOUNT FOR LARGEST MARKET SHARE DURING FORECAST PERIOD
- FIGURE 33 GAS PROCESSING PLANTS SEGMENT TO DOMINATE MARKET IN 2025
- FIGURE 34 OIL FILTRATION SEGMENT TO ACCOUNT FOR LARGER MARKET SHARE IN 2025
- FIGURE 35 CHINA TO REGISTER HIGHEST GROWTH DURING FORECAST PERIOD
- FIGURE 36 NORTH AMERICA: MIDSTREAM OIL & GAS FILTRATION MARKET SNAPSHOT
- FIGURE 37 EUROPE: MIDSTREAM OIL & GAS FILTRATION MARKET SNAPSHOT
- FIGURE 38 ASIA PACIFIC: MIDSTREAM OIL & GAS FILTRATION MARKET SNAPSHOT
- FIGURE 39 REVENUE ANALYSIS OF KEY COMPANIES IN MIDSTREAM OIL & GAS FILTRATION MARKET, 2022-2024
- FIGURE 40 SHARES OF LEADING COMPANIES IN MIDSTREAM OIL & GAS FILTRATION MARKET, 2024
- FIGURE 41 COMPANY VALUATION OF LEADING COMPANIES IN MIDSTREAM OIL & GAS FILTRATION MARKET, 2024
- FIGURE 42 EV/EBITDA OF LEADING COMPANIES IN MIDSTREAM OIL & GAS FILTRATION MARKET, 2024
- FIGURE 43 MIDSTREAM OIL & GAS FILTRATION MARKET: BRAND/PRODUCT COMPARISON
- FIGURE 44 MIDSTREAM OIL & GAS FILTRATION MARKET: COMPANY EVALUATION MATRIX (KEY PLAYERS), 2024
- FIGURE 45 MIDSTREAM OIL & GAS FILTRATION MARKET: COMPANY FOOTPRINT
- FIGURE 46 MIDSTREAM OIL & GAS FILTRATION MARKET: COMPANY EVALUATION MATRIX (STARTUPS/SMES), 2024
- FIGURE 47 PALL CORPORATION: COMPANY SNAPSHOT
- FIGURE 48 PARKER HANNIFIN: COMPANY SNAPSHOT
- FIGURE 49 EATON: COMPANY SNAPSHOT
- FIGURE 50 PENTAIR: COMPANY SNAPSHOT
- FIGURE 51 3M: COMPANY SNAPSHOT
- FIGURE 52 CECO ENVIRONMENTAL: COMPANY SNAPSHOT
- FIGURE 53 DONALDSON: COMPANY SNAPSHOT
- FIGURE 54 MIDSTREAM OIL & GAS FILTRATION MARKET: RESEARCH DESIGN
- FIGURE 55 MIDSTREAM OIL & GAS FILTRATION MARKET: BOTTOM-UP APPROACH
- FIGURE 56 MIDSTREAM OIL & GAS FILTRATION MARKET: TOP-DOWN APPROACH
- FIGURE 57 MIDSTREAM OIL & GAS FILTRATION MARKET: DATA TRIANGULATION

