PUBLISHER: MarketsandMarkets | PRODUCT CODE: 2151263

PUBLISHER: MarketsandMarkets | PRODUCT CODE: 2151263
Wire & Cable Market by Product Type (Electronic Wire, Power Cable, Control & Instrumentation Cable, Communication Cable, Flexible & Specialty Cable), Conductor, Insulation, Voltage, Installation, End-use Industry, and Region - Global Forecast to 2031
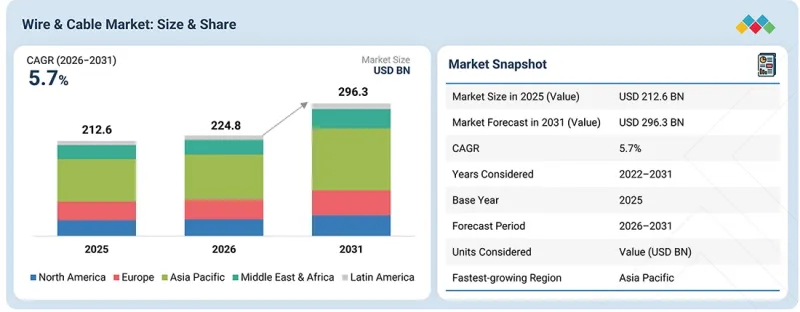
The wire & cable market is estimated to be USD 224.8 billion in 2026 and is projected to reach USD 296.3 billion by 2031, registering a CAGR of 5.7% during the forecast period. Aluminum conductors are expected to register the second-highest CAGR in the wire & cable market, supported by their increasing use in power transmission and distribution networks where lightweight conductors can simplify installation and handling.
| Scope of the Report | |
|---|---|
| Years Considered for the Study | 2022-2031 |
| Base Year | 2025 |
| Forecast Period | 2026-2031 |
| Units Considered | Value (USD Billion) |
| Segments | Product Type, Conductor, Insulation, Voltage, Installation, End-Use Industry |
| Regions covered | North America, Europe, Asia Pacific, Middle East & Africa, and Latin America |
Utilities and infrastructure developers are favoring aluminum for long-distance lines because its lower density enables larger conductor sizes without a proportional increase in structural loading. The material's cost advantage over copper is also encouraging its adoption in utility cables, building wiring, and renewable power connections, particularly where projects face tight material and installation budgets. Growing grid expansion, interconnection of distributed energy resources, and replacement of aging transmission infrastructure are further creating demand for aluminum-based conductors.
"In terms of value, the TPE insulation is expected to register the second-highest CAGR during the forecast period."
TPE (Thermoplastic Elastomer) insulation is expected to register the second-highest CAGR in the wire & cable market, driven by its increasing use in applications requiring flexibility, durability, and resistance to heat, chemicals, and environmental stress. Its ability to withstand repeated bending and mechanical movement makes it suitable for automotive wiring, industrial equipment, robotics, and flexible power connections. Growing adoption of lightweight wiring systems in electric and hybrid vehicles is also creating opportunities for TPE-insulated cables. In addition, manufacturers are developing halogen-free and flame-retardant TPE formulations to address safety and environmental requirements, supporting wider adoption across transportation, electronics, and industrial applications.
"In terms of value, the building & construction industry is expected to register the third-highest CAGR during the forecast period."
The building & construction industry is expected to register the third-highest CAGR in the wire & cable market, supported by increasing investments in residential, commercial, and infrastructure projects that require extensive electrical wiring and power distribution networks. Rising urbanization and the development of smart buildings are increasing demand for power, control, communication, and data cables across new and renovated structures. Growing emphasis on energy efficiency and electrical safety is also encouraging the replacement of aging wiring with higher-performance and compliant cable systems. Furthermore, expansion of data centers, transportation infrastructure, and industrial facilities is creating additional requirements for reliable low-, medium-, and high-voltage cable installations.
"In terms of value, the Middle East & Africa is expected to register the second-highest CAGR during the forecast period."
The Middle East & Africa region is expected to register the second-highest CAGR in the wire & cable market, supported by rising investments in power generation, transmission, and distribution infrastructure to improve electricity access and grid reliability. Rapid development of oil & gas facilities, industrial zones, airports, ports, and large-scale urban projects is generating demand for power, control, and communication cables. Countries across the Gulf are also expanding renewable energy projects, particularly solar power, requiring extensive cabling for generation and grid integration. Meanwhile, electrification initiatives and infrastructure development in African economies are creating additional opportunities for medium- and low-voltage cables.
This study has been validated through primary interviews with industry experts globally. The primary sources have been divided into the following three categories:
- By Company Type: Tier 1 - 60%, Tier 2 - 20%, and Tier 3 - 20%
- By Designation: C-level - 33%, Director-level - 33%, and Managers - 34%
- By Region: North America - 15%, Europe - 50%, Asia Pacific - 20%, Middle East & Africa - 10%, and Latin America - 5%
The report provides a comprehensive analysis of the following companies:
Prominent companies in this market include Prysmian (Italy), Belden Inc. (US), Fujikura Ltd. (Japan), Furukawa Electric Co., Ltd. (Japan), Nexans (France), Emerson Electric Co. (US), Hellenic Cables (Greece), KEI Industries (India), Sumitomo Electric Industries, Ltd. (Japan), NKT A/S (Denmark), Finolex Cables Ltd. (India), Helukabel (Germany), and LS Cable and System (South Korea), among others.
Research Coverage
This research report categorizes the wire & cable market by product type (electronic wires, power cables, control & instrumentation cables, communication cables, flexible & specialty cables), conductor (aluminum, copper, other conductors), insulation (PVC, CPE, XLPE, TPE, TPV, TPU, other insulation), voltage (low voltage, medium voltage, high voltage, extra-high voltage), installation (overhead, underground, submarine), end-use industry (aerospace & defense, building & construction, oil & gas, energy & power, IT & telecom, automotive, medical equipment, other end-use industries), and region (North America, Europe, Asia Pacific, the Middle East & Africa, and Latin America). The report covers the major driving factors impacting wire & cable market growth, along with restraints, challenges, and opportunities. A comprehensive assessment of key industry players highlights their business profiles, products & services, strategies, and recent developments in the market. The report also provides a competitive landscape of key global and regional players in the wire & cable market.
Reasons to Buy this Report
The report will help market leaders/new entrants in this market with information on the closest approximations of revenue for the overall market and its subsegments. This report will help stakeholders understand the competitive landscape, gain insights into their business positioning, and plan suitable go-to-market strategies. The report also helps stakeholders understand the market pulse and provides information on key market drivers, restraints, challenges, and opportunities.
The report provides insights into the following pointers:
- Analysis of key drivers (rising demand for cables from renewable energy and electrification projects), restraints (volatility in copper and aluminum prices), opportunities (growing demand for cables in EV charging infrastructure), and challenges (shortage of specialized technical expertise) influencing the growth of the wire & cable market
- Product Development/Innovation: Detailed insights into emerging wire and cable technologies, R&D activities, advancements in power, communication, specialty, and high-voltage cables, improved electrical and mechanical performance, fire resistance, thermal stability, durability, smart cable systems, advanced insulation and jacketing materials, sustainable and recyclable cable materials, monitoring technologies, and product launches across the global wire & cable market
- Market Development: Comprehensive information on attractive and high-growth markets, with the report analyzing the wire & cable market across key regions and countries, including North America, Europe, Asia Pacific, the Middle East & Africa, and Latin America, and across aerospace & defense, building & construction, oil & gas, energy & power, IT & telecom, automotive, medical equipment, and other end-use industries
- Market Diversification: Exhaustive information on new fire-resistant glass product developments, emerging applications, untapped geographic markets, recent developments, strategic partnerships, manufacturing capacity expansion, distribution network growth, and investments in the wire & cable market
- Competitive Assessment: In-depth assessment of market shares, growth strategies, and product offerings of leading players like Prysmian (Italy), Belden Inc. (US), Fujikura Ltd. (Japan), Furukawa Electric Co., Ltd. (Japan), Nexans (France), Emerson Electric Co. (US), Hellenic Cables (Greece), KEI Industries (India), Sumitomo Electric Industries, Ltd. (Japan), NKT A/S (Denmark), Finolex Cables Ltd. (India), Helukabel (Germany), and LS Cable and System (South Korea), among others
TABLE OF CONTENTS
1 INTRODUCTION
- 1.1 STUDY OBJECTIVES
- 1.2 MARKET DEFINITION
- 1.3 STUDY SCOPE
- 1.3.1 MARKETS COVERED AND REGIONAL SCOPE
- 1.3.2 INCLUSIONS AND EXCLUSIONS
- 1.3.3 YEARS CONSIDERED
- 1.3.4 CURRENCY CONSIDERED
- 1.4 LIMITATIONS
- 1.5 STAKEHOLDERS
- 1.6 SUMMARY OF CHANGES
2 EXECUTIVE SUMMARY
- 2.1 KEY INSIGHTS AND MARKET HIGHLIGHTS
- 2.2 KEY MARKET PARTICIPANTS: SHARE INSIGHTS AND STRATEGIC DEVELOPMENTS
- 2.3 DISRUPTIVE TRENDS SHAPING MARKET
- 2.4 HIGH-GROWTH SEGMENTS & EMERGING FRONTIERS
- 2.5 SNAPSHOT: GLOBAL MARKET SIZE, GROWTH RATE, AND FORECAST
3 PREMIUM INSIGHTS
- 3.1 ATTRACTIVE OPPORTUNITIES FOR PLAYERS IN WIRE & CABLE MARKET
- 3.2 WIRE & CABLE MARKET, BY END-USE INDUSTRY AND REGION
- 3.3 WIRE & CABLE MARKET, BY INSTALLATION
- 3.4 WIRE & CABLE MARKET, BY COUNTRY
4 MARKET OVERVIEW
- 4.1 INTRODUCTION
- 4.2 MARKET DYNAMICS
- 4.2.1 DRIVERS
- 4.2.1.1 Rising demand for cables from renewable energy sector
- 4.2.1.2 Increasing investment in transmission and distribution infrastructure
- 4.2.1.3 Growing demand for cables in data-center power infrastructure
- 4.2.1.4 Increasing safety and reliability requirements for cable systems
- 4.2.2 RESTRAINTS
- 4.2.2.1 Fluctuating raw material prices
- 4.2.2.2 Trade-policy uncertainty and supply-chain disruptions
- 4.2.3 OPPORTUNITIES
- 4.2.3.1 Increasing demand for cables in EV charging infrastructure
- 4.2.3.2 Expansion of offshore wind and subsea power transmission
- 4.2.3.3 Expansion of high-voltage and extra-high-voltage cable applications
- 4.2.4 CHALLENGES
- 4.2.4.1 Enhancing insulation durability under harsh conditions
- 4.2.4.2 Requirement for technical expertise to develop and install advanced cables
- 4.2.1 DRIVERS
- 4.3 UNMET NEEDS AND WHITE SPACES
- 4.3.1 UNMET NEEDS IN WIRE & CABLE MARKET
- 4.3.2 WHITE SPACE OPPORTUNITIES
- 4.4 INTERCONNECTED MARKETS AND CROSS-SECTOR OPPORTUNITIES
- 4.4.1 INTERCONNECTED MARKETS
- 4.4.2 CROSS-SECTOR OPPORTUNITIES
- 4.5 EMERGING BUSINESS MODELS AND ECOSYSTEM SHIFTS
- 4.5.1 EMERGING BUSINESS MODELS
- 4.5.2 ECOSYSTEM SHIFTS
- 4.6 STRATEGIC MOVES BY TIER-1/2/3 PLAYERS
- 4.6.1 KEY MOVES AND STRATEGIC FOCUS
5 INDUSTRY TRENDS
- 5.1 PORTER'S FIVE FORCES ANALYSIS
- 5.1.1 THREAT OF NEW ENTRANTS
- 5.1.2 THREAT OF SUBSTITUTES
- 5.1.3 BARGAINING POWER OF SUPPLIERS
- 5.1.4 BARGAINING POWER OF BUYERS
- 5.1.5 INTENSITY OF COMPETITIVE RIVALRY
- 5.2 MACROECONOMICS INDICATORS
- 5.2.1 INTRODUCTION
- 5.2.2 GDP TRENDS AND FORECAST
- 5.2.3 TRENDS IN GLOBAL BUILDING & CONSTRUCTION SECTOR
- 5.3 VALUE CHAIN ANALYSIS
- 5.4 ECOSYSTEM ANALYSIS
- 5.5 PRICING ANALYSIS
- 5.5.1 AVERAGE SELLING PRICE, BY KEY PLAYERS
- 5.5.2 AVERAGE SELLING PRICE TREND OF WIRE & CABLE, BY REGION
- 5.6 TRADE ANALYSIS
- 5.6.1 IMPORT SCENARIO (HS CODE 761410)
- 5.6.2 EXPORT SCENARIO (HS CODE 761410)
- 5.7 KEY CONFERENCES AND EVENTS, 2026-2027
- 5.8 TRENDS/DISRUPTIONS IMPACTING CUSTOMER BUSINESS
- 5.9 INVESTMENT AND FUNDING SCENARIO
- 5.10 CASE STUDY ANALYSIS
- 5.10.1 NEXANS COMPLETES CORFU SUBSEA CABLE REPLACEMENT TO RESTORE GRID RELIABILITY
- 5.10.2 PRYSMIAN STRENGTHENS US GRID THROUGH SILVER RUN SUBMARINE CABLE PROJECT
- 5.10.3 NKT EXPANDS UK GRID CAPACITY THROUGH EASTERN GREEN LINK 3
- 5.11 IMPACT OF 2025 US TARIFF ON WIRE & CABLE MARKET
- 5.11.1 INTRODUCTION
- 5.11.2 KEY TARIFF RATES
- 5.11.3 PRICE IMPACT ANALYSIS
- 5.11.4 IMPACT ON COUNTRIES/REGIONS
- 5.11.4.1 US
- 5.11.4.2 Europe
- 5.11.4.3 Asia Pacific
- 5.11.5 IMPACT ON END-USE INDUSTRIES
6 STRATEGIC DISRUPTION THROUGH TECHNOLOGY, PATENTS, DIGITAL, AND AI ADOPTIONS
- 6.1 KEY EMERGING TECHNOLOGIES
- 6.1.1 WIRE DRAWING
- 6.1.2 ANNEALING
- 6.1.3 TWISTING & STRANDING
- 6.1.4 EXTRUSION
- 6.1.5 CABLING
- 6.2 COMPLEMENTARY TECHNOLOGIES
- 6.2.1 3D-PRINTED WIRES
- 6.2.2 SMART WIRE & CABLES
- 6.2.3 NANOTECHNOLOGY
- 6.3 TECHNOLOGY/PRODUCT ROADMAP
- 6.3.1 SHORT-TERM (2025-2027) | FOUNDATION & EARLY COMMERCIALIZATION
- 6.3.2 MID-TERM (2027-2030) | EXPANSION & STANDARDIZATION
- 6.3.3 LONG-TERM (2030-2035+) | MASS COMMERCIALIZATION & DISRUPTION
- 6.4 PATENT ANALYSIS
- 6.4.1 INTRODUCTION
- 6.4.2 METHODOLOGY
- 6.4.3 DOCUMENT TYPE
- 6.4.4 INSIGHTS
- 6.4.5 LEGAL STATUS OF PATENTS
- 6.4.6 JURISDICTION ANALYSIS
- 6.4.7 TOP APPLICANTS
- 6.4.8 LIST OF PATENTS BY STATE GRID CORPORATION CHINA
- 6.5 FUTURE APPLICATIONS
- 6.5.1 RENEWABLE ENERGY SYSTEMS: ADVANCED CABLES FOR SOLAR, WIND, ENERGY STORAGE, AND RENEWABLE POWER TRANSMISSION
- 6.5.2 SMART GRID & GRID MODERNIZATION: HIGH-PERFORMANCE CABLES ENABLING FLEXIBLE, AND DIGITALLY CONNECTED POWER NETWORKS
- 6.5.3 ELECTRIC VEHICLES & CHARGING INFRASTRUCTURE: HIGH-VOLTAGE AND CHARGING CABLES SUPPORTING VEHICLE ELECTRIFICATION AND FAST CHARGING
- 6.5.4 AI DATA CENTERS & DIGITAL INFRASTRUCTURE: HIGH-CAPACITY POWER AND COMMUNICATION CABLES FOR HYPERSCALE AND AI COMPUTING FACILITIES
- 6.5.5 OFFSHORE WIND & SUBSEA POWER TRANSMISSION: HIGH-VOLTAGE SUBMARINE CABLES CONNECTING OFFSHORE GENERATION TO ONSHORE GRIDS
- 6.6 IMPACT OF AI/GEN AI ON WIRE & CABLE MARKET
- 6.6.1 TOP USE CASES AND MARKET POTENTIAL
- 6.6.2 BEST PRACTICES IN WIRE & CABLE PROCESSING
- 6.6.3 CASE STUDIES OF AI IMPLEMENTATION IN WIRE & CABLE MARKET
- 6.6.4 INTERCONNECTED ADJACENT ECOSYSTEM AND IMPACT ON MARKET PLAYERS
- 6.6.5 CLIENTS' READINESS TO ADOPT GENERATIVE AI IN WIRE & CABLE MARKET
- 6.7 SUCCESS STORIES AND REAL-WORLD APPLICATIONS
- 6.7.1 PRYSMIAN: AI-BASED PREDICTIVE QUALITY FOR OPTICAL-FIBER CABLE MANUFACTURING
- 6.7.2 NEXANS: AI-POWERED CABLE MONITORING AND PREDICTIVE MAINTENANCE
7 SUSTAINABILITY AND REGULATORY LANDSCAPE
- 7.1 REGIONAL REGULATIONS AND COMPLIANCE
- 7.1.1 REGULATORY BODIES, GOVERNMENT AGENCIES, AND OTHER ORGANIZATIONS
- 7.1.2 INDUSTRY STANDARDS
- 7.2 SUSTAINABILITY INITIATIVES
- 7.2.1 CARBON IMPACT AND ECO-APPLICATIONS OF WIRE & CABLE
- 7.2.1.1 Carbon impact reduction
- 7.2.1.2 Eco-Applications
- 7.2.1 CARBON IMPACT AND ECO-APPLICATIONS OF WIRE & CABLE
- 7.3 SUSTAINABILITY IMPACT AND REGULATORY POLICY INITIATIVES
- 7.4 CERTIFICATIONS, LABELING, ECO-STANDARDS
8 CUSTOMER LANDSCAPE & BUYER BEHAVIOR
- 8.1 DECISION-MAKING PROCESS
- 8.2 BUYER STAKEHOLDERS AND BUYING EVALUATION CRITERIA
- 8.2.1 KEY STAKEHOLDERS IN BUYING PROCESS
- 8.2.2 BUYING CRITERIA
- 8.3 ADOPTION BARRIERS & INTERNAL CHALLENGES
- 8.4 UNMET NEEDS FROM VARIOUS END-USE INDUSTRIES
- 8.5 MARKET PROFITABILITY
- 8.5.1 REVENUE POTENTIAL
- 8.5.2 COST DYNAMICS
- 8.5.3 MARGIN OPPORTUNITIES, BY END-USE INDUSTRY
9 WIRE & CABLE MARKET, BY PRODUCT TYPE
- 9.1 INTRODUCTION
- 9.2 ELECTRONIC WIRES
- 9.3 POWER CABLES
- 9.4 CONTROL & INSTRUMENTATION CABLES
- 9.5 COMMUNICATION CABLES
- 9.6 FLEXIBLE & SPECIALTY CABLES
10 WIRE & CABLE MARKET, BY CONDUCTOR
- 10.1 INTRODUCTION
- 10.2 ALUMINUM
- 10.2.1 LOWER WEIGHT AND MATERIAL COST TO DRIVE DEMAND
- 10.3 COPPER
- 10.3.1 SUPERIOR ELECTRICAL CONDUCTIVITY AND HIGH CURRENT-CARRYING CAPACITY TO MAINTAIN DOMINANCE
- 10.4 OTHER CONDUCTORS
11 WIRE & CABLE MARKET, BY INSULATION
- 11.1 INTRODUCTION
- 11.2 PVC
- 11.2.1 WIDESPREAD USE IN BUILDING AND LOW-VOLTAGE CABLES TO DRIVE DEMAND
- 11.3 XLPE
- 11.3.1 HIGHER TEMPERATURE CAPABILITY TO INCREASE XLPE PERFORMANCE IN HIGH-VOLTAGE APPLICATIONS
- 11.4 EPR
- 11.4.1 FLEXIBILITY AND THERMAL PERFORMANCE TO SUPPORT EPR USE IN INDUSTRIAL AND TRANSPORTATION APPLICATIONS
- 11.5 OTHER INSULATION MATERIALS
12 WIRE & CABLE MARKET, BY INSTALLATION
- 12.1 INTRODUCTION
- 12.2 OVERHEAD
- 12.2.1 GRID RELIABILITY AND TRANSMISSION CAPACITY EXPANSION TO DRIVE MARKET
- 12.3 UNDERGROUND
- 12.3.1 WILDFIRE RESILIENCE AND URBAN INFRASTRUCTURE PROTECTION TO ACCELERATE UNDERGROUNDING
- 12.4 SUBMARINE
- 12.4.1 OFFSHORE RENEWABLES AND CROSS-BORDER POWER INTERCONNECTIONS TO DRIVE MARKET
13 WIRE & CABLE MARKET, BY VOLTAGE
- 13.1 INTRODUCTION
- 13.2 LOW VOLTAGE
- 13.2.1 RISING POWER DENSITY IN BUILDINGS AND DIGITAL INFRASTRUCTURE TO SUPPORT MARKET GROWTH
- 13.3 MEDIUM VOLTAGE
- 13.3.1 EXPANSION OF POWER DISTRIBUTION NETWORKS TO STRENGTHEN MEDIUM-VOLTAGE CABLE DEMAND
- 13.4 HIGH VOLTAGE
- 13.4.1 LARGE-SCALE TRANSMISSION PROJECTS AND GRID REINFORCEMENT TO ACCELERATE HIGH-VOLTAGE CABLE DEMAND
- 13.5 EXTRA-HIGH VOLTAGE
- 13.5.1 HIGHER POWER-TRANSFER REQUIREMENTS TO DRIVE DEVELOPMENT OF EXTRA-HIGH-VOLTAGE TRANSMISSION SYSTEMS
14 WIRE & CABLE MARKET, BY END-USE INDUSTRY
- 14.1 INTRODUCTION
- 14.2 AEROSPACE & DEFENSE
- 14.2.1 RISING DEFENSE PROCUREMENT AND AIRCRAFT PRODUCTION TO SUPPORT SPECIALTY CABLE DEMAND
- 14.3 BUILDING & CONSTRUCTION
- 14.3.1 HIGHER PUBLIC CAPITAL EXPENDITURE AND URBAN INFRASTRUCTURE DEVELOPMENT TO DRIVE DEMAND
- 14.4 OIL & GAS
- 14.4.1 LNG CAPACITY EXPANSION AND ENERGY-SECURITY INVESTMENTS TO SUSTAIN OIL & GAS CABLE DEMAND
- 14.5 ENERGY & POWER
- 14.5.1 GROWING RENEWABLE DEPLOYMENT AND GRID INVESTMENT TO REMAIN PRIMARY DEMAND ENGINE
- 14.6 IT & TELECOM
- 14.6.1 AI-DRIVEN DATA CENTER EXPANSION TO ACCELERATE POWER AND COMMUNICATION CABLE DEMAND
- 14.7 AUTOMOTIVE
- 14.7.1 RISING EV PRODUCTION AND HIGHER ELECTRICAL CONTENT TO DRIVE AUTOMOTIVE CABLE DEMAND
- 14.8 MEDICAL EQUIPMENT
- 14.8.1 EXPANSION OF CONTINUOUS MONITORING AND WEARABLE MEDICAL DEVICES TO CREATE DEMAND FOR SPECIALIZED CABLES
- 14.9 OTHER END-USE INDUSTRIES
15 WIRE & CABLE MARKET, BY REGION
- 15.1 INTRODUCTION
- 15.2 NORTH AMERICA
- 15.2.1 US
- 15.2.1.1 Booming aerospace & defense production to drive demand for wires & cables
- 15.2.2 CANADA
- 15.2.2.1 Expansion of ai data centers and digital infrastructure to drive market
- 15.2.1 US
- 15.3 EUROPE
- 15.3.1 GERMANY
- 15.3.1.1 Rapid expansion of ev charging infrastructure to drive demand
- 15.3.2 FRANCE
- 15.3.2.1 Large-scale electricity grid investment to accelerate cable demand
- 15.3.3 UK
- 15.3.3.1 Acceleration of clean-energy investment to support cable market growth
- 15.3.4 ITALY
- 15.3.4.1 Surging ai data center investment to drive demand for power and communication cables
- 15.3.5 SPAIN
- 15.3.5.1 Strong automotive investment and electrification to support cable demand
- 15.3.6 RUSSIA
- 15.3.6.1 Sustained defense expenditure to support demand for specialized cable products
- 15.3.7 REST OF EUROPE
- 15.3.1 GERMANY
- 15.4 ASIA PACIFIC
- 15.4.1 CHINA
- 15.4.1.1 Large-scale infrastructure investment to accelerate wire & cable demand
- 15.4.2 JAPAN
- 15.4.2.1 Expansion of ai data centers and digital infrastructure to drive market
- 15.4.3 INDIA
- 15.4.3.1 Large-scale transmission expansion to strengthen wire & cable demand
- 15.4.4 SOUTH KOREA
- 15.4.4.1 Surging semiconductor and ict investment to drive market
- 15.4.5 AUSTRALIA
- 15.4.5.1 Accelerating renewable energy deployment to support cable demand
- 15.4.6 REST OF ASIA PACIFIC
- 15.4.1 CHINA
- 15.5 LATIN AMERICA
- 15.5.1 BRAZIL
- 15.5.1.1 Expansion of industrial and digital infrastructure to drive demand
- 15.5.2 MEXICO
- 15.5.2.1 Nearshoring and industrial park expansion to accelerate cable demand
- 15.5.3 REST OF LATIN AMERICA
- 15.5.1 BRAZIL
- 15.6 MIDDLE EAST & AFRICA
- 15.6.1 GCC COUNTRIES
- 15.6.1.1 UAE
- 15.6.1.1.1 Grid expansion and renewable-power integration to accelerate cable demand
- 15.6.1.2 Saudi arabia
- 15.6.1.2.1 Renewable-power evacuation and transmission expansion to drive market
- 15.6.1.3 Rest of GCC countries
- 15.6.1.1 UAE
- 15.6.2 SOUTH AFRICA
- 15.6.2.1 Transmission grid expansion to unlock renewable generation and strengthen cable demand
- 15.6.3 REST OF MIDDLE EAST & AFRICA
- 15.6.1 GCC COUNTRIES
16 COMPETITIVE LANDSCAPE
- 16.1 OVERVIEW
- 16.2 KEY PLAYER STRATEGIES/RIGHT TO WIN
- 16.3 REVENUE ANALYSIS
- 16.4 MARKET SHARE ANALYSIS
- 16.5 BRAND COMPARISON
- 16.6 COMPANY EVALUATION MATRIX: KEY PLAYERS, 2025
- 16.6.1 STARS
- 16.6.2 EMERGING LEADERS
- 16.6.3 PERVASIVE PLAYERS
- 16.6.4 PARTICIPANTS
- 16.6.5 COMPANY FOOTPRINT: KEY PLAYERS, 2025
- 16.6.5.1 Company footprint
- 16.6.5.2 Region footprint
- 16.6.5.3 Product type footprint
- 16.6.5.4 Conductor footprint
- 16.6.5.5 Insulation footprint
- 16.6.5.6 Installation footprint
- 16.6.5.7 Voltage footprint
- 16.6.5.8 End-use industry footprint
- 16.7 COMPANY EVALUATION MATRIX: STARTUPS/SMES, 2025
- 16.7.1 PROGRESSIVE COMPANIES
- 16.7.2 RESPONSIVE COMPANIES
- 16.7.3 DYNAMIC COMPANIES
- 16.7.4 STARTING BLOCKS
- 16.7.5 COMPETITIVE BENCHMARKING: STARTUPS/SMES, 2025
- 16.7.5.1 Detailed list of key startups/SMEs
- 16.7.5.2 Competitive benchmarking of key startups/SMEs
- 16.8 COMPANY VALUATION AND FINANCIAL METRICS
- 16.9 COMPETITIVE SCENARIO
- 16.9.1 PRODUCT LAUNCHES
- 16.9.2 DEALS
- 16.9.3 EXPANSIONS
- 16.9.4 OTHER DEVELOPMENTS
17 COMPANY PROFILES
- 17.1 KEY COMPANIES
- 17.1.1 BELDEN INC.
- 17.1.1.1 Business overview
- 17.1.1.2 Products offered
- 17.1.1.3 Recent developments
- 17.1.1.3.1 Product launches
- 17.1.1.3.2 Expansions
- 17.1.1.4 MnM view
- 17.1.1.4.1 Right to win
- 17.1.1.4.2 Strategic choices
- 17.1.1.4.3 Weaknesses and competitive threats
- 17.1.2 FUJIKURA LTD.
- 17.1.2.1 Business overview
- 17.1.2.2 Products offered
- 17.1.2.3 Recent developments
- 17.1.2.3.1 Product launches
- 17.1.2.3.2 Deals
- 17.1.2.3.3 Expansions
- 17.1.2.4 MnM view
- 17.1.2.4.1 Right to win
- 17.1.2.4.2 Strategic choices
- 17.1.2.4.3 Weaknesses and competitive threats
- 17.1.3 FURUKAWA ELECTRIC CO., LTD.
- 17.1.3.1 Business overview
- 17.1.3.2 Products offered
- 17.1.3.3 Recent developments
- 17.1.3.3.1 Product launches
- 17.1.3.3.2 Deals
- 17.1.3.3.3 Expansions
- 17.1.3.3.4 Other developments
- 17.1.3.4 MnM view
- 17.1.3.4.1 Right to win
- 17.1.3.4.2 Strategic choices
- 17.1.3.4.3 Weaknesses and competitive threats
- 17.1.4 LEONI
- 17.1.4.1 Business overview
- 17.1.4.2 Products offered
- 17.1.4.3 Recent developments
- 17.1.4.3.1 Product launches
- 17.1.4.3.2 Deals
- 17.1.4.3.3 Expansions
- 17.1.4.4 MnM view
- 17.1.4.4.1 Right to win
- 17.1.4.4.2 Strategic choices
- 17.1.4.4.3 Weaknesses and competitive threats
- 17.1.5 EMERSON ELECTRIC CO.
- 17.1.5.1 Business overview
- 17.1.5.2 Products offered
- 17.1.5.3 MnM view
- 17.1.5.3.1 Right to win
- 17.1.5.3.2 Strategic choices
- 17.1.5.3.3 Weaknesses and competitive threats
- 17.1.6 PRYSMIAN
- 17.1.6.1 Business overview
- 17.1.6.2 Products offered
- 17.1.6.3 Recent developments
- 17.1.6.3.1 Deals
- 17.1.6.3.2 Expansions
- 17.1.6.4 MnM view
- 17.1.6.4.1 Right to win
- 17.1.6.4.2 Strategic choices
- 17.1.6.4.3 Weaknesses and competitive threats
- 17.1.7 HELLENIC CABLES
- 17.1.7.1 Business overview
- 17.1.7.2 Products offered
- 17.1.7.3 Recent developments
- 17.1.7.3.1 Deals
- 17.1.7.3.2 Expansions
- 17.1.7.3.3 Other developments
- 17.1.7.4 MnM view
- 17.1.7.4.1 Right to win
- 17.1.7.4.2 Strategic choices
- 17.1.7.4.3 Weaknesses and competitive threats
- 17.1.8 KEI INDUSTRIES
- 17.1.8.1 Business overview
- 17.1.8.2 Products offered
- 17.1.8.3 Recent developments
- 17.1.8.3.1 Product launches
- 17.1.8.3.2 Deals
- 17.1.8.3.3 Expansions
- 17.1.8.4 MnM view
- 17.1.8.4.1 Right to win
- 17.1.8.4.2 Strategic choices
- 17.1.8.4.3 Weaknesses and competitive threats
- 17.1.9 AMPHENOL
- 17.1.9.1 Business overview
- 17.1.9.2 Products offered
- 17.1.9.3 Recent developments
- 17.1.9.3.1 Product launches
- 17.1.9.3.2 Deals
- 17.1.9.3.3 Expansions
- 17.1.9.4 MnM view
- 17.1.9.4.1 Right to win
- 17.1.9.4.2 Strategic choices
- 17.1.9.4.3 Weaknesses and competitive threats
- 17.1.10 FINOLEX CABLES LTD.
- 17.1.10.1 Business overview
- 17.1.10.2 Products offered
- 17.1.10.3 Recent developments
- 17.1.10.3.1 Product launches
- 17.1.10.3.2 Deals
- 17.1.10.3.3 Expansions
- 17.1.10.4 MnM view
- 17.1.10.4.1 Right to win
- 17.1.10.4.2 Strategic choices
- 17.1.10.4.3 Weaknesses and competitive threats
- 17.1.11 NKT A/S
- 17.1.11.1 Business overview
- 17.1.11.2 Products offered
- 17.1.11.3 Recent developments
- 17.1.11.3.1 Product launches
- 17.1.11.3.2 Deals
- 17.1.11.3.3 Expansions
- 17.1.11.4 MnM view
- 17.1.11.4.1 Right to win
- 17.1.11.4.2 Strategic choices
- 17.1.11.4.3 Weaknesses and competitive threats
- 17.1.12 SUMITOMO ELECTRIC INDUSTRIES, LTD.
- 17.1.12.1 Business overview
- 17.1.12.2 Products offered
- 17.1.12.3 Recent developments
- 17.1.12.3.1 Product launches
- 17.1.12.3.2 Deals
- 17.1.12.3.3 Expansions
- 17.1.12.4 MnM view
- 17.1.12.4.1 Right to win
- 17.1.12.4.2 Strategic choices
- 17.1.12.4.3 Weaknesses and competitive threats
- 17.1.13 HELUKABEL
- 17.1.13.1 Business overview
- 17.1.13.2 Products offered
- 17.1.13.3 Recent developments
- 17.1.13.3.1 Product launches
- 17.1.13.3.2 Deals
- 17.1.13.3.3 Expansions
- 17.1.13.4 MnM view
- 17.1.13.4.1 Right to win
- 17.1.13.4.2 Strategic choices
- 17.1.13.4.3 Weaknesses and competitive threats
- 17.1.14 LS CABLE & SYSTEM
- 17.1.14.1 Business overview
- 17.1.14.2 Products offered
- 17.1.14.3 Recent developments
- 17.1.14.3.1 Product launches
- 17.1.14.3.2 Deals
- 17.1.14.3.3 Expansions
- 17.1.14.4 MnM view
- 17.1.14.4.1 Right to win
- 17.1.14.4.2 Strategic choices
- 17.1.14.4.3 Weaknesses and competitive threats
- 17.1.15 NEXANS
- 17.1.15.1 Business overview
- 17.1.15.2 Products offered
- 17.1.15.3 Recent developments
- 17.1.15.3.1 Product launches
- 17.1.15.3.2 Deals
- 17.1.15.3.3 Expansions
- 17.1.15.3.4 Other developments
- 17.1.15.4 MnM view
- 17.1.15.4.1 Right to win
- 17.1.15.4.2 Strategic choices
- 17.1.15.4.3 Weaknesses and competitive threats
- 17.1.16 LAPP GROUP
- 17.1.16.1 Business overview
- 17.1.16.2 Products offered
- 17.1.16.3 Recent developments
- 17.1.16.3.1 Product launches
- 17.1.16.3.2 Deals
- 17.1.16.3.3 Expansions
- 17.1.16.4 MnM view
- 17.1.16.4.1 Right to win
- 17.1.16.4.2 Strategic choices
- 17.1.16.4.3 Weaknesses and competitive threats
- 17.1.1 BELDEN INC.
- 17.2 OTHER PLAYERS
- 17.2.1 SAREL
- 17.2.2 REMEE WIRE & CABLE
- 17.2.3 HUBBELL
- 17.2.4 TRATOS GROUP
- 17.2.5 DONCASTER CABLES
- 17.2.6 TT CABLES
- 17.2.7 BRUGG CABLES
- 17.2.8 STUDER CABLES AG
- 17.2.9 HENAN CENTRAL PLAIN CABLES AND WIRES CO., LTD.
- 17.2.10 CORDS CABLE
18 RESEARCH METHODOLOGY
- 18.1 RESEARCH DATA
- 18.1.1 SECONDARY DATA
- 18.1.1.1 Key data from secondary sources
- 18.1.2 PRIMARY DATA
- 18.1.2.1 Key data from primary sources
- 18.1.2.2 Key primary interview participants
- 18.1.2.3 Breakdown of interviews with experts
- 18.1.2.4 Key industry insights
- 18.1.1 SECONDARY DATA
- 18.2 MARKET SIZE ESTIMATION
- 18.2.1 BOTTOM-UP APPROACH
- 18.2.2 TOP-DOWN APPROACH
- 18.3 BASE NUMBER CALCULATION
- 18.3.1 APPROACH 1: DEMAND-SIDE ANALYSIS
- 18.3.2 APPROACH 2: SUPPLY-SIDE ANALYSIS
- 18.4 FORECAST NUMBER CALCULATION
- 18.5 DATA TRIANGULATION
- 18.6 FACTOR ANALYSIS
- 18.7 RESEARCH ASSUMPTIONS
- 18.8 RESEARCH LIMITATIONS AND RISK ASSESSMENT
19 APPENDIX
- 19.1 DISCUSSION GUIDE
- 19.2 KNOWLEDGESTORE: MARKETSANDMARKETS' SUBSCRIPTION PORTAL
- 19.3 CUSTOMIZATION OPTIONS
- 19.4 RELATED REPORTS
- 19.5 AUTHOR DETAILS
List of Tables
- TABLE 1 WIRE & CABLE MARKET: PORTER'S FIVE FORCES ANALYSIS
- TABLE 2 GDP PERCENTAGE CHANGE, BY KEY COUNTRIES, 2021-2029
- TABLE 3 WIRE & CABLE MARKET: ROLE OF COMPANIES IN ECOSYSTEM
- TABLE 4 AVERAGE SELLING PRICE OF WIRE & CABLE OFFERED BY KEY PLAYERS, BY PRODUCT TYPE, 2025 (USD/KM)
- TABLE 5 AVERAGE SELLING PRICE TREND OF WIRE & CABLE, BY REGION, 2023-2025 (USD/KM)
- TABLE 6 IMPORT DATA FOR HS CODE 761410-COMPLIANT PRODUCTS, 2021-2025 (USD THOUSAND)
- TABLE 7 EXPORT DATA FOR HS CODE 761410-COMPLIANT PRODUCTS, 2021-2025 (USD THOUSAND)
- TABLE 8 WIRE & CABLE MARKET: LIST OF KEY CONFERENCES AND EVENTS, 2026-2027
- TABLE 9 US-ADJUSTED RECIPROCAL TARIFF RATES
- TABLE 10 EXPECTED CHANGE IN PRICES AND IMPACT OF TARIFFS ON END-USE MARKET
- TABLE 11 WIRE & CABLE MARKET: TOTAL NUMBER OF PATENTS, 2015-2025
- TABLE 12 TOP USE CASES AND MARKET POTENTIAL
- TABLE 13 BEST PRACTICES: USE CASES OF COMPANIES IMPLEMENTING AI
- TABLE 14 WIRE & CABLE MARKET: CASE STUDIES RELATED TO AI IMPLEMENTATION
- TABLE 15 INTERCONNECTED ADJACENT ECOSYSTEM AND IMPACT ON MARKET PLAYERS
- TABLE 16 NORTH AMERICA: REGULATORY BODIES, GOVERNMENT AGENCIES, AND OTHER ORGANIZATIONS
- TABLE 17 EUROPE: REGULATORY BODIES, GOVERNMENT AGENCIES, AND OTHER ORGANIZATIONS
- TABLE 18 ASIA PACIFIC: REGULATORY BODIES, GOVERNMENT AGENCIES, AND OTHER ORGANIZATIONS
- TABLE 19 ROW: REGULATORY BODIES, GOVERNMENT AGENCIES, AND OTHER ORGANIZATIONS
- TABLE 20 GLOBAL STANDARDS IN WIRE & CABLE MARKET
- TABLE 21 CERTIFICATIONS, LABELING, ECO-STANDARDS IN WIRE & CABLE MARKET
- TABLE 22 INFLUENCE OF STAKEHOLDERS ON BUYING PROCESS, BY END-USE INDUSTRY (%)
- TABLE 23 KEY BUYING CRITERIA, BY APPLICATION
- TABLE 24 UNMET NEEDS IN WIRE & CABLE MARKET, BY END-USE INDUSTRY
- TABLE 25 WIRE & CABLE MARKET, BY PRODUCT TYPE, 2023-2031 (USD BILLION)
- TABLE 26 WIRE & CABLE MARKET, BY CONDUCTOR, 2023-2031 (USD BILLION)
- TABLE 27 ALUMINUM: WIRE & CABLE MARKET, BY REGION, 2023-2031 (USD BILLION)
- TABLE 28 COPPER: WIRE & CABLE MARKET, BY REGION, 2023-2031 (USD BILLION)
- TABLE 29 OTHER CONDUCTORS: WIRE & CABLE MARKET, BY REGION, 2023-2031 (USD BILLION)
- TABLE 30 WIRE & CABLE MARKET, BY INSULATION, 2023-2031 (USD BILLION)
- TABLE 31 PVC: WIRE & CABLE MARKET, BY REGION, 2023-2031 (USD BILLION)
- TABLE 32 XLPE: WIRE & CABLE MARKET, BY REGION, 2023-2031 (USD BILLION)
- TABLE 33 EPR: WIRE & CABLE MARKET, BY REGION, 2023-2031 (USD BILLION)
- TABLE 34 OTHER INSULATION MATERIALS: WIRE & CABLE MARKET, BY REGION, 2023-2031 (USD BILLION)
- TABLE 35 WIRE & CABLE MARKET, BY INSTALLATION, 2023-2031 (USD BILLION)
- TABLE 36 OVERHEAD: WIRE & CABLE MARKET, BY REGION, 2023-2031 (USD BILLION)
- TABLE 37 UNDERGROUND: WIRE & CABLE MARKET, BY REGION, 2023-2031 (USD BILLION)
- TABLE 38 SUBMARINE: WIRE & CABLE MARKET, BY REGION, 2023-2031 (USD BILLION)
- TABLE 39 WIRE & CABLE MARKET, BY VOLTAGE, 2023-2031 (USD BILLION)
- TABLE 40 LOW VOLTAGE: WIRE & CABLE MARKET, BY REGION, 2023-2031 (USD BILLION)
- TABLE 41 MEDIUM VOLTAGE: WIRE & CABLE MARKET, BY REGION, 2023-2031 (USD BILLION)
- TABLE 42 HIGH VOLTAGE: WIRE & CABLE MARKET, BY REGION, 2023-2031 (USD BILLION)
- TABLE 43 EXTRA-HIGH VOLTAGE: WIRE & CABLE MARKET, BY REGION, 2023-2031 (USD BILLION)
- TABLE 44 WIRE & CABLE MARKET, BY END-USE INDUSTRY, 2023-2031 (USD BILLION)
- TABLE 45 AEROSPACE & DEFENSE: WIRE & CABLE MARKET, BY REGION, 2023-2031 (USD BILLION)
- TABLE 46 BUILDING & CONSTRUCTION: WIRE & CABLE MARKET, BY REGION, 2023-2031 (USD BILLION)
- TABLE 47 OIL & GAS: WIRE & CABLE MARKET, BY REGION, 2023-2031 (USD BILLION)
- TABLE 48 ENERGY & POWER: WIRE & CABLE MARKET, BY REGION, 2023-2031 (USD BILLION)
- TABLE 49 IT & TELECOM: WIRE & CABLE MARKET, BY REGION, 2023-2031 (USD BILLION)
- TABLE 50 AUTOMOTIVE: WIRE & CABLE MARKET, BY REGION, 2023-2031 (USD BILLION)
- TABLE 51 MEDICAL EQUIPMENT: WIRE & CABLE MARKET, BY REGION, 2023-2031 (USD BILLION)
- TABLE 52 OTHER END-USE INDUSTRIES: WIRE & CABLE MARKET, BY REGION, 2023-2031 (USD BILLION)
- TABLE 53 WIRE & CABLE MARKET, BY REGION, 2023-2031 (USD BILLION)
- TABLE 54 NORTH AMERICA: WIRE & CABLE MARKET, BY CONDUCTOR, 2023-2031 (USD BILLION)
- TABLE 55 NORTH AMERICA: WIRE & CABLE MARKET, BY INSULATION, 2023-2031 (USD BILLION)
- TABLE 56 NORTH AMERICA: WIRE & CABLE MARKET, BY VOLTAGE, 2023-2031 (USD BILLION)
- TABLE 57 NORTH AMERICA: WIRE & CABLE MARKET, BY INSTALLATION, 2023-2031 (USD BILLION)
- TABLE 58 NORTH AMERICA: WIRE & CABLE MARKET, BY END-USE INDUSTRY, 2023-2031 (USD BILLION)
- TABLE 59 NORTH AMERICA: WIRE & CABLE MARKET, BY COUNTRY, 2023-2031 (USD BILLION)
- TABLE 60 US: WIRE & CABLE MARKET, BY END-USE INDUSTRY 2023-2031 (USD BILLION)
- TABLE 61 CANADA: WIRE & CABLE MARKET, BY END-USE INDUSTRY, 2023-2031 (USD BILLION)
- TABLE 62 EUROPE: WIRE & CABLE MARKET, BY CONDUCTOR, 2023-2031 (USD BILLION)
- TABLE 63 EUROPE: WIRE & CABLE MARKET, BY INSULATION, 2023-2031 (USD BILLION)
- TABLE 64 EUROPE: WIRE & CABLE MARKET, BY VOLTAGE, 2023-2031 (USD BILLION)
- TABLE 65 EUROPE: WIRE & CABLE MARKET, BY INSTALLATION, 2023-2031 (USD BILLION)
- TABLE 66 EUROPE: WIRE & CABLE MARKET, BY END-USE INDUSTRY, 2023-2031 (USD BILLION)
- TABLE 67 EUROPE: WIRE & CABLE MARKET, BY COUNTRY, 2023-2031 (USD BILLION)
- TABLE 68 GERMANY: WIRE & CABLE MARKET, BY END-USE INDUSTRY, 2023-2031 (USD BILLION)
- TABLE 69 FRANCE: WIRE & CABLE MARKET, BY END-USE INDUSTRY, 2023-2031 (USD BILLION)
- TABLE 70 UK: WIRE & CABLE MARKET, BY END-USE INDUSTRY, 2023-2031 (USD BILLION)
- TABLE 71 ITALY: WIRE & CABLE MARKET, BY END-USE INDUSTRY, 2023-2031 (USD BILLION)
- TABLE 72 SPAIN: WIRE & CABLE MARKET, BY END-USE INDUSTRY, 2023-2031 (USD BILLION)
- TABLE 73 RUSSIA: WIRE & CABLE MARKET, BY END-USE INDUSTRY, 2023-2031 (USD BILLION)
- TABLE 74 REST OF EUROPE: WIRE & CABLE MARKET, BY END-USE INDUSTRY, 2023-2031 (USD BILLION)
- TABLE 75 ASIA PACIFIC: WIRE & CABLE MARKET, BY CONDUCTOR, 2023-2031 (USD BILLION)
- TABLE 76 ASIA PACIFIC: WIRE & CABLE MARKET, BY INSULATION, 2023-2031 (USD BILLION)
- TABLE 77 ASIA PACIFIC: WIRE & CABLE MARKET, BY VOLTAGE, 2023-2031 (USD BILLION)
- TABLE 78 ASIA PACIFIC: WIRE & CABLE MARKET, BY INSTALLATION, 2023-2031 (USD BILLION)
- TABLE 79 ASIA PACIFIC: WIRE & CABLE MARKET, BY END-USE INDUSTRY, 2023-2031 (USD BILLION)
- TABLE 80 ASIA PACIFIC: WIRE & CABLE MARKET, BY COUNTRY, 2023-2031 (USD BILLION)
- TABLE 81 CHINA: WIRE & CABLE MARKET, BY END-USE INDUSTRY, 2023-2031 (USD BILLION)
- TABLE 82 JAPAN: WIRE & CABLE MARKET, BY END-USE INDUSTRY, 2023-2031 (USD BILLION)
- TABLE 83 INDIA: WIRE & CABLE MARKET, BY END-USE INDUSTRY, 2023-2031 (USD BILLION)
- TABLE 84 SOUTH KOREA: WIRE & CABLE MARKET, BY END-USE INDUSTRY, 2023-2031 (USD BILLION)
- TABLE 85 AUSTRALIA: WIRE & CABLE MARKET, BY END-USE INDUSTRY, 2023-2031 (USD BILLION)
- TABLE 86 REST OF ASIA PACIFIC: WIRE & CABLE MARKET, BY END-USE INDUSTRY, 2023-2031 (USD BILLION)
- TABLE 87 LATIN AMERICA: WIRE & CABLE MARKET, BY CONDUCTOR, 2023-2031 (USD BILLION)
- TABLE 88 LATIN AMERICA: WIRE & CABLE MARKET, BY INSULATION, 2023-2031 (USD BILLION)
- TABLE 89 LATIN AMERICA: WIRE & CABLE MARKET, BY VOLTAGE, 2023-2031 (USD BILLION)
- TABLE 90 LATIN AMERICA: WIRE & CABLE MARKET, BY INSTALLATION, 2023-2031 (USD BILLION)
- TABLE 91 LATIN AMERICA: WIRE & CABLE MARKET, BY END-USE INDUSTRY, 2023-2031 (USD BILLION)
- TABLE 92 LATIN AMERICA: WIRE & CABLE MARKET, BY COUNTRY, 2023-2031 (USD BILLION)
- TABLE 93 BRAZIL: WIRE & CABLE MARKET, BY END-USE INDUSTRY, 2023-2031 (USD BILLION)
- TABLE 94 MEXICO: WIRE & CABLE MARKET, BY END-USE INDUSTRY, 2023-2031 (USD BILLION)
- TABLE 95 REST OF LATIN AMERICA: WIRE & CABLE MARKET, BY END-USE INDUSTRY, 2023-2031 (USD BILLION)
- TABLE 96 MIDDLE EAST & AFRICA: WIRE & CABLE MARKET, BY CONDUCTOR, 2023-2031 (USD BILLION)
- TABLE 97 MIDDLE EAST & AFRICA: WIRE & CABLE MARKET, BY INSULATION, 2023-2031 (USD BILLION)
- TABLE 98 MIDDLE EAST & AFRICA: WIRE & CABLE MARKET, BY VOLTAGE, 2023-2031 (USD BILLION)
- TABLE 99 MIDDLE EAST & AFRICA: WIRE & CABLE MARKET, BY INSTALLATION, 2023-2031 (USD BILLION)
- TABLE 100 MIDDLE EAST & AFRICA: WIRE & CABLE MARKET, BY END-USE INDUSTRY, 2023-2031 (USD BILLION)
- TABLE 101 MIDDLE EAST & AFRICA: WIRE & CABLE MARKET, BY COUNTRY, 2023-2031 (USD BILLION)
- TABLE 102 UAE: WIRE & CABLE MARKET, BY END-USE INDUSTRY, 2023-2031 (USD BILLION)
- TABLE 103 SAUDI ARABIA: WIRE & CABLE MARKET, BY END-USE INDUSTRY, 2023-2031 (USD BILLION)
- TABLE 104 REST OF GCC COUNTRIES: WIRE & CABLE MARKET, BY END-USE INDUSTRY, 2023-2031 (USD BILLION)
- TABLE 105 SOUTH AFRICA: WIRE & CABLE MARKET, BY END-USE INDUSTRY, 2023-2031 (USD BILLION)
- TABLE 106 REST OF MIDDLE EAST & AFRICA: WIRE & CABLE MARKET, BY END-USE INDUSTRY, 2023-2031 (USD BILLION)
- TABLE 107 WIRE & CABLE MARKET: OVERVIEW OF KEY STRATEGIES ADOPTED BY MAJOR PLAYERS, 2023-2026
- TABLE 108 WIRE & CABLE MARKET: DEGREE OF COMPETITION, 2025
- TABLE 109 WIRE & CABLE MARKET: REGION FOOTPRINT
- TABLE 110 WIRE & CABLE MARKET: PRODUCT TYPE FOOTPRINT
- TABLE 111 WIRE & CABLE MARKET: CONDUCTOR FOOTPRINT
- TABLE 112 WIRE & CABLE MARKET: INSULATION FOOTPRINT
- TABLE 113 WIRE & CABLE MARKET: INSTALLATION FOOTPRINT
- TABLE 114 WIRE & CABLE MARKET: VOLTAGE FOOTPRINT
- TABLE 115 WIRE & CABLE MARKET: END-USE INDUSTRY FOOTPRINT
- TABLE 116 WIRE & CABLE MARKET: DETAILED LIST OF KEY STARTUPS/SMES
- TABLE 117 WIRE & CABLE MARKET: COMPETITIVE BENCHMARKING OF KEY STARTUPS/ SMES (1/3)
- TABLE 118 WIRE & CABLE MARKET: COMPETITIVE BENCHMARKING OF KEY STARTUPS/ SMES (2/3)
- TABLE 119 WIRE & CABLE MARKET: COMPETITIVE BENCHMARKING OF KEY STARTUPS/ SMES (3/3)
- TABLE 120 WIRE & CABLE MARKET: PRODUCT LAUNCHES, JANUARY 2023 - AUGUST 2026
- TABLE 121 WIRE & CABLE MARKET: DEALS, JANUARY 2023 - AUGUST 2026
- TABLE 122 WIRE & CABLE MARKET: EXPANSIONS, JANUARY 2023-AUGUST 2026
- TABLE 123 WIRE & CABLE MARKET: OTHER DEVELOPMENTS, JANUARY 2023 - AUGUST 2026
- TABLE 124 BELDEN INC.: COMPANY OVERVIEW
- TABLE 125 BELDEN INC.: PRODUCTS OFFERED
- TABLE 126 BELDEN INC.: PRODUCT LAUNCHES
- TABLE 127 BELDEN INC.: EXPANSIONS
- TABLE 128 FUJIKURA LTD.: COMPANY OVERVIEW
- TABLE 129 FUJIKURA LTD.: PRODUCTS OFFERED
- TABLE 130 FUJIKURA LTD.: PRODUCT LAUNCHES
- TABLE 131 FUJIKURA LTD.: DEALS
- TABLE 132 FUJIKURA LTD.: EXPANSIONS
- TABLE 133 FURUKAWA ELECTRIC CO., LTD.: COMPANY OVERVIEW
- TABLE 134 FURUKAWA ELECTRIC CO., LTD.: PRODUCTS OFFERED
- TABLE 135 FURUKAWA ELECTRIC CO., LTD.: PRODUCT LAUNCHES
- TABLE 136 FURUKAWA ELECTRIC CO., LTD.: DEALS
- TABLE 137 FURUKAWA ELECTRIC CO., LTD.: EXPANSIONS
- TABLE 138 FURUKAWA ELECTRIC CO., LTD.: OTHER DEVELOPMENTS
- TABLE 139 LEONI: COMPANY OVERVIEW
- TABLE 140 LEONI: PRODUCTS OFFERED
- TABLE 141 LEONI: PRODUCT LAUNCHES
- TABLE 142 LEONI: DEALS
- TABLE 143 LEONI AG: EXPANSIONS
- TABLE 144 EMERSON ELECTRIC CO.: COMPANY OVERVIEW
- TABLE 145 EMERSON ELECTRIC CO.: PRODUCTS OFFERED
- TABLE 146 PRYSMIAN: COMPANY OVERVIEW
- TABLE 147 PRYSMIAN: PRODUCTS OFFERED
- TABLE 148 PRYSMIAN: PRODUCT LAUNCHES
- TABLE 149 PRYSMIAN: DEALS
- TABLE 150 PRYSMIAN: EXPANSIONS
- TABLE 151 HELLENIC CABLES: COMPANY OVERVIEW
- TABLE 152 HELLENIC CABLES: PRODUCTS OFFERED
- TABLE 153 HELLENIC CABLES: DEALS
- TABLE 154 HELLENIC CABLES: EXPANSIONS
- TABLE 155 HELLENIC CABLES: OTHER DEVELOPMENTS
- TABLE 156 KEI INDUSTRIES: COMPANY OVERVIEW
- TABLE 157 KEI INDUSTRIES: PRODUCTS OFFERED
- TABLE 158 KEI INDUSTRIES: PRODUCT LAUNCHES
- TABLE 159 KEI INDUSTRIES: DEALS
- TABLE 160 KEI INDUSTRIES: EXPANSIONS
- TABLE 161 AMPHENOL: COMPANY OVERVIEW
- TABLE 162 AMPHENOL: PRODUCTS OFFERED
- TABLE 163 AMPHENOL: PRODUCT LAUNCHES
- TABLE 164 AMPHENOL: DEALS
- TABLE 165 AMPHENOL: EXPANSIONS
- TABLE 166 FINOLEX CABLES LTD.: COMPANY OVERVIEW
- TABLE 167 FINOLEX CABLES LTD.: PRODUCTS OFFERED
- TABLE 168 FINOLEX CABLES LTD.: PRODUCT LAUNCHES
- TABLE 169 FINOLEX CABLES LTD.: DEALS
- TABLE 170 FINOLEX CABLES LTD.: EXPANSIONS
- TABLE 171 NKT A/S: COMPANY OVERVIEW
- TABLE 172 NKT A/S: PRODUCTS OFFERED
- TABLE 173 NKT A/S.: PRODUCT LAUNCHES
- TABLE 174 NKT A/S: DEALS
- TABLE 175 NKT A/S: EXPANSIONS
- TABLE 176 SUMITOMO ELECTRIC INDUSTRIES, LTD.: COMPANY OVERVIEW
- TABLE 177 SUMITOMO ELECTRIC INDUSTRIES, LTD.: PRODUCTS OFFERED
- TABLE 178 SUMITOMO ELECTRIC INDUSTRIES, LTD.: PRODUCT LAUNCHES
- TABLE 179 SUMITOMO ELECTRIC INDUSTRIES, LTD.: DEALS
- TABLE 180 SUMITOMO ELECTRIC INDUSTRIES, LTD.: EXPANSION
- TABLE 181 HELUKABEL: COMPANY OVERVIEW
- TABLE 182 HELUKABEL: PRODUCTS OFFERED
- TABLE 183 HELUKABEL: PRODUCT LAUNCHES
- TABLE 184 HELUKABEL: DEALS
- TABLE 185 HELUKABEL: EXPANSION
- TABLE 186 LS CABLE & SYSTEM: COMPANY OVERVIEW
- TABLE 187 LS CABLE & SYSTEM: PRODUCTS OFFERED
- TABLE 188 LS CABLE & SYSTEM: PRODUCT LAUNCHES
- TABLE 189 LS CABLE & SYSTEM: DEALS
- TABLE 190 LS CABLE & SYSTEM: EXPANSIONS
- TABLE 191 NEXANS: COMPANY OVERVIEW
- TABLE 192 NEXANS: PRODUCTS OFFERED
- TABLE 193 NEXANS: PRODUCT LAUNCHES
- TABLE 194 NEXANS: DEALS
- TABLE 195 NEXANS: EXPANSIONS
- TABLE 196 NEXANS: OTHER DEVELOPMENTS
- TABLE 197 LAPP GROUP: COMPANY OVERVIEW
- TABLE 198 LAPP GROUP: PRODUCTS OFFERED
- TABLE 199 LAPP GROUP: PRODUCT LAUNCHES
- TABLE 200 LAPP GROUP: DEALS
- TABLE 201 LAPP GROUP: EXPANSIONS
- TABLE 202 SAREL: COMPANY OVERVIEW
- TABLE 203 REMEE WIRE & CABLE: COMPANY OVERVIEW
- TABLE 204 HUBBELL: COMPANY OVERVIEW
- TABLE 205 TRATOS GROUP: COMPANY OVERVIEW
- TABLE 206 DONCASTER CABLES: COMPANY OVERVIEW
- TABLE 207 TT CABLES: COMPANY OVERVIEW
- TABLE 208 BRUGG CABLES: COMPANY OVERVIEW
- TABLE 209 STUDER CABLES AG: COMPANY OVERVIEW
- TABLE 210 HENAN CENTRAL PLAIN CABLES AND WIRES CO., LTD.: COMPANY OVERVIEW
- TABLE 211 CORDS CABLE: COMPANY OVERVIEW
- TABLE 212 LIST OF PRIMARY INTERVIEW PARTICIPANTS
List of Figures
- FIGURE 1 WIRE & CABLE MARKET: SEGMENTATION AND REGIONAL SCOPE
- FIGURE 2 KEY INSIGHTS AND MARKET HIGHLIGHTS
- FIGURE 3 WIRE & CABLE MARKET, 2026-2031
- FIGURE 4 MAJOR STRATEGIES ADOPTED BY KEY PLAYERS IN WIRE & CABLE MARKET (2023-2025)
- FIGURE 5 DISRUPTIVE TRENDS IMPACTING GROWTH OF WIRE & CABLE MARKET
- FIGURE 6 MARKET SHARE OF KEY SEGMENTS IN WIRE & CABLE MARKET, 2025
- FIGURE 7 ASIA PACIFIC TO BE FASTEST-GROWING REGION IN GLOBAL WIRE & CABLE MARKET
- FIGURE 8 GRID MODERNIZATION, ELECTRIFICATION, AND INFRASTRUCTURE DEVELOPMENT DRIVING GLOBAL WIRE & CABLE MARKET
- FIGURE 9 ENERGY & POWER AND ASIA PACIFIC ACCOUNTED FOR LARGEST MARKET SHARE IN 2025
- FIGURE 10 OVERHEAD ACCOUNTED FOR LARGEST SHARE OF WIRE & CABLE MARKET IN 2025
- FIGURE 11 INDIA TO REGISTER HIGHEST CAGR DURING FORECAST PERIOD
- FIGURE 12 WIRE & CABLE MARKET: DRIVERS, RESTRAINTS, OPPORTUNITIES, AND CHALLENGES
- FIGURE 13 WIRE & CABLE MARKET: PORTER'S FIVE FORCES ANALYSIS
- FIGURE 14 WIRE & CABLE MARKET: VALUE CHAIN ANALYSIS
- FIGURE 15 WIRE & CABLE MARKET: KEY PARTICIPANTS IN ECOSYSTEM
- FIGURE 16 WIRE & CABLE MARKET: ECOSYSTEM ANALYSIS
- FIGURE 17 IMPORT SCENARIO FOR HS CODE 761410-COMPLIANT PRODUCTS, BY KEY COUNTRIES, 2021-2025
- FIGURE 18 EXPORT SCENARIO FOR HS CODE 761410-COMPLIANT PRODUCTS, BY KEY COUNTRIES, 2021-2025
- FIGURE 19 TRENDS/DISRUPTIONS INFLUENCING CUSTOMER BUSINESS
- FIGURE 20 WIRE & CABLE MARKET: INVESTMENT AND FUNDING SCENARIO, 2022-2025
- FIGURE 21 PATENT ANALYSIS, BY DOCUMENT TYPE, 2015-2025
- FIGURE 22 PATENT PUBLICATION TRENDS, 2015-2025
- FIGURE 23 WIRE & CABLE MARKET: LEGAL STATUS OF PATENTS, 2015-2025
- FIGURE 24 JURISDICTION OF CHINA REGISTERED HIGHEST SHARE OF PATENTS, 2015-2025
- FIGURE 25 TOP PATENT APPLICANTS, 2015-2025
- FIGURE 26 FUTURE APPLICATIONS OF WIRE & CABLE
- FIGURE 27 WIRE & CABLE MARKET: DECISION-MAKING FACTORS
- FIGURE 28 INFLUENCE OF STAKEHOLDERS ON BUYING PROCESS, BY END-USE INDUSTRY
- FIGURE 29 KEY BUYING CRITERIA, BY END-USE INDUSTRY
- FIGURE 30 ADOPTION BARRIERS & INTERNAL CHALLENGES
- FIGURE 31 ELECTRONIC WIRES SEGMENT TO REGISTER HIGHEST CAGR DURING FORECAST PERIOD
- FIGURE 32 ALUMINUM SEGMENT TO REGISTER FASTEST GROWTH RATE IN WIRE & CABLE MARKET DURING FORECAST PERIOD
- FIGURE 33 XLPE SEGMENT TO LEAD WIRE & CABLE MARKET DURING FORECAST PERIOD
- FIGURE 34 UNDERGROUND INSTALLATION SEGMENT TO LEAD WIRE & CABLE MARKET DURING FORECAST PERIOD
- FIGURE 35 LOW-VOLTAGE SEGMENT TO LEAD WIRE & CABLE MARKET
- FIGURE 36 ENERGY & POWER INDUSTRY TO DOMINATE WIRE & CABLE MARKET DURING FORECAST PERIOD
- FIGURE 37 INDIA TO BE FASTEST-GROWING WIRE & CABLE MARKET DURING FORECAST PERIOD
- FIGURE 38 NORTH AMERICA: WIRE & CABLE MARKET SNAPSHOT
- FIGURE 39 EUROPE: WIRE & CABLE MARKET SNAPSHOT
- FIGURE 40 ASIA PACIFIC: WIRE & CABLE MARKET SNAPSHOT
- FIGURE 41 WIRE & CABLE MARKET: REVENUE ANALYSIS OF KEY PLAYERS, 2021-2025 (USD MILLION)
- FIGURE 42 WIRE & CABLE MARKET SHARE ANALYSIS, 2025
- FIGURE 43 WIRE & CABLE MARKET: BRAND COMPARISON
- FIGURE 44 WIRE & CABLE MARKET: COMPANY EVALUATION MATRIX (KEY PLAYERS), 2025
- FIGURE 45 WIRE & CABLE MARKET: COMPANY FOOTPRINT
- FIGURE 46 WIRE & CABLE MARKET: COMPANY EVALUATION MATRIX (STARTUPS/SMES), 2025
- FIGURE 47 WIRE & CABLE MARKET: EV/EBITDA OF KEY MANUFACTURERS
- FIGURE 48 WIRE & CABLE MARKET: YEAR-TO-DATE (YTD) PRICE TOTAL RETURN AND 5-YEAR STOCK BETA OF KEY MANUFACTURERS
- FIGURE 49 WIRE & CABLE MARKET: ENTERPRISE VALUATION OF KEY PLAYERS, 2026
- FIGURE 50 BELDEN INC.: COMPANY SNAPSHOT
- FIGURE 51 FUJIKURA LTD.: COMPANY SNAPSHOT
- FIGURE 52 FURUKAWA ELECTRIC CO., LTD.: COMPANY SNAPSHOT
- FIGURE 53 LEONI: COMPANY SNAPSHOT
- FIGURE 54 EMERSON ELECTRIC CO.: COMPANY SNAPSHOT
- FIGURE 55 PRYSMIAN: COMPANY SNAPSHOT
- FIGURE 56 HELLENIC CABLES: COMPANY SNAPSHOT
- FIGURE 57 KEI INDUSTRIES: COMPANY SNAPSHOT
- FIGURE 58 AMPHENOL: COMPANY SNAPSHOT
- FIGURE 59 FINOLEX CABLES LTD.: COMPANY SNAPSHOT
- FIGURE 60 NKT A/S: COMPANY SNAPSHOT
- FIGURE 61 SUMITOMO ELECTRIC INDUSTRIES, LTD.: COMPANY SNAPSHOT
- FIGURE 62 LS CABLE & SYSTEM: COMPANY SNAPSHOT
- FIGURE 63 NEXANS: COMPANY SNAPSHOT
- FIGURE 64 LAPP GROUP: COMPANY SNAPSHOT
- FIGURE 65 WIRE & CABLE MARKET: RESEARCH DESIGN
- FIGURE 66 MARKET SIZE ESTIMATION METHODOLOGY: BOTTOM-UP APPROACH & TOP-DOWN APPROACH
- FIGURE 67 WIRE & CABLE MARKET: DATA TRIANGULATION

