PUBLISHER: MarketsandMarkets | PRODUCT CODE: 2181755

PUBLISHER: MarketsandMarkets | PRODUCT CODE: 2181755
Green Methanol Market by Feedstock (Biomass, Green Hydrogen, CCS), Derivative (Formaldehyde, Dimethyl Ether & Methyl Tert-Butyl Ether, Gasoline, Methanol-to-Olefin, Solvents), Application (Chemical Feedstock, Fuel), and Region - Global Forecast to 2032
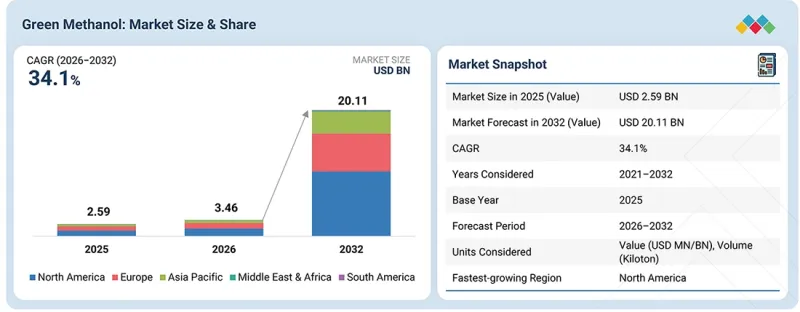
The global green methanol market is anticipated to expand from USD 3.46 billion in 2026 to USD 20.11 billion by 2032, registering a CAGR of 34.1% from 2026 to 2032.
| Scope of the Report | |
|---|---|
| Years Considered for the Study | 2021-2032 |
| Base Year | 2025 |
| Forecast Period | 2026-2032 |
| Units Considered | Value (USD Million/Billion) and Volume (Kilotons) |
| Segments | Green Methanol by region, feedstock, application, and derivative |
| Regions covered | Europe, Asia Pacific, South America, North America, Middle East & Africa |
Stringent government regulations aimed at reducing carbon dioxide emissions and combating climate change propel this growth. Green methanol, produced from renewable sources such as captured CO2 and renewable hydrogen, serves as a sustainable alternative to conventional methanol derived from fossil fuels. This regulatory environment incentivizes industries to adopt green methanol.
"By feedstock, carbon capture and storage is projected to be the fastest-growing segment of the green methanol market during 2026 to 2032, in terms of volume."
Carbon capture and storage (CCS) is rapidly emerging as a key feedstock for green methanol due to its ability to reduce carbon emissions and provide a sustainable source of carbon dioxide (CO2) for methanol production. CCS technology captures CO2 from industrial facilities or directly from the atmosphere, stores it underground to prevent it from contributing to climate change, and then combines it with renewable hydrogen to produce methanol.
The growth of CCS is largely attributed to its cost-effective method of sourcing CO2 for methanol production while adhering to stringent environmental regulations. Governments are actively supporting CCS through incentives and tax benefits to promote its adoption. As industries and economies increasingly prioritize emission reduction, CCS is becoming an essential component in the production of green methanol, helping industries achieve greater sustainability.
"By application, fuel is estimated to be the fastest-growing segment of the green methanol market from 2026 to 2032."
Fuel is expected to be the fastest-growing application segment in the green methanol market from 2026 to 2032, driven by stricter environmental regulations and a shift toward sustainable energy. Green methanol provides a lower-carbon alternative for sectors like shipping, transportation (either blended with gasoline or used in specific engines), and power generation. Its high energy density and compatibility with existing infrastructure make it an attractive option for the transportation sector, facilitating easier adoption without significant infrastructure changes.
"The green methanol market in the North America region is projected to witness the highest CAGR during the forecast period."
North America is projected to witness the highest CAGR in the green methanol market during the forecast period due to its strong commitment to sustainability, government incentives, and increasing investments in renewable energy. North American companies are leading in green methanol production technology and infrastructure development, positioning them well to capture a larger market share. The US is leading the charge with supportive policies, such as tax credits and renewable fuel mandates, which encourage the growth of green methanol production. Moreover, technological advancements in carbon capture and renewable hydrogen are accelerating the region's shift toward cleaner fuels, making it a key driver of market expansion in the coming years.
Profile breakdown of primary participants for the report:
- By Company Type: Tier 1 - 40%, Tier 2 - 20%, and Tier 3 - 40%
- By Designation: C-level Executives - 20%, Directors - 50%, and Others - 30%
- By Region: North America - 20%, Europe - 40%, Asia Pacific - 30%, the Middle East & Africa- 5%, and South America - 5%
Key players in the green methanol market include Enerkem Inc. (Canada), Proman (Switzerland), Sodra (Sweden), SunGas Renewables Inc. (US), ABEL Energy Pty Ltd. (Australia), Carbon Recycling International Inc. (Iceland), Petroliam Nasional Berhad (PETRONAS)(Malaysia), Mitsubishi Gas Chemical Company, Inc. (Japan), Methanex Corporation (Canada), Envision Energy (China), Alberta-Pacific Forest Industries Inc. (Canada), and others.
Research Coverage:
The report outlines, categorizes, and forecasts the green methanol market size across derivatives, sub-derivatives, end-uses, and geographical regions. It provides strategic profiles of major players, thoroughly examining their market presence and key strengths. Additionally, the report monitors and evaluates competitive activities such as acquisitions, agreements, investments, joint ventures, mergers, product launches, expansions, divestments, and partnerships undertaken by these players within the market.
Reasons to Buy the Report:
The report aims to assist market leaders and newcomers by offering precise revenue estimations for the green methanol market and its segments. It also provides stakeholders with a clearer view of the market's competitive landscape, helping them enhance their business positions and develop effective market strategies. Furthermore, the report enables stakeholders to grasp the market dynamics by highlighting key drivers, obstacles, challenges, and opportunities. Key insights provided by the report include:
- Analysis of key drivers (growing demand for sustainable fuels, increasing support for renewable energy sources), restraints (high production costs), opportunities (use of green methanol as an alternative fuel in marine and manufacturing industries, technological advancements), and challenges (capital-intensive environment, volatility in feedstock prices) influencing the growth of the green methanol market.
- Product Development/Innovation: Detailed insights on upcoming technologies and research & development activities in the green methanol market.
- Market Development: Comprehensive information about lucrative markets - the report analyzes the green methanol market across varied regions.
- Market Diversification: Exhaustive information about new products & services, untapped geographies, recent developments, and investments in the green methanol market.
- Competitive Assessment: Detailed analysis of market share, growth strategies, and service offerings of top players such as Proman (Switzerland), Sodra (Sweden), Enerkem Inc. (Canada), SunGas Renewables Inc. (US), ABEL Energy Pty Ltd. (Australia), Carbon Recycling International Inc. (Iceland), Petroliam Nasional Berhad (PETRONAS) (Malaysia), Mitsubishi Gas Chemical Company, Inc. (Japan), Methanex Corporation (Canada), Envision Energy (China), and Alberta-Pacific Forest Industries Inc. (Canada), among others, in the green methanol market.
TABLE OF CONTENTS
1 INTRODUCTION
- 1.1 STUDY OBJECTIVES
- 1.2 COMPETITIVE INTELLIGENCE
- 1.3 MARKET DEFINITION
- 1.4 STUDY SCOPE
- 1.4.1 YEARS CONSIDERED
- 1.4.2 INCLUSIONS AND EXCLUSIONS
- 1.4.3 CURRENCY CONSIDERED
- 1.4.4 UNIT CONSIDERED
- 1.5 RESEARCH LIMITATIONS
- 1.6 STAKEHOLDERS
- 1.7 SUMMARY OF CHANGES
2 EXECUTIVE SUMMARY
- 2.1 KEY INSIGHTS AND MARKET HIGHLIGHTS
- 2.2 KEY MARKET PARTICIPANTS: SHARE INSIGHTS AND STRATEGIC DEVELOPMENTS
- 2.3 DISRUPTIVE TRENDS SHAPING MARKET
- 2.4 HIGH-GROWTH SEGMENTS & EMERGING FRONTIERS
- 2.5 SNAPSHOT: GLOBAL MARKET SIZE, GROWTH RATE, AND FORECAST
3 PREMIUM INSIGHTS
- 3.1 ATTRACTIVE OPPORTUNITIES FOR PLAYERS IN GREEN METHANOL MARKET
- 3.2 GREEN METHANOL MARKET, BY REGION
- 3.3 GREEN METHANOL MARKET, BY FEEDSTOCK
- 3.4 GREEN METHANOL MARKET, BY APPLICATION
- 3.5 GREEN METHANOL MARKET, BY COUNTRY
4 MARKET OVERVIEW
- 4.1 INTRODUCTION
- 4.2 MARKET DYNAMICS
- 4.2.1 DRIVERS
- 4.2.1.1 Increasing demand for sustainable and renewable energy
- 4.2.1.2 Demand for green methanol in automotive and construction industries
- 4.2.2 RESTRAINTS
- 4.2.2.1 Competing fuel options - ethanol, hydrogen, and biodiesel
- 4.2.3 OPPORTUNITIES
- 4.2.3.1 Green methanol as alternative fuel in marine and manufacturing industries
- 4.2.3.2 Green methanol fuel cells in transportation and energy sectors
- 4.2.4 CHALLENGES
- 4.2.4.1 Cost competitiveness to produce green methanol
- 4.2.4.2 Low consumer awareness of green methanol benefits
- 4.2.4.3 Infrastructure, scale, and efficiency limitations for production
- 4.2.1 DRIVERS
- 4.3 PORTER'S FIVE FORCES ANALYSIS
- 4.3.1 BARGAINING POWER OF SUPPLIERS
- 4.3.2 BARGAINING POWER OF BUYERS
- 4.3.3 THREAT OF NEW ENTRANTS
- 4.3.4 THREAT OF SUBSTITUTES
- 4.3.5 INTENSITY OF COMPETITIVE RIVALRY
- 4.4 MACROECONOMIC OUTLOOK
- 4.4.1 INTRODUCTION
- 4.4.2 GDP TRENDS AND FORECAST
- 4.4.3 TRENDS IN GLOBAL GREEN METHANOL INDUSTRY
- 4.5 PRICING ANALYSIS
- 4.5.1 AVERAGE SELLING PRICE TREND OF KEY PLAYERS, 2021-2024
- 4.5.2 AVERAGE SELLING PRICE TREND, BY FEEDSTOCK, 2024
- 4.5.3 AVERAGE SELLING PRICE TREND, BY REGION, 2022-2025
- 4.6 VALUE CHAIN ANALYSIS
- 4.7 ECOSYSTEM MAP
- 4.8 REGULATORY LANDSCAPE
- 4.8.1 REGULATORY BODIES, GOVERNMENT AGENCIES, AND OTHER ORGANIZATIONS
- 4.9 TECHNOLOGY ANALYSIS
- 4.9.1 KEY TECHNOLOGIES
- 4.9.1.1 Bio-methanol and e-methanol production technologies
- 4.9.2 ADJACENT TECHNOLOGIES
- 4.9.2.1 Grey, brown, and blue methanol production technologies
- 4.9.3 COMPLEMENTARY TECHNOLOGIES
- 4.9.3.1 Carbon capture and utilization of methanol production technologies
- 4.9.1 KEY TECHNOLOGIES
- 4.10 KEY CONFERENCES AND EVENTS, 2026-2027
- 4.11 TRADE ANALYSIS
- 4.11.1 IMPORT SCENARIO (HS CODE 290511)
- 4.11.2 IMPORT SCENARIO (HS CODE 290511)
- 4.11.3 EXPORT SCENARIO (HS CODE 290511)
- 4.11.4 EXPORT SCENARIO (HS CODE 290511)
- 4.12 KEY STAKEHOLDERS AND BUYING CRITERIA
- 4.12.1 KEY STAKEHOLDERS IN BUYING PROCESS
- 4.12.2 BUYING CRITERIA
- 4.13 PATENT ANALYSIS
- 4.13.1 METHODOLOGY
- 4.13.2 MAJOR PATENTS RELATED TO GREEN METHANOL
- 4.14 INVESTMENT AND FUNDING SCENARIO
- 4.15 CASE STUDY ANALYSIS
- 4.15.1 CARBON RECYCLING INTERNATIONAL OBTAINS RENEWABLE METHANOL FROM CO2
- 4.15.2 ENERKEM PRODUCES RENEWABLE METHANOL FROM MUNICIPAL SOLID WASTE
- 4.15.3 BIOMCN PROCESSES RENEWABLE METHANOL FROM BIOGAS
- 4.16 TRENDS/DISRUPTIONS IMPACTING CUSTOMER BUSINESS
- 4.17 IMPACT OF 2025 US TARIFF ON GREEN METHANOL MARKET
- 4.17.1 KEY TARIFF RATES
- 4.17.1.1 Key product-related tariffs effective for green methanol
- 4.17.2 PRICE IMPACT ANALYSIS
- 4.17.3 IMPACT ON COUNTRY/REGION
- 4.17.3.1 US
- 4.17.3.2 Europe
- 4.17.3.3 Asia Pacific
- 4.17.4 IMPACT ON APPLICATIONS
- 4.17.4.1 Chemical feedstock
- 4.17.4.2 Fuel
- 4.17.4.3 Other applications
- 4.17.1 KEY TARIFF RATES
5 GREEN METHANOL MARKET, BY FEEDSTOCK
- 5.1 INTRODUCTION
- 5.2 BIOMASS
- 5.2.1 RENEWABLE NATURE AND EMISSION-REDUCING POTENTIAL - KEY DRIVERS
- 5.2.2 FORESTRY AND AGRICULTURAL WASTE
- 5.2.3 BIOGAS FROM LANDFILLS
- 5.2.4 SEWAGE
- 5.2.5 MUNICIPAL SOLID WASTE
- 5.2.6 BLACK LIQUOR FROM PAPER & PULP INDUSTRY
- 5.3 GREEN HYDROGEN
- 5.3.1 GOVERNMENT INCENTIVES FOR RENEWABLE ENERGY TO DRIVE MARKET
- 5.4 CARBON CAPTURE & STORAGE
- 5.4.1 INCREASING NEED FOR CARBON REDUCTION AND CLEANER ENERGY SOLUTIONS TO BOOST MARKET
6 GREEN METHANOL MARKET, BY DERIVATIVE
- 6.1 INTRODUCTION
- 6.2 FORMALDEHYDE
- 6.2.1 GROWING DEMAND FROM CONSTRUCTION INDUSTRY
- 6.3 GASOLINE
- 6.3.1 INCREASING USE IN TRANSPORTATION SECTOR
- 6.4 GREEN METHANOL-TO-OLEFINS/GREEN METHANOL-T0-PROPYLENE
- 6.4.1 HIGH DEMAND FOR PLASTICS IN END-USE INDUSTRIES
- 6.5 METHYL TERT-BUTYL ETHER
- 6.5.1 HIGH DEMAND FROM CHINA FOR USE ACROSS INDUSTRIES
- 6.6 ACETIC ACID
- 6.6.1 IMPORTANT RAW MATERIAL FOR DOWNSTREAM CHEMICALS
- 6.7 DIMETHYL ETHER
- 6.7.1 GROWING DEMAND FOR HEATING AND COOKING PURPOSES
- 6.8 METHYL METHACRYLATE
- 6.8.1 HIGH CONSUMPTION IN ELECTRONICS INDUSTRY
- 6.9 BIODIESEL
- 6.9.1 DRIVEN BY COMPETITIVE PRICING AND ENVIRONMENTAL REGULATIONS
- 6.10 OTHERS
7 GREEN METHANOL MARKET, BY APPLICATION
- 7.1 INTRODUCTION
- 7.2 CHEMICAL FEEDSTOCK
- 7.2.1 SUSTAINABLE MANUFACTURING PRACTICES TO DRIVE MARKET
- 7.3 FUEL
- 7.3.1 INCREASING APPLICATION IN MARITIME TRANSPORT PROPELS MARKET
- 7.4 OTHERS
- 7.4.1 VERSATILITY IN POWER GENERATION AND ENERGY STORAGE ACCELERATES ADOPTION
8 GREEN METHANOL MARKET, BY REGION
- 8.1 INTRODUCTION
- 8.2 NORTH AMERICA
- 8.2.1 US
- 8.2.1.1 Increasing focus on sustainability and technological advancements to surge market growth
- 8.2.2 CANADA
- 8.2.2.1 Stringent environmental regulations and government support to boost production
- 8.2.3 MEXICO
- 8.2.3.1 Abundant renewable resources and strategic geographic location to boost market
- 8.2.1 US
- 8.3 ASIA PACIFIC
- 8.3.1 INDIA
- 8.3.1.1 Market growth driven by government initiatives and technological advancements
- 8.3.2 CHINA
- 8.3.2.1 Substantial renewable energy resources and commitment to reducing carbon emissions to boost market
- 8.3.3 JAPAN
- 8.3.3.1 Government policies and initiatives to boost market
- 8.3.4 SOUTH KOREA
- 8.3.4.1 Industrial development and government initiatives to boost market
- 8.3.5 REST OF ASIA PACIFIC
- 8.3.1 INDIA
- 8.4 EUROPE
- 8.4.1 GERMANY
- 8.4.1.1 Propelled by growing demand from the automotive industry
- 8.4.2 NETHERLANDS
- 8.4.2.1 Market driven by advanced infrastructure, strategic location, and strong commitment to renewable energy
- 8.4.3 SWEDEN
- 8.4.3.1 Strategic partnerships and increasing demand from eco-conscious industries fuel market growth
- 8.4.4 REST OF EUROPE
- 8.4.1 GERMANY
- 8.5 MIDDLE EAST & AFRICA
- 8.5.1 GCC COUNTRIES
- 8.5.1.1 Saudi Arabia
- 8.5.1.1.1 Ambitious sustainability and economic diversification plan to grow the market
- 8.5.1.2 UAE
- 8.5.1.2.1 Government initiatives to increase green methanol production to fuel market
- 8.5.1.3 Rest of GCC Countries
- 8.5.1.1 Saudi Arabia
- 8.5.2 REST OF MIDDLE EAST & AFRICA
- 8.5.1 GCC COUNTRIES
- 8.6 SOUTH AMERICA
- 8.6.1 BRAZIL
- 8.6.1.1 Strong emphasis on renewable energy and sustainable practices to propel market
- 8.6.2 ARGENTINA
- 8.6.2.1 Strong government support and increasing international interest - key market drivers
- 8.6.3 REST OF SOUTH AMERICA
- 8.6.1 BRAZIL
9 COMPETITIVE LANDSCAPE
- 9.1 INTRODUCTION
- 9.2 KEY PLAYER STRATEGIES/RIGHT TO WIN
- 9.3 REVENUE ANALYSIS
- 9.4 MARKET SHARE AND RANKING ANALYSIS
- 9.4.1 RANKING ANALYSIS OF KEY PLAYERS
- 9.4.2 MARKET SHARE ANALYSIS OF KEY PLAYERS
- 9.4.2.1 Methanex Corporation (Canada)
- 9.4.2.2 Carbon Recycling International (Iceland)
- 9.4.2.3 Proman (Switzerland)
- 9.4.2.4 Sodra (Sweden)
- 9.4.2.5 Enerkem (Canada)
- 9.5 BRAND/PRODUCT COMPARISON
- 9.5.1 GREEN METHANOL BY ENERKEM
- 9.5.2 GREEN METHANOL BY CARBON RECYCLING INTERNATIONAL
- 9.5.3 GREEN METHANOL BY METHANEX CORPORATION
- 9.5.4 GREEN METHANOL BY PROMAN
- 9.5.5 GREEN METHANOL BY SODRA
- 9.6 COMPANY EVALUATION MATRIX: KEY PLAYERS, 2025
- 9.6.1 STARS
- 9.6.2 EMERGING LEADERS
- 9.6.3 PERVASIVE PLAYERS
- 9.6.4 PARTICIPANTS
- 9.6.5 COMPANY FOOTPRINT: KEY PLAYERS, 2025
- 9.6.5.1 Company footprint
- 9.6.5.2 Region footprint
- 9.6.5.3 Derivative footprint
- 9.6.5.4 Application footprint
- 9.6.5.5 Feedstock footprint
- 9.7 COMPANY EVALUATION MATRIX: STARTUPS/SMES, 2025
- 9.7.1 PROGRESSIVE COMPANIES
- 9.7.2 RESPONSIVE COMPANIES
- 9.7.3 DYNAMIC COMPANIES
- 9.7.4 STARTING BLOCKS
- 9.7.5 COMPETITIVE BENCHMARKING: STARTUPS/SMES, 2025
- 9.7.5.1 Detailed list of key startups/SMEs
- 9.7.5.2 Competitive benchmarking of key startups/SMEs
- 9.8 COMPANY VALUATION AND FINANCIAL METRICS
- 9.9 COMPETITIVE SCENARIO
- 9.9.1 DEALS
10 COMPANY PROFILES
- 10.1 KEY PLAYERS
- 10.1.1 PETROLIAM NASIONAL BERHAD (PETRONAS)
- 10.1.1.1 Business overview
- 10.1.1.2 Products/Solutions/Services offered
- 10.1.1.3 Recent developments
- 10.1.1.3.1 Deals
- 10.1.1.4 MnM view
- 10.1.1.4.1 Key strengths
- 10.1.1.4.2 Strategic choices
- 10.1.1.4.3 Weaknesses/Competitive threats
- 10.1.2 CARBON RECYCLING INTERNATIONAL
- 10.1.2.1 Business overview
- 10.1.2.2 Products/Solutions/Services offered
- 10.1.2.3 Recent developments
- 10.1.2.3.1 Deals
- 10.1.2.4 MnM view
- 10.1.2.4.1 Key strengths
- 10.1.2.4.2 Strategic choices
- 10.1.2.4.3 Weaknesses/Competitive threats
- 10.1.3 SUNGAS RENEWABLES
- 10.1.3.1 Business overview
- 10.1.3.2 Products/Solutions/Services offered
- 10.1.3.3 Recent developments
- 10.1.3.3.1 Deals
- 10.1.3.3.2 Expansions
- 10.1.3.4 MnM view
- 10.1.3.4.1 Key strengths
- 10.1.3.4.2 Strategic choices
- 10.1.3.4.3 Weaknesses/Competitive threats
- 10.1.4 ABEL ENERGY PTY LTD.
- 10.1.4.1 Business overview
- 10.1.4.2 Products/Solutions/Services offered
- 10.1.4.3 Recent developments
- 10.1.4.3.1 Deals
- 10.1.4.4 MnM view
- 10.1.4.4.1 Key strengths
- 10.1.4.4.2 Strategic choices
- 10.1.4.4.3 Weaknesses/Competitive threats
- 10.1.5 METHANEX CORPORATION
- 10.1.5.1 Business overview
- 10.1.5.2 Products/Solutions/Services offered
- 10.1.5.3 Recent developments
- 10.1.5.3.1 Deals
- 10.1.5.4 MnM view
- 10.1.5.4.1 Key strengths
- 10.1.5.4.2 Strategic choices
- 10.1.5.4.3 Weaknesses/Competitive threats
- 10.1.6 MITSUBISHI GAS CHEMICAL COMPANY, INC.
- 10.1.6.1 Business overview
- 10.1.6.2 Products/Solutions/Services offered
- 10.1.6.3 Recent developments
- 10.1.6.3.1 Deals
- 10.1.6.4 MnM view
- 10.1.6.4.1 Key strengths
- 10.1.6.4.2 Strategic choices
- 10.1.6.4.3 Weaknesses/Competitive threats
- 10.1.7 ENERKEM
- 10.1.7.1 Business overview
- 10.1.7.2 Products/Solutions/Services offered
- 10.1.7.3 Recent developments
- 10.1.7.3.1 Deals
- 10.1.7.4 MnM view
- 10.1.7.4.1 Key strengths
- 10.1.7.4.2 Strategic choices
- 10.1.7.4.3 Weaknesses/Competitive threats
- 10.1.8 ALBERTA PACIFIC FOREST INDUSTRIES INC.
- 10.1.8.1 Business overview
- 10.1.8.2 Products/Solutions/Services offered
- 10.1.8.3 Recent developments
- 10.1.9 ENVISION ENERGY
- 10.1.9.1 Business overview
- 10.1.9.2 Products/Solutions/Services offered
- 10.1.9.3 Recent developments
- 10.1.9.3.1 Deals
- 10.1.10 SODRA
- 10.1.10.1 Business overview
- 10.1.10.2 Products/Solutions/Services offered
- 10.1.10.3 Recent developments
- 10.1.10.3.1 Deals
- 10.1.11 PROMAN
- 10.1.11.1 Business overview
- 10.1.11.2 Products/Solutions/Services offered
- 10.1.11.3 Recent developments
- 10.1.11.3.1 Deals
- 10.1.1 PETROLIAM NASIONAL BERHAD (PETRONAS)
- 10.2 OTHER PLAYERS
- 10.2.1 AVAADA
- 10.2.2 C1 GREEN CHEMICALS AG
- 10.2.3 VARMSLAND METHANOL
- 10.2.4 IBERDROLA, S.A.
- 10.2.5 LOWLANDS METHANOL B.V.
- 10.2.6 RENEWABLE HYDROGEN CANADA CORPORATION
- 10.2.7 EUROPEAN ENERGY A/S
11 RESEARCH METHODOLOGY
- 11.1 RESEARCH DATA
- 11.1.1 SECONDARY DATA
- 11.1.1.1 Key data from secondary sources
- 11.1.2 PRIMARY DATA
- 11.1.2.1 Key data from primary sources
- 11.1.2.2 Breakdown of primaries
- 11.1.1 SECONDARY DATA
- 11.2 MATRIX CONSIDERED FOR DEMAND-SIDE ANALYSIS
- 11.3 MARKET SIZE ESTIMATION
- 11.3.1 BOTTOM-UP APPROACH
- 11.3.2 TOP-DOWN APPROACH
- 11.3.2.1 Calculations for supply-side analysis
- 11.4 GROWTH RATE ASSUMPTIONS/GROWTH FORECAST
- 11.5 DATA TRIANGULATION
- 11.6 IMPACT OF RECESSION
- 11.7 RESEARCH ASSUMPTIONS
- 11.8 RESEARCH LIMITATIONS
- 11.9 RISK ANALYSIS
12 APPENDIX
- 12.1 DISCUSSION GUIDE
- 12.2 KNOWLEDGESTORE: MARKETSANDMARKETS' SUBSCRIPTION PORTAL
- 12.3 CUSTOMIZATION OPTIONS
- 12.4 RELATED REPORTS
- 12.5 AUTHOR DETAILS
List of Tables
- TABLE 1 GREEN METHANOL MARKET: INCLUSIONS AND EXCLUSIONS
- TABLE 2 GREEN METHANOL MARKET: PORTER'S FIVE FORCES ANALYSIS
- TABLE 3 REAL GDP GROWTH (ANNUAL PERCENTAGE CHANGE), BY COUNTRY, 2022-2025 (%)
- TABLE 4 UNEMPLOYMENT RATE, BY COUNTRY, 2022-2025 (%)
- TABLE 5 INFLATION RATE, AVERAGE CONSUMER PRICES, BY COUNTRY, 2022-2025 (%)
- TABLE 6 FOREIGN DIRECT INVESTMENT, BY REGION, 2022-2024 (USD BILLION)
- TABLE 7 INDICATIVE PRICING ANALYSIS OF GREEN METHANOL OFFERED BY KEY PLAYERS, 2021-2023 (USD/TON)
- TABLE 8 INDICATIVE PRICING ANALYSIS OF GREEN METHANOL, BY FEEDSTOCK TYPE, 2024 (USD/TON)
- TABLE 9 AVERAGE SELLING PRICE TREND OF GREEN METHANOL, BY REGION, 2022-2025 (USD/TON)
- TABLE 10 GREEN METHANOL MARKET: ROLE IN ECOSYSTEM
- TABLE 11 NORTH AMERICA: REGULATORY BODIES, GOVERNMENT AGENCIES, AND OTHER ORGANIZATIONS
- TABLE 12 EUROPE: REGULATORY BODIES, GOVERNMENT AGENCIES, AND OTHER ORGANIZATIONS
- TABLE 13 ASIA PACIFIC: REGULATORY BODIES, GOVERNMENT AGENCIES, AND OTHER ORGANIZATIONS
- TABLE 14 GREEN METHANOL MARKET: LIST OF KEY CONFERENCES AND EVENTS, 2026-2027
- TABLE 15 IMPORT DATA FOR METHANOL, BY COUNTRY, 2022-2025 (USD THOUSAND)
- TABLE 16 EXPORT DATA FOR METHANOL, BY COUNTRY, 2022-2025 (USD THOUSAND)
- TABLE 17 INFLUENCE OF STAKEHOLDERS ON BUYING PROCESS FOR TOP THREE APPLICATIONS (%)
- TABLE 18 KEY BUYING CRITERIA FOR TOP THREE APPLICATIONS
- TABLE 19 GREEN METHANOL MARKET: MAJOR PATENTS
- TABLE 20 US-ADJUSTED RECIPROCAL TARIFF RATES
- TABLE 21 GREEN METHANOL MARKET, BY FEEDSTOCK, 2021-2025 (KILOTON)
- TABLE 22 GREEN METHANOL MARKET, BY FEEDSTOCK, 2026-2031 (KILOTON)
- TABLE 23 BIOMASS: GREEN METHANOL MARKET, BY REGION, 2021-2025 (KILOTON)
- TABLE 24 BIOMASS: GREEN METHANOL MARKET, BY REGION, 2026-2031 (KILOTON)
- TABLE 25 GREEN HYDROGEN: GREEN METHANOL MARKET, BY REGION, 2021-2025 (KILOTON)
- TABLE 26 GREEN HYDROGEN: GREEN METHANOL MARKET, BY REGION, 2026-2031 (KILOTON)
- TABLE 27 CARBON CAPTURE & STORAGE: GREEN METHANOL MARKET, BY REGION, 2021-2025 (KILOTON)
- TABLE 28 CARBON CAPTURE & STORAGE: GREEN METHANOL MARKET, BY REGION, 2026-2031 (KILOTON)
- TABLE 29 GREEN METHANOL MARKET, BY APPLICATION, 2021-2025 (USD MILLION)
- TABLE 30 GREEN METHANOL MARKET, BY APPLICATION, 2026-2031 (USD MILLION)
- TABLE 31 GREEN METHANOL MARKET, BY APPLICATION, 2021-2025 (KILOTON)
- TABLE 32 GREEN METHANOL MARKET, BY APPLICATION, 2026-2031 (KILOTON)
- TABLE 33 CHEMICAL FEEDSTOCK: GREEN METHANOL MARKET, BY REGION, 2021-2025 (USD MILLION)
- TABLE 34 CHEMICAL FEEDSTOCK: GREEN METHANOL MARKET, BY REGION, 2026-2031 (USD MILLION)
- TABLE 35 CHEMICAL FEEDSTOCK: GREEN METHANOL MARKET, BY REGION, 2021-2025 (KILOTON)
- TABLE 36 CHEMICAL FEEDSTOCK: GREEN METHANOL MARKET, BY REGION, 2026-2031 (KILOTON)
- TABLE 37 FUEL: GREEN METHANOL MARKET, BY COUNTRY, 2021-2025 (USD MILLION)
- TABLE 38 FUEL: GREEN METHANOL MARKET, BY REGION, 2026-2031 (USD MILLION)
- TABLE 39 FUEL: GREEN METHANOL MARKET, BY REGION, 2021-2025 (KILOTON)
- TABLE 40 FUEL: GREEN METHANOL MARKET, BY REGION, 2026-2031 (KILOTON)
- TABLE 41 OTHERS: GREEN METHANOL MARKET, BY COUNTRY, 2021-2025 (USD MILLION)
- TABLE 42 OTHERS: GREEN METHANOL MARKET, BY REGION, 2026-2031 (USD MILLION)
- TABLE 43 OTHERS: GREEN METHANOL MARKET, BY REGION, 2021-2025 (KILOTON)
- TABLE 44 OTHERS: GREEN METHANOL MARKET, BY REGION, 2026-2031 (KILOTON)
- TABLE 45 GREEN METHANOL MARKET, BY REGION, 2021-2025 (USD MILLION)
- TABLE 46 GREEN METHANOL MARKET, BY REGION, 2026-2031 (USD MILLION)
- TABLE 47 GREEN METHANOL MARKET, BY REGION, 2021-2025 (KILOTON)
- TABLE 48 GREEN METHANOL MARKET, BY REGION, 2026-2031 (KILOTON)
- TABLE 49 NORTH AMERICA: GREEN METHANOL MARKET, BY COUNTRY, 2021-2025 (USD MILLION)
- TABLE 50 NORTH AMERICA: GREEN METHANOL MARKET, BY COUNTRY, 2026-2031 (USD MILLION)
- TABLE 51 NORTH AMERICA: GREEN METHANOL MARKET, BY COUNTRY, 2021-2025 (KILOTON)
- TABLE 52 NORTH AMERICA: GREEN METHANOL MARKET, BY COUNTRY, 2026-2031 (KILOTON)
- TABLE 53 NORTH AMERICA: GREEN METHANOL MARKET, BY FEEDSTOCK, 2021-2025 (KILOTON)
- TABLE 54 NORTH AMERICA: GREEN METHANOL MARKET, BY FEEDSTOCK, 2026-2031 (KILOTON)
- TABLE 55 NORTH AMERICA: GREEN METHANOL MARKET, BY APPLICATION, 2021-2025 (USD MILLION)
- TABLE 56 NORTH AMERICA: GREEN METHANOL MARKET, BY APPLICATION, 2026-2031 (USD MILLION)
- TABLE 57 NORTH AMERICA: GREEN METHANOL MARKET, BY APPLICATION, 2021-2025 (KILOTON)
- TABLE 58 NORTH AMERICA: GREEN METHANOL MARKET, BY APPLICATION, 2026-2031 (KILOTON)
- TABLE 59 US: GREEN METHANOL MARKET, BY APPLICATION, 2021-2025 (USD MILLION)
- TABLE 60 US: GREEN METHANOL MARKET, BY APPLICATION, 2026-2031 (USD MILLION)
- TABLE 61 US: GREEN METHANOL MARKET, BY APPLICATION, 2021-2025 (KILOTON)
- TABLE 62 US: GREEN METHANOL MARKET, BY APPLICATION, 2026-2031 (KILOTON)
- TABLE 63 CANADA: GREEN METHANOL MARKET, BY APPLICATION, 2021-2025 (USD MILLION)
- TABLE 64 CANADA: GREEN METHANOL MARKET, BY APPLICATION, 2026-2031 (USD MILLION)
- TABLE 65 CANADA: GREEN METHANOL MARKET, BY APPLICATION, 2021-2025 (KILOTON)
- TABLE 66 CANADA: GREEN METHANOL MARKET, BY APPLICATION, 2026-2031 (KILOTON)
- TABLE 67 MEXICO: GREEN METHANOL MARKET, BY APPLICATION, 2021-2025 (USD MILLION)
- TABLE 68 MEXICO: GREEN METHANOL MARKET, BY APPLICATION, 2026-2031 (USD MILLION)
- TABLE 69 MEXICO: GREEN METHANOL MARKET, BY APPLICATION, 2021-2025 (KILOTON)
- TABLE 70 MEXICO: GREEN METHANOL MARKET, BY APPLICATION, 2026-2031 (KILOTON)
- TABLE 71 ASIA PACIFIC: GREEN METHANOL MARKET, BY COUNTRY, 2021-2025 (USD MILLION)
- TABLE 72 ASIA PACIFIC: GREEN METHANOL MARKET, BY COUNTRY, 2026-2031 (USD MILLION)
- TABLE 73 ASIA PACIFIC: GREEN METHANOL MARKET, BY COUNTRY, 2021-2025 (KILOTON)
- TABLE 74 ASIA PACIFIC: GREEN METHANOL MARKET, BY COUNTRY, 2026-2031 (KILOTON)
- TABLE 75 ASIA PACIFIC: GREEN METHANOL MARKET, BY FEEDSTOCK, 2021-2025 (KILOTON)
- TABLE 76 ASIA PACIFIC: GREEN METHANOL MARKET, BY FEEDSTOCK, 2026-2031 (KILOTON)
- TABLE 77 ASIA PACIFIC: GREEN METHANOL MARKET, BY APPLICATION, 2021-2025 (USD MILLION)
- TABLE 78 ASIA PACIFIC: GREEN METHANOL MARKET, BY APPLICATION, 2026-2031 (USD MILLION)
- TABLE 79 ASIA PACIFIC: GREEN METHANOL MARKET, BY APPLICATION, 2021-2025 (KILOTON)
- TABLE 80 ASIA PACIFIC: GREEN METHANOL MARKET, BY APPLICATION, 2026-2031 (KILOTON)
- TABLE 81 INDIA: GREEN METHANOL MARKET, BY APPLICATION, 2021-2025 (USD MILLION)
- TABLE 82 INDIA: GREEN METHANOL MARKET, BY APPLICATION, 2026-2031 (USD MILLION)
- TABLE 83 INDIA: GREEN METHANOL MARKET, BY APPLICATION, 2021-2025 (KILOTON)
- TABLE 84 INDIA: GREEN METHANOL MARKET, BY APPLICATION, 2026-2031 (KILOTON)
- TABLE 85 CHINA: GREEN METHANOL MARKET, BY APPLICATION, 2021-2025 (USD MILLION)
- TABLE 86 CHINA: GREEN METHANOL MARKET, BY APPLICATION, 2026-2031 (USD MILLION)
- TABLE 87 CHINA: GREEN METHANOL MARKET, BY APPLICATION, 2021-2025 (KILOTON)
- TABLE 88 CHINA: GREEN METHANOL MARKET, BY APPLICATION, 2026-2031 (KILOTON)
- TABLE 89 JAPAN: GREEN METHANOL MARKET, BY APPLICATION, 2021-2025 (USD MILLION)
- TABLE 90 JAPAN: GREEN METHANOL MARKET, BY APPLICATION, 2026-2031 (USD MILLION)
- TABLE 91 JAPAN: GREEN METHANOL MARKET, BY APPLICATION, 2021-2025 (KILOTON)
- TABLE 92 JAPAN: GREEN METHANOL MARKET, BY APPLICATION, 2026-2031 (KILOTON)
- TABLE 93 SOUTH KOREA: GREEN METHANOL MARKET, BY APPLICATION, 2021-2025 (USD MILLION)
- TABLE 94 SOUTH KOREA: GREEN METHANOL MARKET, BY APPLICATION, 2026-2031 (USD MILLION)
- TABLE 95 SOUTH KOREA: GREEN METHANOL MARKET, BY APPLICATION, 2021-2025 (KILOTON)
- TABLE 96 SOUTH KOREA: GREEN METHANOL MARKET, BY APPLICATION, 2026-2031 (KILOTON)
- TABLE 97 REST OF ASIA PACIFIC: GREEN METHANOL MARKET, BY APPLICATION, 2021-2025 (USD MILLION)
- TABLE 98 REST OF ASIA PACIFIC: GREEN METHANOL MARKET, BY APPLICATION, 2026-2031 (USD MILLION)
- TABLE 99 REST OF ASIA PACIFIC: GREEN METHANOL MARKET, BY APPLICATION, 2021-2025 (KILOTON)
- TABLE 100 REST OF ASIA PACIFIC: GREEN METHANOL MARKET, BY APPLICATION, 2026-2031 (KILOTON)
- TABLE 101 EUROPE: GREEN METHANOL MARKET, BY COUNTRY, 2021-2025 (USD MILLION)
- TABLE 102 EUROPE: GREEN METHANOL MARKET, BY COUNTRY, 2026-2031 (USD MILLION)
- TABLE 103 EUROPE: GREEN METHANOL MARKET, BY COUNTRY, 2021-2025 (KILOTON)
- TABLE 104 EUROPE: GREEN METHANOL MARKET, BY COUNTRY, 2026-2031 (KILOTON)
- TABLE 105 EUROPE: GREEN METHANOL MARKET, BY FEEDSTOCK, 2021-2025 (KILOTON)
- TABLE 106 EUROPE: GREEN METHANOL MARKET, BY FEEDSTOCK, 2026-2031 (KILOTON)
- TABLE 107 EUROPE: GREEN METHANOL MARKET, BY APPLICATION, 2021-2025 (USD MILLION)
- TABLE 108 EUROPE: GREEN METHANOL MARKET, BY APPLICATION, 2026-2031 (USD MILLION)
- TABLE 109 EUROPE: GREEN METHANOL MARKET, BY APPLICATION, 2021-2025 (KILOTON)
- TABLE 110 EUROPE: GREEN METHANOL MARKET, BY APPLICATION, 2026-2031 (KILOTON)
- TABLE 111 GERMANY: GREEN METHANOL MARKET, BY APPLICATION, 2021-2025 (USD MILLION)
- TABLE 112 GERMANY: GREEN METHANOL MARKET, BY APPLICATION, 2026-2031 (USD MILLION)
- TABLE 113 GERMANY: GREEN METHANOL MARKET, BY APPLICATION, 2021-2025 (KILOTON)
- TABLE 114 GERMANY: GREEN METHANOL MARKET, BY APPLICATION, 2026-2031 (KILOTON)
- TABLE 115 NETHERLANDS: GREEN METHANOL MARKET, BY APPLICATION, 2021-2025 (USD MILLION)
- TABLE 116 NETHERLANDS: GREEN METHANOL MARKET, BY APPLICATION, 2026-2031 (USD MILLION)
- TABLE 117 NETHERLANDS: GREEN METHANOL MARKET, BY APPLICATION, 2021-2025 (KILOTON)
- TABLE 118 NETHERLANDS: GREEN METHANOL MARKET, BY APPLICATION, 2026-2031 (KILOTON)
- TABLE 119 SWEDEN: GREEN METHANOL MARKET, BY APPLICATION, 2021-2025 (USD MILLION)
- TABLE 120 SWEDEN: GREEN METHANOL MARKET, BY APPLICATION, 2026-2031 (USD MILLION)
- TABLE 121 SWEDEN: GREEN METHANOL MARKET, BY APPLICATION, 2021-2025 (KILOTON)
- TABLE 122 SWEDEN: GREEN METHANOL MARKET, BY APPLICATION, 2026-2031 (KILOTON)
- TABLE 123 REST OF EUROPE: GREEN METHANOL MARKET, BY APPLICATION, 2021-2025 (USD MILLION)
- TABLE 124 REST OF EUROPE: GREEN METHANOL MARKET, BY APPLICATION, 2026-2031 (USD MILLION)
- TABLE 125 REST OF EUROPE: GREEN METHANOL MARKET, BY APPLICATION, 2021-2025 (KILOTON)
- TABLE 126 REST OF EUROPE: GREEN METHANOL MARKET, BY APPLICATION, 2026-2031 (KILOTON)
- TABLE 127 MIDDLE EAST & AFRICA: GREEN METHANOL MARKET, BY COUNTRY, 2021-2025 (USD MILLION)
- TABLE 128 MIDDLE EAST & AFRICA: GREEN METHANOL MARKET, BY COUNTRY, 2026-2031 (USD MILLION)
- TABLE 129 MIDDLE EAST & AFRICA: GREEN METHANOL MARKET, BY COUNTRY, 2021-2025 (KILOTON)
- TABLE 130 MIDDLE EAST & AFRICA: GREEN METHANOL MARKET, BY COUNTRY, 2026-2031 (KILOTON)
- TABLE 131 MIDDLE EAST & AFRICA: GREEN METHANOL MARKET, BY FEEDSTOCK, 2021-2025 (KILOTON)
- TABLE 132 MIDDLE EAST & AFRICA: GREEN METHANOL MARKET, BY FEEDSTOCK, 2026-2031 (KILOTON)
- TABLE 133 MIDDLE EAST & AFRICA: GREEN METHANOL MARKET, BY APPLICATION, 2021-2025 (USD MILLION)
- TABLE 134 MIDDLE EAST & AFRICA: GREEN METHANOL MARKET, BY APPLICATION, 2026-2031 (USD MILLION)
- TABLE 135 MIDDLE EAST & AFRICA: GREEN METHANOL MARKET, BY APPLICATION, 2021-2025 (KILOTON)
- TABLE 136 MIDDLE EAST & AFRICA: GREEN METHANOL MARKET, BY APPLICATION, 2026-2031 (KILOTON)
- TABLE 137 SAUDI ARABIA: GREEN METHANOL MARKET, BY APPLICATION, 2021-2025 (USD MILLION)
- TABLE 138 SAUDI ARABIA: GREEN METHANOL MARKET, BY APPLICATION, 2026-2031 (USD MILLION)
- TABLE 139 SAUDI ARABIA: GREEN METHANOL MARKET, BY APPLICATION, 2021-2025 (KILOTON)
- TABLE 140 SAUDI ARABIA: GREEN METHANOL MARKET, BY APPLICATION, 2026-2031 (KILOTON)
- TABLE 141 UAE: GREEN METHANOL MARKET, BY APPLICATION, 2021-2025 (USD MILLION)
- TABLE 142 UAE: GREEN METHANOL MARKET, BY APPLICATION, 2026-2031 (USD MILLION)
- TABLE 143 UAE: GREEN METHANOL MARKET, BY APPLICATION, 2021-2025 (KILOTON)
- TABLE 144 UAE: GREEN METHANOL MARKET, BY APPLICATION, 2026-2031 (KILOTON)
- TABLE 145 REST OF GCC COUNTRIES: GREEN METHANOL MARKET, BY APPLICATION, 2021-2025 (USD MILLION)
- TABLE 146 REST OF GCC COUNTRIES: GREEN METHANOL MARKET, BY APPLICATION, 2026-2031 (USD MILLION)
- TABLE 147 REST OF GCC COUNTRIES: GREEN METHANOL MARKET, BY APPLICATION, 2021-2025 (KILOTON)
- TABLE 148 REST OF GCC COUNTRIES: GREEN METHANOL MARKET, BY APPLICATION, 2026-2031 (KILOTON)
- TABLE 149 REST OF MIDDLE EAST & AFRICA: GREEN METHANOL MARKET, BY APPLICATION, 2021-2025 (USD MILLION)
- TABLE 150 REST OF MIDDLE EAST & AFRICA: GREEN METHANOL MARKET, BY APPLICATION, 2026-2031 (USD MILLION)
- TABLE 151 REST OF MIDDLE EAST & AFRICA: GREEN METHANOL MARKET, BY APPLICATION, 2021-2025 (KILOTON)
- TABLE 152 REST OF MIDDLE EAST & AFRICA: GREEN METHANOL MARKET, BY APPLICATION, 2026-2031 (KILOTON)
- TABLE 153 SOUTH AMERICA: GREEN METHANOL MARKET, BY COUNTRY, 2021-2025 (USD MILLION)
- TABLE 154 SOUTH AMERICA: GREEN METHANOL MARKET, BY COUNTRY, 2026-2031 (USD MILLION)
- TABLE 155 SOUTH AMERICA: GREEN METHANOL MARKET, BY COUNTRY, 2021-2025 (KILOTON)
- TABLE 156 SOUTH AMERICA: GREEN METHANOL MARKET, BY COUNTRY, 2026-2031 (KILOTON)
- TABLE 157 SOUTH AMERICA: GREEN METHANOL MARKET, BY FEEDSTOCK, 2021-2025 (KILOTON)
- TABLE 158 SOUTH AMERICA: GREEN METHANOL MARKET, BY FEEDSTOCK, 2026-2031 (KILOTON)
- TABLE 159 SOUTH AMERICA: GREEN METHANOL MARKET, BY APPLICATION, 2021-2025 (USD MILLION)
- TABLE 160 SOUTH AMERICA: GREEN METHANOL MARKET, BY APPLICATION, 2026-2031 (USD MILLION)
- TABLE 161 SOUTH AMERICA: GREEN METHANOL MARKET, BY APPLICATION, 2021-2025 (KILOTON)
- TABLE 162 SOUTH AMERICA: GREEN METHANOL MARKET, BY APPLICATION, 2026-2031 (KILOTON)
- TABLE 163 BRAZIL: GREEN METHANOL MARKET, BY APPLICATION, 2021-2025 (USD MILLION)
- TABLE 164 BRAZIL: GREEN METHANOL MARKET, BY APPLICATION, 2026-2031 (USD MILLION)
- TABLE 165 BRAZIL: GREEN METHANOL MARKET, BY APPLICATION, 2021-2025 (KILOTON)
- TABLE 166 BRAZIL: GREEN METHANOL MARKET, BY APPLICATION, 2026-2031 (KILOTON)
- TABLE 167 ARGENTINA: GREEN METHANOL MARKET, BY APPLICATION, 2021-2025 (USD MILLION)
- TABLE 168 ARGENTINA: GREEN METHANOL MARKET, BY APPLICATION, 2026-2031 (USD MILLION)
- TABLE 169 ARGENTINA: GREEN METHANOL MARKET, BY APPLICATION, 2021-2025 (KILOTON)
- TABLE 170 ARGENTINA: GREEN METHANOL MARKET, BY APPLICATION, 2026-2031 (KILOTON)
- TABLE 171 REST OF SOUTH AMERICA: GREEN METHANOL MARKET, BY APPLICATION, 2021-2025 (USD MILLION)
- TABLE 172 REST OF SOUTH AMERICA: GREEN METHANOL MARKET, BY APPLICATION, 2026-2031 (USD MILLION)
- TABLE 173 REST OF SOUTH AMERICA: GREEN METHANOL MARKET, BY APPLICATION, 2021-2025 (KILOTON)
- TABLE 174 REST OF SOUTH AMERICA: GREEN METHANOL MARKET, BY APPLICATION, 2026-2031 (KILOTON)
- TABLE 175 GREEN METHANOL MARKET: OVERVIEW OF STRATEGIES ADOPTED BY KEY MANUFACTURERS
- TABLE 176 GREEN METHANOL MARKET: DEGREE OF COMPETITION
- TABLE 177 GREEN METHANOL MARKET: REGION FOOTPRINT
- TABLE 178 GREEN METHANOL MARKET: DERIVATIVE FOOTPRINT
- TABLE 179 GREEN METHANOL MARKET: APPLICATION FOOTPRINT
- TABLE 180 GREEN METHANOL MARKET: FEEDSTOCK FOOTPRINT
- TABLE 181 GREEN METHANOL MARKET: DETAILED LIST OF KEY STARTUPS/SMES
- TABLE 182 GREEN METHANOL MARKET: COMPETITIVE BENCHMARKING OF KEY STARTUPS/SMES
- TABLE 183 GREEN METHANOL MARKET: DEALS, JANUARY 2019-MAY 2024
- TABLE 184 PETROLIAM NASIONAL BERHAD (PETRONAS)
- TABLE 185 PETROLIAM NASIONAL BERHAD (PETRONAS): PRODUCTS/SOLUTIONS/ SERVICES OFFERED
- TABLE 186 PETROLIAM NASIONAL BERHAD (PETRONAS): DEALS
- TABLE 187 CARBON RECYCLING INTERNATIONAL: COMPANY OVERVIEW
- TABLE 188 CARBON RECYCLING INTERNATIONAL: PRODUCTS/SOLUTIONS/SERVICES OFFERED
- TABLE 189 CARBON RECYCLING INTERNATIONAL: DEALS
- TABLE 190 SUNGAS RENEWABLES: COMPANY OVERVIEW
- TABLE 191 SUNGAS RENEWABLES: PRODUCTS/SOLUTIONS/SERVICES OFFERED
- TABLE 192 SUNGAS RENEWABLES: DEALS
- TABLE 193 SUNGAS RENEWABLES: EXPANSIONS
- TABLE 194 ABEL ENERGY PTY LTD.: COMPANY OVERVIEW
- TABLE 195 ABEL ENERGY PTY LTD.: PRODUCTS/SOLUTIONS/SERVICES OFFERED
- TABLE 196 ABEL ENERGY PTY LTD.: DEALS
- TABLE 197 METHANEX CORPORATION: COMPANY OVERVIEW
- TABLE 198 METHANEX CORPORATION: PRODUCTS/SOLUTIONS/SERVICES OFFERED
- TABLE 199 METHANEX CORPORATION.: DEALS
- TABLE 200 MITSUBISHI GAS CHEMICAL COMPANY, INC.: COMPANY OVERVIEW
- TABLE 201 MITSUBISHI GAS CHEMICAL COMPANY, INC.: PRODUCTS/SOLUTIONS/ SERVICES OFFERED
- TABLE 202 MITSUBISHI GAS CHEMICAL COMPANY, INC.: DEALS
- TABLE 203 ENERKEM: COMPANY OVERVIEW
- TABLE 204 ENERKEM: PRODUCTS/SOLUTIONS/SERVICES OFFERED
- TABLE 205 ENERKEM: DEALS
- TABLE 206 ALBERTA-PACIFIC FOREST INDUSTRIES INC.: COMPANY OVERVIEW
- TABLE 207 ALBERTA-PACIFIC FOREST INDUSTRIES INC.: PRODUCTS/SOLUTIONS/ SERVICES OFFERED
- TABLE 208 ENVISION ENERGY: COMPANY OVERVIEW
- TABLE 209 ENVISION ENERGY: PRODUCTS/SOLUTIONS/SERVICES OFFERED
- TABLE 210 ENVISION ENERGY: DEALS
- TABLE 211 SODRA: COMPANY OVERVIEW
- TABLE 212 SODRA: PRODUCTS/SOLUTIONS/SERVICES OFFERED
- TABLE 213 SODRA: DEALS
- TABLE 214 PROMAN: COMPANY OVERVIEW
- TABLE 215 PROMAN: PRODUCTS/SOLUTIONS/SERVICES OFFERED
- TABLE 216 PROMAN: DEALS
- TABLE 217 AVAADA: COMPANY OVERVIEW
- TABLE 218 C1 GREEN CHEMICALS AG: COMPANY OVERVIEW
- TABLE 219 VARMSLAND METHANOL: COMPANY OVERVIEW
- TABLE 220 IBERDROLA, S.A.: COMPANY OVERVIEW
- TABLE 221 LOWLANDS METHANOL B.V.: COMPANY OVERVIEW
- TABLE 222 RENEWABLE HYDROGEN CANADA CORPORATION: COMPANY OVERVIEW
- TABLE 223 EUROPEAN ENERGY A/S: COMPANY OVERVIEW
List of Figures
- FIGURE 1 GREEN METHANOL MARKET SEGMENTATION
- FIGURE 2 KEY INSIGHTS AND MARKET HIGHLIGHTS
- FIGURE 3 GLOBAL GREEN METHANOL MARKET, 2021-2031
- FIGURE 4 MAJOR STRATEGIES ADOPTED BY KEY PLAYERS IN GREEN METHANOL MARKET (2021-2025)
- FIGURE 5 DISRUPTIVE TRENDS IMPACTING GROWTH OF GREEN METHANOL MARKET
- FIGURE 6 HIGH-GROWTH SEGMENTS AND EMERGING FRONTIERS IN GREEN METHANOL MARKET
- FIGURE 7 NORTH AMERICA TO REGISTER HIGHEST GROWTH DURING FORECAST PERIOD
- FIGURE 8 GROWING DEMAND FOR GREEN METHANOL TO DRIVE MARKET GROWTH DURING FORECAST PERIOD
- FIGURE 9 NORTH AMERICA TO ACCOUNT FOR LARGEST MARKET SHARE DURING FORECAST PERIOD
- FIGURE 10 BIOMASS TO ACCOUNT FOR LARGEST MARKET SHARE DURING FORECAST PERIOD
- FIGURE 11 FUEL TO REGISTER HIGHEST CAGR DURING FORECAST PERIOD
- FIGURE 12 INDIA TO REGISTER HIGHEST CAGR DURING FORECAST PERIOD
- FIGURE 13 GREEN METHANOL MARKET: DRIVERS, RESTRAINTS, OPPORTUNITIES, AND CHALLENGES
- FIGURE 14 PORTER'S FIVE FORCES ANALYSIS: GREEN METHANOL MARKET
- FIGURE 15 AVERAGE SELLING PRICE TREND OF GREEN METHANOL OFFERED BY KEY PLAYERS, 2021-2023 (USD/TON)
- FIGURE 16 AVERAGE SELLING PRICE TREND OF GREEN METHANOL, BY FEEDSTOCK, 2024 (USD/TON)
- FIGURE 17 AVERAGE SELLING PRICE TREND OF GREEN METHANOL, BY REGION, 2022-2025 (USD/TON)
- FIGURE 18 GREEN METHANOL MARKET: VALUE CHAIN ANALYSIS
- FIGURE 19 GREEN METHANOL MARKET: ECOSYSTEM MAP
- FIGURE 20 BIO-METHANOL AND E-METHANOL: PRODUCTION PROCESS
- FIGURE 21 GREY, BROWN, AND BLUE METHANOL: PRODUCTION PROCESS
- FIGURE 22 CARBON CAPTURE AND UTILIZATION: PRODUCTION PROCESS
- FIGURE 23 IMPORT SCENARIO FOR HS CODE 290511, BY KEY COUNTRIES, 2022-2025
- FIGURE 24 EXPORT SCENARIO FOR HS CODE 290511, BY KEY COUNTRIES, 2022-2025
- FIGURE 25 INFLUENCE OF STAKEHOLDERS ON BUYING PROCESS FOR TOP THREE APPLICATIONS
- FIGURE 26 KEY BUYING CRITERIA FOR TOP THREE APPLICATIONS
- FIGURE 27 LIST OF MAJOR PATENTS FOR GREEN METHANOL
- FIGURE 28 INVESTMENT & FUNDING OF STARTUPS/SMES FOR GREEN METHANOL
- FIGURE 29 TRENDS/DISRUPTIONS IMPACTING CUSTOMER BUSINESS
- FIGURE 30 CARBON CAPTURE & STORAGE TO BE FASTEST-GROWING SEGMENT DURING FORECAST PERIOD
- FIGURE 31 FUEL TO BE FASTEST-GROWING SEGMENT DURING FORECAST PERIOD
- FIGURE 32 NORTH AMERICA TO ACCOUNT FOR LARGEST MARKET SHARE IN 2031
- FIGURE 33 NORTH AMERICA: GREEN METHANOL MARKET SNAPSHOT
- FIGURE 34 ASIA PACIFIC: GREEN METHANOL MARKET SNAPSHOT
- FIGURE 35 EUROPE: GREEN METHANOL MARKET SNAPSHOT
- FIGURE 36 GREEN METHANOL MARKET: REVENUE ANALYSIS OF KEY COMPANIES, 2019-2025 (USD BILLION)
- FIGURE 37 GREEN METHANOL MARKET: RANKING OF TOP PLAYERS, 2025
- FIGURE 38 GREEN METHANOL MARKET SHARE ANALYSIS, 2025
- FIGURE 39 BRAND/PRODUCT COMPARISON
- FIGURE 40 GREEN METHANOL MARKET: COMPANY EVALUATION MATRIX (KEY PLAYERS), 2025
- FIGURE 41 GREEN METHANOL MARKET: COMPANY FOOTPRINT
- FIGURE 42 GREEN METHANOL MARKET: COMPANY EVALUATION MATRIX (STARTUPS/SMES), 2025
- FIGURE 43 GREEN METHANOL MARKET: COMPANY VALUATION, 2025 (USD BILLION)
- FIGURE 44 GREEN METHANOL MARKET: FINANCIAL MATRIX, 2025 (EV/EBITDA)
- FIGURE 45 GREEN METHANOL MARKET: YEAR-TO-DATE (YTD) PRICE TOTAL RETURN AND FIVE-YEAR STOCK BETA OF KEY MANUFACTURERS, 2025
- FIGURE 46 PETROLIAM NASIONAL BERHAD (PETRONAS): COMPANY SNAPSHOT
- FIGURE 47 METHANEX CORPORATION: COMPANY SNAPSHOT
- FIGURE 48 MITSUBISHI GAS CHEMICAL COMPANY, INC.: COMPANY SNAPSHOT
- FIGURE 49 SODRA: COMPANY SNAPSHOT
- FIGURE 50 GREEN METHANOL MARKET: RESEARCH DESIGN
- FIGURE 51 MAIN MATRIX CONSIDERED TO ASSESS DEMAND FOR GREEN METHANOL
- FIGURE 52 MARKET SIZE ESTIMATION METHODOLOGY: BOTTOM-UP APPROACH
- FIGURE 53 MARKET SIZE ESTIMATION METHODOLOGY: TOP-DOWN APPROACH
- FIGURE 54 METHODOLOGY FOR SUPPLY-SIDE SIZING OF GREEN METHANOL MARKET (1/2)
- FIGURE 55 METHODOLOGY FOR SUPPLY-SIDE SIZING OF GREEN METHANOL MARKET (2/2)
- FIGURE 56 GREEN METHANOL MARKET: DATA TRIANGULATION

