
PUBLISHER: Mordor Intelligence | PRODUCT CODE: 1910810

PUBLISHER: Mordor Intelligence | PRODUCT CODE: 1910810
Nitric Acid - Market Share Analysis, Industry Trends & Statistics, Growth Forecasts (2026 - 2031)
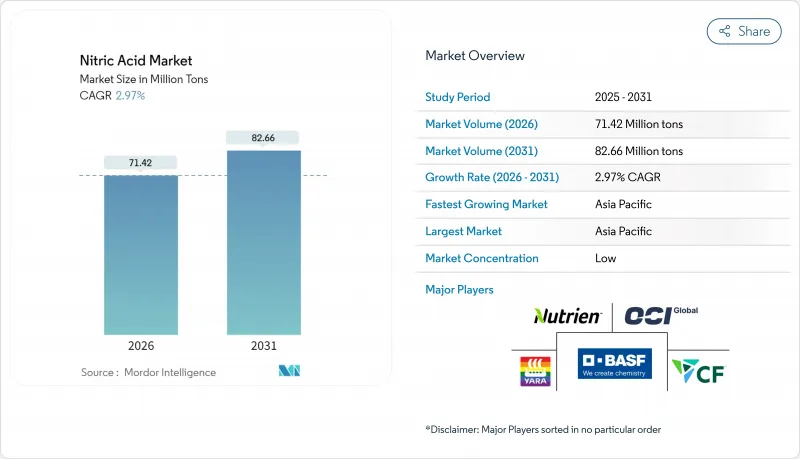
The Nitric Acid Market was valued at 69.36 Million tons in 2025 and estimated to grow from 71.42 Million tons in 2026 to reach 82.66 Million tons by 2031, at a CAGR of 2.97% during the forecast period (2026-2031).
Sustained investments in low-carbon ammonia, widening explosives demand, and strong fertilizer offtake continue to anchor the nitric acid market, yet rising environmental compliance costs and volatile gas prices are reshaping cost curves. Europe is moving quickly toward green production methods as BAT-AEL standards tighten, while North America leverages blue ammonia projects to improve energy security. Early movers integrating carbon capture, renewable hydrogen, and advanced catalysts are gaining margin resilience as commodity price swings intensify.
Global Nitric Acid Market Trends and Insights
Surging Demand for Low-Carbon Ammonium-Nitrate Fertilisers Across Europe
Europe's fertilizer producers are pivoting toward renewable hydrogen to satisfy the Renewable Energy Directive III requirement that 42% of hydrogen input be renewable by 2030. Early adopters with secured green feedstock face fewer supply shocks and can lock in offtake agreements with food-retail chains seeking lower scope-3 emissions. Leading producers have responded by advancing large-scale CCS projects, with Yara's 2026 Sluiskil CCS facility expected to materially lower Scope 1 emissions. The shift deepens the link between the nitric acid market and the European Union's climate targets, encouraging new joint ventures in green ammonia corridors.
Rising Adoption of Polyamide 6,6 for EU Automotive Lightweighting Targets
The EU passenger-car CO2 cap of 95 g/km is intensifying the substitution of metals with high-performance polymers. Polyamide 6,6 delivers up to 40% weight savings, improving EV range without compromising structural integrity. Because adipic acid, a nitric acid derivative, remains the main precursor, every incremental shift to polyamide 6,6 boosts regional nitric acid demand. Supply chains are refocusing on high-purity grades, prompting planned capacity additions by UBE Corporation for electronic-grade nitric acid to serve polymer producers. Automotive Tier-1 suppliers are aligning long-term resin offtake contracts with nitric acid producers to secure consistent quality and feedstock reliability ahead of stricter Euro 7 regulations.
EU BAT-AEL Tightening for N2O Emissions Raising Capex and Opex
The European Commission's ongoing revision of the LVIC BREF sets lower nitrous oxide benchmarks, compelling retrofits or new abatement installations across aging assets. Capital requirements for secondary-catalyst systems or tertiary destruction units can exceed USD 8 million per line, eroding margins on middle-aged plants. Operators with integrated CCS or advanced burners, such as BOC Limited's CO2 Recovery and Liquefaction plant, enjoy a cost advantage when bidding long-term supply contracts. The policy environment accelerates plant closures or asset swaps, consolidating the nitric acid market around top-tier producers with balance-sheet capacity for compliance investments.
Other drivers and restraints analyzed in the detailed report include:
- Government Incentives for On-Site Weak Nitric Acid Plants in Indian Pharma Clusters
- Increasing Demand from Explosives Manufacturing
- Volatile Natural Gas Prices Squeezing Ammonia-to-Nitric-Acid Margins
For complete list of drivers and restraints, kindly check the Table Of Contents.
Segment Analysis
Weak nitric acid commanded 57.45% of the market share in 2025, reflecting its versatility in fertilizer and intermediate applications. The segment benefits from lower corrosion management expenses, enabling producers to operate single mono-pressure loops with minimal upgrading. The nitric acid market size tied to weak grades is expected to advance steadily as Europe mandates controlled nitrate release fertilizers that rely on weak acid neutralization.
Concentrated nitric acid, accounting for the next-largest volume slice, is gaining momentum at a 3.48% CAGR on the back of rising explosives and electronics requirements. Capacity additions in high-purity lines, notably UBE's expansion in Yamaguchi Prefecture, aim to capture specialty segment premiums. Fuming nitric acid remains niche yet strategically significant for aerospace propulsion.
The Nitric Acid Market Segments the Industry by Concentration (Weak Nitric Acid (less Than or Equal To 68%), Concentrated Nitric Acid (68 To 98%), and Fuming/Red Fuming (more Than 98%)), End-User Industry (Fertilizers, Chemical Manufacturing, Explosives, Aerospace, Inks, Pigments, and Dyes, and Other End-User Industries), and Geography (Asia-Pacific, North America, Europe, South America, and Middle-East and Africa).
Geography Analysis
Asia-Pacific commands 57.60% of the nitric acid market in 2025 and is expanding at 3.62% CAGR as heavy industry, fertilizer usage, and electronics manufacturing grow in tandem. China continues to invest in nitric-based intermediates, though environmental inspections are pushing older units toward catalytic upgrades. India's Dahej project by Deepak Fertilisers adds 450 KTPA combined capacity, lifting the country's self-reliance ratio and reducing net imports.
Europe's share continues to shrink under high energy costs and stringent emission controls. The tightening BAT-AEL limits will push marginal producers either to retrofit or exit, consolidating output among integrated giants such as BASF and Yara. North America benefits from abundant shale gas and evolving blue ammonia ventures. OCI's Beaumont facility adds a low-carbon supply corridor that feeds Gulf Coast nitric and nitrate plants from 2025.
South America remains structurally short on nitrogen, with 95% of Brazil's needs met via imports. Green-fertilizer uptake is rising as soybean producers pursue premium export certifications. However, currency volatility and infrastructure bottlenecks restrict immediate capacity investments in nitric acid.
- Asahi Kasei Corporation
- BASF
- Borealis AG
- CF Industries Holdings, Inc.
- DFPCL
- ENAEX
- EuroChem Group
- Gujarat Narmada Valley Fertilizers & Chemicals Limited
- Hanwha Group
- TKG HUCHEMS
- INEOS
- Incitec Pivot Fertilisers Pty Ltd
- LSB Industries
- MAXAMCORP HOLDING, SL
- Mitsubishi Chemical Group Corporation
- Nutrien
- OCI Global
- Orica Limited
- Sasol
- China Petrochemical Corporation
- Sumitomo Chemical Co., Ltd.
- Yara
- UBE Corporation
Additional Benefits:
- The market estimate (ME) sheet in Excel format
- 3 months of analyst support
TABLE OF CONTENTS
1 Introduction
- 1.1 Study Assumptions and Market Definition
- 1.2 Scope of the Study
2 Research Methodology
3 Executive Summary
4 Market Landscape
- 4.1 Market Overview
- 4.2 Market Drivers
- 4.2.1 Surging Demand for Low-Carbon Ammonium-Nitrate Fertilisers Across Europe
- 4.2.2 Rising Adoption of Polyamide 6,6 (Adipic-Acid Derivative) for EU Automotive Lightweighting Targets
- 4.2.3 Government Incentives for On-Site Weak Nitric-Acid Plants in Indian Nitrate-Based Pharma Clusters
- 4.2.4 Increasing Demand from Explosives Manufacturing
- 4.3 Market Restraints
- 4.3.1 EU BAT-AEL Tightening for N?O Emissions Raising Capex and Opex
- 4.3.2 Volatile Natural-Gas Prices Squeezing Ammonia-to-Nitric-Acid Margins
- 4.3.3 Health Hazards Caused by Nitric Acid
- 4.4 Value Chain Analysis
- 4.5 Porter's Five Forces
- 4.5.1 Bargaining Power of Suppliers
- 4.5.2 Bargaining Power of Buyers
- 4.5.3 Threat of New Entrants
- 4.5.4 Threat of Substitutes
- 4.5.5 Intensity of Competitive Rivalry
- 4.6 Trade Flow Analysis
- 4.7 Cost Analysis
5 Market Size and Growth Forecasts (Value and Volume)
- 5.1 By Concentration
- 5.1.1 Weak Nitric Acid (less than or equal to 68%)
- 5.1.2 Concentrated Nitric Acid (68 to 98%)
- 5.1.3 Fuming/Red Fuming (more than 98%)
- 5.2 By End-user Industry
- 5.2.1 Fertilisers
- 5.2.2 Chemical Manufacturing
- 5.2.3 Explosives
- 5.2.4 Aerospace
- 5.2.5 Inks, Pigments and Dyes
- 5.2.6 Other End-user Industries (Pharmaceuticals and Food Processing)
- 5.3 By Geography
- 5.3.1 Asia-Pacific
- 5.3.1.1 China
- 5.3.1.2 India
- 5.3.1.3 Japan
- 5.3.1.4 South Korea
- 5.3.1.5 Indonesia
- 5.3.1.6 Malaysia
- 5.3.1.7 Vietnam
- 5.3.1.8 Thailand
- 5.3.1.9 Rest of Asia-Pacific
- 5.3.2 North America
- 5.3.2.1 United States
- 5.3.2.2 Canada
- 5.3.2.3 Mexico
- 5.3.3 Europe
- 5.3.3.1 Germany
- 5.3.3.2 United Kingdom
- 5.3.3.3 France
- 5.3.3.4 Italy
- 5.3.3.5 Spain
- 5.3.3.6 Russia
- 5.3.3.7 Turkey
- 5.3.3.8 Nordic
- 5.3.3.9 Rest of Europe
- 5.3.4 South America
- 5.3.4.1 Brazil
- 5.3.4.2 Argentina
- 5.3.4.3 Colombia
- 5.3.4.4 Rest of South America
- 5.3.5 Middle-East and Africa
- 5.3.5.1 Saudi Arabia
- 5.3.5.2 United Arab Emirates
- 5.3.5.3 Qatar
- 5.3.5.4 Nigeria
- 5.3.5.5 Egypt
- 5.3.5.6 South Africa
- 5.3.5.7 Rest of Middle-East and Africa
- 5.3.1 Asia-Pacific
6 Competitive Landscape
- 6.1 Market Concentration
- 6.2 Strategic Moves (Mergers and Acquisitions, JVs, Capacity Expansions, Tech Licensing)
- 6.3 Market Share Analysis
- 6.4 Company Profiles (includes Global level Overview, Market level overview, Core Segments, Financials as available, Strategic Information, Market Rank/Share, Products and Services, Recent Developments)
- 6.4.1 Asahi Kasei Corporation
- 6.4.2 BASF
- 6.4.3 Borealis AG
- 6.4.4 CF Industries Holdings, Inc.
- 6.4.5 DFPCL
- 6.4.6 ENAEX
- 6.4.7 EuroChem Group
- 6.4.8 Gujarat Narmada Valley Fertilizers & Chemicals Limited
- 6.4.9 Hanwha Group
- 6.4.10 TKG HUCHEMS
- 6.4.11 INEOS
- 6.4.12 Incitec Pivot Fertilisers Pty Ltd
- 6.4.13 LSB Industries
- 6.4.14 MAXAMCORP HOLDING, SL
- 6.4.15 Mitsubishi Chemical Group Corporation
- 6.4.16 Nutrien
- 6.4.17 OCI Global
- 6.4.18 Orica Limited
- 6.4.19 Sasol
- 6.4.20 China Petrochemical Corporation
- 6.4.21 Sumitomo Chemical Co., Ltd.
- 6.4.22 Yara
- 6.4.23 UBE Corporation
7 Market Opportunities and Future Outlook
- 7.1 White-space and Unmet-Need Assessment
- 7.2 Technological Developments in Nitric Acid Manufacturing and Recent Government Incentives

