
PUBLISHER: Mordor Intelligence | PRODUCT CODE: 1911712

PUBLISHER: Mordor Intelligence | PRODUCT CODE: 1911712
Foliar Fertilizer - Market Share Analysis, Industry Trends & Statistics, Growth Forecasts (2026 - 2031)
The foliar fertilizer market is expected to grow from USD 21.34 billion in 2025 to USD 22.63 billion in 2026 and is forecast to reach USD 30.32 billion by 2031 at 6.03% CAGR over 2026-2031.
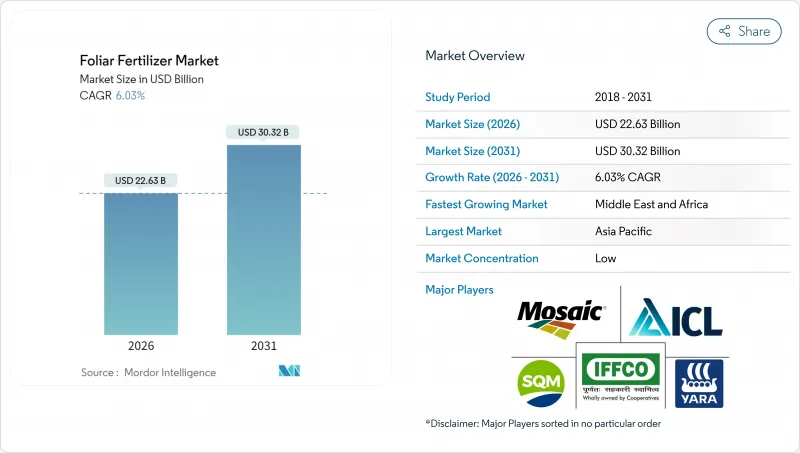
Rapid modernization of crop nutrition, integration of precision-ag platforms, and government incentives that reward balanced fertilization underpin this growth. Asia-Pacific dominates because subsidy programs in China and India accelerate adoption. At the same time, the Middle East and Africa are the fastest-growing regions as desert farming pivots toward water-efficient nutrient delivery. Complex, multi-nutrient blends gain traction as growers look for single-pass solutions, and carbon-credit schemes that reward foliar protocols create new income streams for early adopters. Competitive intensity remains moderate; the top five suppliers command only one-third of sales, so product innovation and regional partnerships remain pivotal.
Global Foliar Fertilizer Market Trends and Insights
Rising push toward balanced fertilization programs
Extension agencies endorse foliar feeding as a targeted method to correct micronutrient shortages without disturbing macronutrient regimes. Yield trials in corn and soybeans show 10-15% gains when foliar zinc and manganese supplement soil-applied nitrogen and phosphorus. Adherence to the 4R (Right Source, Right Rate, Right Time, Right Place) framework reduces leaching, supporting regulatory compliance. Public cost-share programs in the United States reimburse up to 30% of foliar application expenses, motivating faster technology turnover. Suppliers position educational services as part of the sales package, strengthening brand loyalty and raising repeat-purchase rates.
Rapid adoption of precision-ag applications
Variable-rate sprayers, drone scouting, and IoT (Internet of Things) telemetry elevate foliar fertilizer market performance by matching dosage to in-field variability. Data-driven timing cuts over-application by 25% and improves nutrient-use efficiency. Users integrate satellite vegetation indices with weather forecasts to pinpoint the most permeable leaf stages, boosting uptake. Equipment payback periods now average three years, a threshold that persuades medium-sized farms to invest. Hardware vendors partner with fertilizer producers to bundle software licenses with nutrient packages, weaving stronger channel partnerships.
Volatility in raw-material prices for nitrates and phosphates
Ammonium nitrate prices climbed 45% in 2024 due to energy-market turmoil, squeezing margins for liquid foliar producers that rely on high-purity inputs. Forward contracts mitigate some risk, yet small manufacturers lack the credit lines to hedge. Spot sourcing forces many to ration production in peak season, disrupting supply. Industry consolidation could accelerate as bigger firms pursue economy-of-scale procurement. Regulatory reviews of phosphate exports from China inject further uncertainty into long-term planning.
Other drivers and restraints analyzed in the detailed report include:
- Increasing high-value horticultural acreage
- Growth of carbon-credit linked foliar nutrition schemes
- Limited crop-leaf absorption beyond critical phenological windows
For complete list of drivers and restraints, kindly check the Table Of Contents.
Segment Analysis
Straight products account for 50.18% of the foliar fertilizer market share in 2025 because their single-nutrient focus offers low cost and flexible dosing. Yet complex blends show a 6.19% CAGR, indicating a stronger pull from growers who want multi-nutrient convenience. Complex nanochelated formulas extend nutrient residence time, lifting uptake by 20% compared with unchelated salts. Their tank-mix compatibility with biostimulants trims labor because one pass suffices for both nutrition and stress mitigation. Straight iron or zinc sprays remain vital for acute corrections, such as citrus greening defense, underscoring a complementary rather than exclusive relationship. Regulatory dossiers for complex products demand more residue data, creating barriers that deter low-cap ex entrants.
Suppliers upscale chelation plants in Europe and Israel to match this momentum. Marketing positions revolve around "complete crop diets," and subscription supply contracts gain traction in greenhouse hubs. Straight products keep traction in broad-acre cereals where single-deficiency fixes suffice, especially in Argentina and Kazakhstan. Discounting pressure intensifies because commoditized salts face rising raw-material costs without parallel pricing power.
The Foliar Fertilizer Market Report is Segmented by Type (Complex and Straight), Crop Type (Field Crops, Horticultural Crops, and Turf and Ornamental), and Geography (North America, South America, Europe, Asia-Pacific, The Middle East, and Africa). The Market Forecasts are Provided in Terms of Value (USD) and Volume (Metric Tons).
Geography Analysis
Asia-Pacific contributed 43.78% of global revenue in 2025, as government rebate programs in China covered up to 20% of foliar purchase costs. Indian cooperatives such as Indian Farmers Fertiliser Cooperative Limited (IFFCO) scaled nano-urea sprays to 3 million liters in 2025, widening farmer familiarity. Tropical climatic variability also favors split applications, so foliar feeding supplements soil regimes during monsoon leaching events. Distribution advances, including solar-powered cold stores in Vietnam, reduce spoilage for temperature-sensitive solutions. Research partnerships with state universities sharpen product localization, and e-commerce channels reach smallholder clusters. North America offers a mature but innovation-driven arena. Precision-ag connectivity and carbon-offset payments create layered incentives. Pilot projects in Iowa report that foliar sulfur combined with variable-rate nitrogen cuts total synthetic use by 12%, helping maize growers meet sustainability metrics.
Canada's Clean Fuel Regulations credit growers for emission-reducing practices, and foliar methods count toward compliance. Market-share battles hinge on advisory services; companies that bundle remote sensing analytics with product supply win renewals at double the rate of input-only vendors. Europe balances growth with regulatory constraint. The European Union Farm to Fork strategy mandates a 20% fertilizer reduction by 2030, steering funds toward high-efficiency foliar technologies that slash soil losses. Dutch horticulture pioneers foliar magnesium nitrate drip-mist systems that lift greenhouse cucumber yields 15% while maintaining low runoff. Eastern Europe emerges as a volume booster as Poland and Romania upgrade machinery fleets. Micronutrient residue thresholds tighten, forcing reformulation to comply with European Food Safety Authority limits. Suppliers that certify quickly enjoy first-mover shelf access.
The Middle East and Africa grows fastest at 6.42% CAGR. Saudi Vision 2030 funds hydroponic megafarms that lean heavily on foliar inputs to conserve desert water. Kenyan avocado exporters meet strict European residue caps using low-rate copper foliar mixes, boosting export acceptance rates. Infrastructure gaps persist, but mobile cold-chain units now reach peri-urban hubs, reducing spoilage. South Africa's grain sector trials drone-based foliar nitrogen to offset high urea prices, showing 8% yield uplift.
- Grupa Azoty S.A.
- Haifa Chemicals Ltd
- ICL Group Ltd
- Indian Farmers Fertiliser Cooperative Ltd
- Sociedad Quimica y Minera de Chile SA
- The Mosaic Company
- UPL Limited
- Yara International ASA
- Nutrien Ltd
- K+S Aktiengesellschaft
- EuroChem Group AG
- Coromandel International Ltd
- CF Industries Holdings Inc.
- Yara International ASA
- Brandt Inc.
Additional Benefits:
- The market estimate (ME) sheet in Excel format
- 3 months of analyst support
TABLE OF CONTENTS
1 INTRODUCTION
- 1.1 Study Assumptions and Market Definition
- 1.2 Scope of the Study
- 1.3 Research Methodology
2 REPORT OFFERS
3 EXECUTIVE SUMMARY AND KEY FINDINGS
4 KEY INDUSTRY TRENDS
- 4.1 Acreage Of Major Crop Types
- 4.1.1 Field Crops
- 4.1.2 Horticultural Crops
- 4.2 Average Nutrient Application Rates
- 4.2.1 Micronutrients
- 4.2.1.1 Field Crops
- 4.2.1.2 Horticultural Crops
- 4.2.2 Primary Nutrients
- 4.2.2.1 Field Crops
- 4.2.2.2 Horticultural Crops
- 4.2.3 Secondary Macronutrients
- 4.2.3.1 Field Crops
- 4.2.3.2 Horticultural Crops
- 4.2.1 Micronutrients
- 4.3 Agricultural Land Equipped For Irrigation
- 4.4 Regulatory Framework
- 4.5 Value Chain and Distribution Channel Analysis
- 4.6 Market Drivers
- 4.6.1 Rising push toward balanced fertilization programs
- 4.6.2 Rapid adoption of precision-ag applications
- 4.6.3 Increasing high-value horticultural acreage
- 4.6.4 Growth of carbon-credit linked foliar nutrition schemes
- 4.6.5 On-farm biostimulant blending with foliar fertilizers
- 4.6.6 Nanochelated nutrient formulations lowering application rates
- 4.7 Market Restraints
- 4.7.1 Volatility in raw-material prices for nitrates and phosphates
- 4.7.2 Limited crop-leaf absorption beyond critical phenological windows
- 4.7.3 Residue-limit tightening for foliar micronutrients in export markets
- 4.7.4 Logistics bottlenecks for temperature-sensitive liquid products
5 MARKET SIZE AND GROWTH FORECASTS (VALUE AND VOLUME)
- 5.1 Type
- 5.1.1 Complex
- 5.1.2 Straight
- 5.1.2.1 By Nutrient
- 5.1.2.1.1 Micronutrients
- 5.1.2.1.2 Nitrogenous
- 5.1.2.1.3 Phosphatic
- 5.1.2.1.4 Potassic
- 5.1.2.1.5 Secondary Macronutrients
- 5.1.2.1 By Nutrient
- 5.2 Crop Type
- 5.2.1 Field Crops
- 5.2.2 Horticultural Crops
- 5.2.3 Turf and Ornamental
- 5.3 Region
- 5.3.1 Asia-Pacific
- 5.3.1.1 Australia
- 5.3.1.2 Bangladesh
- 5.3.1.3 China
- 5.3.1.4 India
- 5.3.1.5 Indonesia
- 5.3.1.6 Japan
- 5.3.1.7 Pakistan
- 5.3.1.8 Philippines
- 5.3.1.9 Thailand
- 5.3.1.10 Vietnam
- 5.3.1.11 Rest of Asia-Pacific
- 5.3.2 Europe
- 5.3.2.1 France
- 5.3.2.2 Germany
- 5.3.2.3 Italy
- 5.3.2.4 Netherlands
- 5.3.2.5 Russia
- 5.3.2.6 Spain
- 5.3.2.7 Ukraine
- 5.3.2.8 United Kingdom
- 5.3.2.9 Rest of Europe
- 5.3.3 Middle East and Africa
- 5.3.3.1 Nigeria
- 5.3.3.2 Saudi Arabia
- 5.3.3.3 South Africa
- 5.3.3.4 Turkey
- 5.3.3.5 Rest of Middle East and Africa
- 5.3.4 North America
- 5.3.4.1 Canada
- 5.3.4.2 Mexico
- 5.3.4.3 United States
- 5.3.4.4 Rest of North America
- 5.3.5 South America
- 5.3.5.1 Argentina
- 5.3.5.2 Brazil
- 5.3.5.3 Rest of South America
- 5.3.1 Asia-Pacific
6 COMPETITIVE LANDSCAPE
- 6.1 Key Strategic Moves
- 6.2 Market Share Analysis
- 6.3 Company Landscape
- 6.4 Company Profiles (includes Global level Overview, Market level overview, Core Segments, Financials as available, Strategic Information, Market Rank/Share for key companies, Products and Services, and Recent Developments)
- 6.4.1 Grupa Azoty S.A.
- 6.4.2 Haifa Chemicals Ltd
- 6.4.3 ICL Group Ltd
- 6.4.4 Indian Farmers Fertiliser Cooperative Ltd
- 6.4.5 Sociedad Quimica y Minera de Chile SA
- 6.4.6 The Mosaic Company
- 6.4.7 UPL Limited
- 6.4.8 Yara International ASA
- 6.4.9 Nutrien Ltd
- 6.4.10 K+S Aktiengesellschaft
- 6.4.11 EuroChem Group AG
- 6.4.12 Coromandel International Ltd
- 6.4.13 CF Industries Holdings Inc.
- 6.4.14 Yara International ASA
- 6.4.15 Brandt Inc.
7 KEY STRATEGIC QUESTIONS FOR FERTILIZER CEOS

