PUBLISHER: Mordor Intelligence | PRODUCT CODE: 2124562

PUBLISHER: Mordor Intelligence | PRODUCT CODE: 2124562
Telecom Expense Management - Market Share Analysis, Industry Trends & Statistics, Growth Forecasts (2026 - 2031)
According to Mordor Intelligence, the telecom expense management market size was valued at USD 4.95 billion in 2025 and estimated to grow from USD 5.64 billion in 2026 to reach USD 10.85 billion by 2031, at a CAGR of 13.98% during the forecast period (2026-2031).
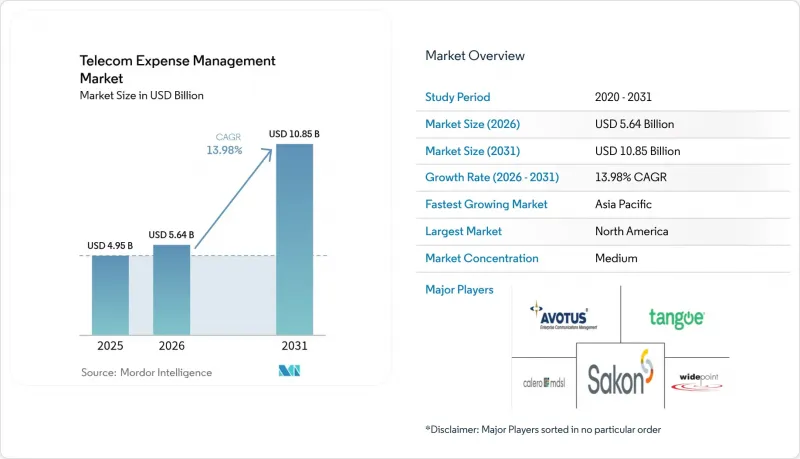
This report is Segmented by Solution (Invoice Management, Device Management, Sourcing, Auditing, Usage Reporting, Dispute Management, and More), Service (Managed, Cloud, Professional), Deployment (On-Premise, Cloud, Hybrid), Organization Size (Large, SME), End-User (BFSI, Manufacturing, IT, Healthcare, Government), and Geography. The Market Forecasts are Provided in Terms of Value (USD).
Global Telecom Expense Management Market Trends and Insights
Need for Visibility into Telecom Spend and Tariff Complexity
Hybrid ecosystems of private networks, edge workloads, and IoT links create billing layers that manual processes cannot reconcile at scale. Valicom audits show error rates in more than 35% of telecom invoices, affecting rate accuracy, zero-use lines, and end-of-life services. Consumption-based 5G and cloud bundles intensify the risk of bill shock, forcing finance and network teams to migrate toward real-time dashboards that pair usage telemetry with predictive benchmarks. Operator migration to API-based network slicing adds another variable set, challenging enterprises to stay ahead of cascading tariff structures. Finance controllers also face compliance duties that require cost allocation by business unit and jurisdiction, accelerating the shift from spreadsheet tracking to specialized telecom expense management market platforms.
Integration of AI/Analytics for Automated Invoice Auditing
Artificial intelligence recasts expense oversight from periodic review to perpetual optimization. Tangoe reports that machine-learning models flag anomalies, contract breaches, and optimization opportunities within minutes of file ingestion. KPMG notes that automated invoice workflows reduce manual effort by 60-80% while lifting accuracy rates, freeing analysts to negotiate instead of reconcile. Advanced platforms map usage patterns against productivity metrics, guiding right-sizing decisions that align cost with business value. Continuous learning loops refine policy recommendations, tightening vendor compliance and elevating savings delivered by the telecom expense management market.
Data-Security Concerns Limiting TEM Outsourcing
Highly regulated sectors hesitate to expose telecom usage files containing sensitive operational data. Rising ransomware incidents and cross-border privacy regimes deepen due-diligence cycles, adding cost and elongating sales cycles for providers. Hybrid deployment models that keep raw data on-premise but run analytics in the cloud mitigate some risk yet decrease optimization depth. Providers must invest in SOC2-type attestations, zero-trust architectures, and region-specific data-sovereignty controls to ease concerns and unlock broader uptake within the telecom expense management market.
Other drivers and restraints analyzed in the detailed report include:
- Proliferation of BYOD and Mobile Workforce Adoption
- Shift from CapEx to OpEx via Managed Services
- Shadow-IT Obscuring Usage Data Accuracy
For complete list of drivers and restraints, kindly check the Table Of Contents.
Segment Analysis
Invoice management retained 35.57% of the telecom expense management market share in 2025, underscoring enterprises' persistent focus on billing accuracy and allocation discipline. The solution's embedded workflows validate rates, line items, and taxes across thousands of invoice feeds, defending budget integrity in complex multi-vendor estates. Valicom audits routinely uncover 15-20% recoverable spend, highlighting why invoice control remains foundational. Yet a strategic pivot is underway: usage management and reporting is scaling at a 14.04% CAGR, signaling hunger for real-time dashboards that avoid surprise overages instead of reconciling them after the fact.
The telecom expense management market now pairs traditional invoice engines with AI-driven analytics that forecast consumption against policy thresholds, automatically generating recommendations before the billing cut-off. As 5G slicing, edge workloads, and UCaaS grow, enterprises demand predictive insights to mix and match service tiers dynamically. Vendors respond by embedding machine-learning models and intuitive visualization layers, a shift that moves the category from post-pay hygiene to proactive optimization.
Managed services led with 41.82% of the telecom expense management market size in 2025 as boards pushed to convert fixed technology costs into variable service fees linked to outcomes. Providers furnish rate-benchmark libraries, carrier negotiation muscle, and continuous process governance that most enterprises cannot develop internally. The hosted-cloud services slice expands fastest at 14.15% CAGR, propelled by subscription flexibility and hassle-free upgrades.
Platform convergence is blurring lines between managed and hosted modes. Many vendors now bundle advisory muscle with SaaS consoles, letting clients dial service levels up or down without re-platforming. The consumption model also appeals to private-equity-backed enterprises that maintain lean IT headcount while scaling acquisitions. This interplay keeps both delivery models intertwined within the telecom expense management market roadmap.
Complete Report Scope:
- By Solution
- Invoice Management
- Mobility and Device Management
- Sourcing and Procurement
- Expense Auditing and Optimization
- Usage Management and Reporting
- Dispute Management
- Inventory Management
- UCC Cost Management
- Other Solutions
- By Service
- Managed Service
- Hosted / Cloud Service
- Professional Services
- By Deployment Mode
- On-premise
- Cloud / SaaS
- Hybrid
- By Organization Size
- Large Enterprises
- Small and Medium Enterprises
- By End-user Industry
- BFSI
- Retail and Consumer Goods
- Manufacturing
- IT and Telecom
- Healthcare and Life Sciences
- Energy and Utilities
- Government and Public Sector
- Other End-user Industries
- By Geography
- North America
- United States
- Canada
- Mexico
- Europe
- United Kingdom
- Germany
- France
- Italy
- Spain
- Russia
- Rest of Europe
- Asia-Pacific
- China
- India
- Japan
- South Korea
- Australia and New Zealand
- ASEAN (Singapore, Indonesia, Thailand)
- Rest of Asia-Pacific
- South America
- Brazil
- Argentina
- Colombia
- Rest of South America
- Middle East
- Saudi Arabia
- United Arab Emirates
- Turkey
- Israel
- Rest of Middle East
- Africa
- South Africa
- Nigeria
- Kenya
- Rest of Africa
- North America
Geography Analysis
North America commanded 35.42% revenue in 2025, driven by mature procurement frameworks, strict SOX and FCC reporting rules, and an entrenched ecosystem of service providers offering deep carrier relationships. U.S. multinationals juggle vast cross-border voice, data, and IoT estates, heightening reliance on granular analytics to sharpen contract negotiations and allocate spend by business unit. Regulatory incentives around e-rate, C-band clearing, and green-spectrum auctions continue to reshape billing constructs, offering the telecom expense management market steady demand stimuli.
Asia-Pacific is the sprint leader with a 14.18% CAGR between 2026 and 2031. GSMA projects 2.1 billion mobile subscribers feeding USD 880 billion into regional GDP by 2030. This subscriber swell accelerates private-network pilots across manufacturing hubs in Japan, South Korea, and India. Expereo observes that the region drives roughly 60% of global data-center capacity growth, layering new vendor mixes onto enterprise connectivity stacks. As currencies fluctuate and regulatory regimes diversify, CFOs adopt sophisticated telecom expense management market tools to consolidate carrier bills, normalize tax treatments, and keep pace with dynamic discount schedules.
Europe maintains a steady climb powered by GDPR, eco-design directives, and rising carbon-reporting obligations that force enterprises to quantify telecom-linked Scope-3 footprint. Multi-country operators issue invoices in varied templates and tax codes, fuelling uptake of AI-driven normalization engines. Middle East and Africa show green-shoot potential as 5G rollouts, smart-city ambitions, and public-sector modernization inject complexity into billing ecosystems. South America, led by Brazil and Argentina, turns to SaaS-based solutions to battle currency volatility and telecom inflation. Collectively, geographic nuance sustains a diversified growth trajectory for the telecom expense management market, shielding it from isolated macro shocks.
- Tangoe Inc.
- Calero-MDSL
- Cass Information Systems Inc.
- Sakon Inc.
- Tellennium Inc.
- WidePoint Corporation
- Avotus Corporation
- Valicom Corporation
- Upland Software Inc. (Cimpl)
- CGI Inc.
- Accenture PLC (Network Services)
- TeleManagement Technologies Inc.
- Auditmacs
- Dimension Data (NTT Ltd.)
- Mitel Networks Corp.
- Intrado Corporation (West)
- Advantix Solutions Group
- Comview Corporation (Calero)
- Subex Ltd.
- Xigo (Verizon)
- Basware Corp.
Additional Benefits:
- The market estimate (ME) sheet in Excel format
- 3 months of analyst support
TABLE OF CONTENTS
1 INTRODUCTION
- 1.1 Study Assumptions and Market Definition
- 1.2 Scope of the Study
2 RESEARCH METHODOLOGY
3 EXECUTIVE SUMMARY
4 MARKET LANDSCAPE
- 4.1 Market Overview
- 4.2 Market Drivers
- 4.2.1 Proliferation of BYOD and mobile workforce adoption
- 4.2.2 Need for visibility into telecom spend and tariff complexity
- 4.2.3 Shift from CapEx to OpEx via managed services
- 4.2.4 Integration of AI/analytics for automated invoice auditing
- 4.2.5 Private-5G networks creating new expense categories
- 4.2.6 Sustainability pressure for Scope-3 telecom usage reporting
- 4.3 Market Restraints
- 4.3.1 Data-security concerns limiting TEM outsourcing
- 4.3.2 Fragmented invoice formats and lack of standards
- 4.3.3 Shadow-IT obscuring usage data accuracy
- 4.3.4 Talent shortage in TEM analytics specialists
- 4.4 Value / Supply-Chain Analysis
- 4.5 Regulatory Landscape
- 4.6 Technological Outlook
- 4.7 Porter's Five Forces Analysis
- 4.7.1 Bargaining Power of Suppliers
- 4.7.2 Bargaining Power of Buyers/Consumers
- 4.7.3 Threat of New Entrants
- 4.7.4 Threat of Substitute Products
- 4.7.5 Intensity of Competitive Rivalry
- 4.8 Macroeconomic Impact Analysis (incl. COVID-19 and Inflation)
5 MARKET SIZE AND GROWTH FORECASTS (VALUE)
- 5.1 By Solution
- 5.1.1 Invoice Management
- 5.1.2 Mobility and Device Management
- 5.1.3 Sourcing and Procurement
- 5.1.4 Expense Auditing and Optimization
- 5.1.5 Usage Management and Reporting
- 5.1.6 Dispute Management
- 5.1.7 Inventory Management
- 5.1.8 UCC Cost Management
- 5.1.9 Other Solutions
- 5.2 By Service
- 5.2.1 Managed Service
- 5.2.2 Hosted / Cloud Service
- 5.2.3 Professional Services
- 5.3 By Deployment Mode
- 5.3.1 On-premise
- 5.3.2 Cloud / SaaS
- 5.3.3 Hybrid
- 5.4 By Organization Size
- 5.4.1 Large Enterprises
- 5.4.2 Small and Medium Enterprises
- 5.5 By End-user Industry
- 5.5.1 BFSI
- 5.5.2 Retail and Consumer Goods
- 5.5.3 Manufacturing
- 5.5.4 IT and Telecom
- 5.5.5 Healthcare and Life Sciences
- 5.5.6 Energy and Utilities
- 5.5.7 Government and Public Sector
- 5.5.8 Other End-user Industries
- 5.6 By Geography
- 5.6.1 North America
- 5.6.1.1 United States
- 5.6.1.2 Canada
- 5.6.1.3 Mexico
- 5.6.2 Europe
- 5.6.2.1 United Kingdom
- 5.6.2.2 Germany
- 5.6.2.3 France
- 5.6.2.4 Italy
- 5.6.2.5 Spain
- 5.6.2.6 Russia
- 5.6.2.7 Rest of Europe
- 5.6.3 Asia-Pacific
- 5.6.3.1 China
- 5.6.3.2 India
- 5.6.3.3 Japan
- 5.6.3.4 South Korea
- 5.6.3.5 Australia and New Zealand
- 5.6.3.6 ASEAN (Singapore, Indonesia, Thailand)
- 5.6.3.7 Rest of Asia-Pacific
- 5.6.4 South America
- 5.6.4.1 Brazil
- 5.6.4.2 Argentina
- 5.6.4.3 Colombia
- 5.6.4.4 Rest of South America
- 5.6.5 Middle East
- 5.6.5.1 Saudi Arabia
- 5.6.5.2 United Arab Emirates
- 5.6.5.3 Turkey
- 5.6.5.4 Israel
- 5.6.5.5 Rest of Middle East
- 5.6.6 Africa
- 5.6.6.1 South Africa
- 5.6.6.2 Nigeria
- 5.6.6.3 Kenya
- 5.6.6.4 Rest of Africa
- 5.6.1 North America
6 COMPETITIVE LANDSCAPE
- 6.1 Market Concentration
- 6.2 Strategic Moves
- 6.3 Market Share Analysis
- 6.4 Company Profiles (includes Global level Overview, Market level overview, Core Segments, Financials as available, Strategic Information, Market Rank/Share for key companies, Products and Services, and Recent Developments)
- 6.4.1 Tangoe Inc.
- 6.4.2 Calero-MDSL
- 6.4.3 Cass Information Systems Inc.
- 6.4.4 Sakon Inc.
- 6.4.5 Tellennium Inc.
- 6.4.6 WidePoint Corporation
- 6.4.7 Avotus Corporation
- 6.4.8 Valicom Corporation
- 6.4.9 Upland Software Inc. (Cimpl)
- 6.4.10 CGI Inc.
- 6.4.11 Accenture PLC (Network Services)
- 6.4.12 TeleManagement Technologies Inc.
- 6.4.13 Auditmacs
- 6.4.14 Dimension Data (NTT Ltd.)
- 6.4.15 Mitel Networks Corp.
- 6.4.16 Intrado Corporation (West)
- 6.4.17 Advantix Solutions Group
- 6.4.18 Comview Corporation (Calero)
- 6.4.19 Subex Ltd.
- 6.4.20 Xigo (Verizon)
- 6.4.21 Basware Corp.
7 MARKET OPPORTUNITIES AND FUTURE OUTLOOK
- 7.1 White-space and Unmet-Need Assessment

