
PUBLISHER: Mordor Intelligence | PRODUCT CODE: 1851978

PUBLISHER: Mordor Intelligence | PRODUCT CODE: 1851978
Asia-Pacific Silica Sand - Market Share Analysis, Industry Trends & Statistics, Growth Forecasts (2025 - 2030)
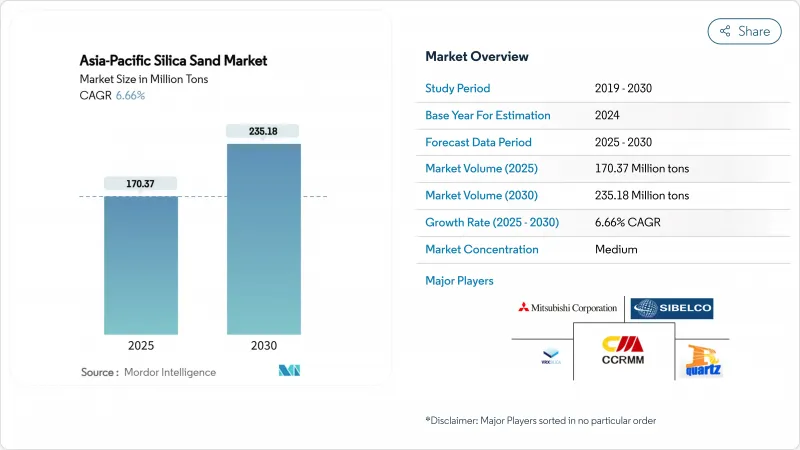
The Asia-Pacific Silica Sand Market size is estimated at 170.37 million tons in 2025, and is expected to reach 235.18 million tons by 2030, at a CAGR of 6.66% during the forecast period (2025-2030).
Multiple demand centers, including glass manufacturing, electronics, foundry applications, and construction materials, are converging to sustain this expansion. Glass grade sand remains the workhorse because flat and container glass output tracks the region's rapid urbanization and vehicle production. At the same time, hyper-purity quartz (HPQ) grades are transitioning from a niche toward mainstream status as semiconductor manufacturers push below the 3-nanometer design rule. Competitive intensity is rising as large, integrated miners accelerate automation and environmental compliance to lock in premium contracts while smaller operators struggle to meet tightening regulations. Mid-term opportunities cluster around solar glass, advanced electronics, and cross-border infrastructure projects that lock in long-haul supply contracts across Southeast Asia.
Asia-Pacific Silica Sand Market Trends and Insights
Construction-Led Flat and Container Glass Demand Surge
Thailand's Eastern Economic Corridor is driving 3-4% annual construction growth through 2026, lifting demand for flat and container glass across public works, commercial complexes, and residential towers. Glass manufactures treat silica sand as an essential cost component, often exceeding 60% of raw-material expenses, so rising project backlogs translate directly into higher sand uplift. Inventory corrections that hurt 2024 margins have already reversed, with most ASEAN producers reporting fuller order books for 2025 delivery. Cross-border infrastructure corridors under the ASEAN Connectivity vision are boosting long-distance shipments from Malaysia and Australia to inland Chinese float-glass lines, tightening freight capacity on favored routes. Given that glass output trails economic activity with a 6- to 12-month lag, the rebound indicates a clear volume runway through at least 2027. Energy-efficient low-iron variants secure additional premiums because they enable thinner glazing standards in green-building codes.
Foundry Revival for EV and Wind-Power Castings
Electric-vehicle casting technology increasingly specifies narrow thermal-expansion bands, pushing foundries toward calibrated silica sand blends with tighter grain-size distributions. China's clean-energy leadership, 70% of global output in 2024, created a lift in aluminum and ductile-iron casting that consumed roughly 9.1 million tons of foundry sand region-wide last year. Japan and South Korea, home to advanced molding machinery, are exporting turnkey foundry lines into Thailand and Vietnam, prompting localized demand for premium sand grades. The effect cascades through wind-turbine hubs clustered in Fujian, Jeju, and Cebu, where final-machined castings absorb high silica volumes for nacelle housings and hub assemblies. Investment pipelines worth USD 235 billion in 2024 targeted clean-energy manufacturing, signalling durable sand flows into 2030. Producers that certify thermal-shock performance and dimensional accuracy are capturing multiyear supply contracts from battery and turbine OEMs.
Illegal and Unregulated Sand Mining Curbs
Rising enforcement is shrinking unregistered output across riverine deposits, especially in India, where the estimated 52 million-worker cohort exposed to silica dust has spurred sweeping health-and-safety reforms. New exposure limits - 50 µg/m3 for respirable crystalline silica mandate capital upgrades like wet-scrubbing and enclosed conveyors, adding 4-6% to mining opex for compliant operators. In China, authorities canceled thousands of small-scale licenses, reducing projected 2025 supply gaps from 63% to 4% through centrally managed quotas. Such crackdowns eliminate low-cost competition but tighten local availability, reinforcing the Asia-Pacific silica sand market's reliance on compliant, higher-cost output. Price volatility has already widened between informal spot cargoes and contract-grade supplies.
Other drivers and restraints analyzed in the detailed report include:
- Rapid Infrastructure Spending Across ASEAN
- Indonesia's Silica Downstreaming for Semiconductors
- Substitution by Engineered, Sand-Free Building Materials
For complete list of drivers and restraints, kindly check the Table Of Contents.
Segment Analysis
The glass grade segment captured 64.36% of 2024 shipments, underscoring its role as the backbone of the Asia-Pacific silica sand market. Hyper HPQ, though only a sliver of volume today, is projected to post an 11.29% CAGR, raising its stake in the Asia-Pacific silica sand market size from 2025 onward.
Supply security hinges on automated beneficiation lines, optical sorting, and clean-energy kiln conversions that meet environmental benchmarks. Producers able to certify nuclear-level purity enter the semiconductor chain, while mid-tier suppliers target solar and optics. Blending strategies are emerging, where moderate-purity Indonesian feedstock is upgraded via Japanese chemical leaching, showing how collaboration can capture margin without greenfield development.
The Asia-Pacific Silica Sand Report is Segmented by Grade (Foundry/Smelter Grade, Glass Grade Sand, Optical Glass Grade, and More), End-User Industry (Glass Manufacturing, Foundry, Chemical Production, Construction, and More), and Geography (China, India, Japan, South Korea, Indonesia, Thailand, Malaysia, Singapore, Philippines, Vietnam, and Rest of Asia-Pacific). The Market Forecasts are Provided in Terms of Volume (Million Tons).
List of Companies Covered in this Report:
- Chongqing Changjiang River Moulding Material Group Co., Ltd.
- Covia Holdings LLC
- Diatreme Resources Limited
- Imerys
- JFE Mineral & Alloy Company,Ltd
- Mangal Minerals
- Mitsubishi Corporation
- Raghav Productivity Enhancers Limited
- Sibelco
- Tochu Corporation
- Tosoh Silica Corporation
- VRX Silica
- Xinyi Golden Ruite Quartz Materials Co., Ltd
- Xinyi Solar Holdings Limited
Additional Benefits:
- The market estimate (ME) sheet in Excel format
- 3 months of analyst support
TABLE OF CONTENTS
1 Introduction
- 1.1 Study Assumptions and Market Definition
- 1.2 Scope of the Study
2 Research Methodology
3 Executive Summary
4 Market Landscape
- 4.1 Market Overview
- 4.2 Market Drivers
- 4.2.1 Construction-led flat and container glass demand surge
- 4.2.2 Foundry revival for EV and wind-power castings
- 4.2.3 Rapid infrastructure spending across ASEAN
- 4.2.4 Shift to energy-efficient low-iron solar glass
- 4.2.5 Indonesia's silica downstreaming for semiconductors
- 4.3 Market Restraints
- 4.3.1 Illegal and unregulated sand mining curbs
- 4.3.2 Substitution by engineered, sand-free building materials
- 4.3.3 Government drive to consolidate small mines (license cancellations)
- 4.4 Value Chain Analysis
- 4.5 Porter's Five Forces Analysis
- 4.5.1 Bargaining Power of Suppliers
- 4.5.2 Bargaining Power of Buyers
- 4.5.3 Threat of New Entrants
- 4.5.4 Threat of Substitutes
- 4.5.5 Degree of Competition
5 Market Size and Growth Forecasts (Volume)
- 5.1 By Grade
- 5.1.1 Foundry/Smelter Grade
- 5.1.2 Glass Grade Sand
- 5.1.3 Optical Glass Grade
- 5.1.4 Intermediate HPQ
- 5.1.5 Ultra High HPQ
- 5.1.6 Hyper HPQ
- 5.2 By End-user Industry
- 5.2.1 Glass Manufacturing
- 5.2.2 Foundry
- 5.2.3 Chemical Production
- 5.2.4 Construction
- 5.2.5 Paints and Coatings
- 5.2.6 Ceramics and Refractories
- 5.2.7 Filtration
- 5.2.8 Oil and Gas
- 5.2.9 Other End-user Industries
- 5.3 By Geography
- 5.3.1 China
- 5.3.2 India
- 5.3.3 Japan
- 5.3.4 South Korea
- 5.3.5 Indonesia
- 5.3.6 Thailand
- 5.3.7 Malaysia
- 5.3.8 Singapore
- 5.3.9 Philippines
- 5.3.10 Vietnam
- 5.3.11 Rest of Asia-Pacific
6 Competitive Landscape
- 6.1 Market Concentration
- 6.2 Strategic Moves (Mergers and Acquisitions, JVs, Capacity Expansions)
- 6.3 Market Share (%)**/Ranking Analysis
- 6.4 Company Profiles (includes Global level Overview, Market level overview, Core Segments, Financials as available, Strategic Information, Market Rank/Share for key companies, Products and Services, and Recent Developments)
- 6.4.1 Chongqing Changjiang River Moulding Material Group Co., Ltd.
- 6.4.2 Covia Holdings LLC
- 6.4.3 Diatreme Resources Limited
- 6.4.4 Imerys
- 6.4.5 JFE Mineral & Alloy Company,Ltd
- 6.4.6 Mangal Minerals
- 6.4.7 Mitsubishi Corporation
- 6.4.8 Raghav Productivity Enhancers Limited
- 6.4.9 Sibelco
- 6.4.10 Tochu Corporation
- 6.4.11 Tosoh Silica Corporation
- 6.4.12 VRX Silica
- 6.4.13 Xinyi Golden Ruite Quartz Materials Co., Ltd
- 6.4.14 Xinyi Solar Holdings Limited
7 Market Opportunities and Future Outlook
- 7.1 White-space and Unmet-need Assessment

