
Need help finding what you are looking for?
Contact Us
PUBLISHER: Mordor Intelligence | PRODUCT CODE: 1693892

PUBLISHER: Mordor Intelligence | PRODUCT CODE: 1693892
North America Silica Sand - Market Share Analysis, Industry Trends & Statistics, Growth Forecasts (2025 - 2030)
PUBLISHED:
PAGES: 100 Pages
DELIVERY TIME: 2-3 business days
SELECT AN OPTION
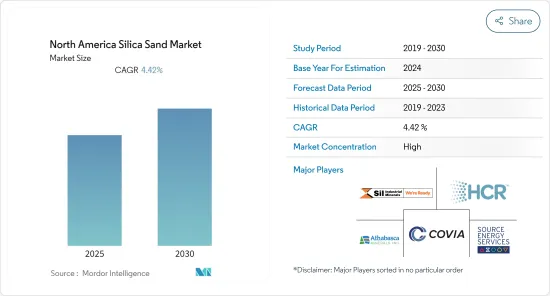
The North America Silica Sand Market is expected to register a CAGR of 4.42% during the forecast period.
Key Highlights
- The COVID-19 pandemic affected several industries negatively. The lockdown in most countries in North America caused disruptions in infrastructure and construction activities, mining operations, and freight transportation which disturbed the supply chain. However, the conditions started recovering in 2021, restoring the market's growth trajectory.
- The growing demand from the glass production industry in North America and consumption in the foundry industry are major factors driving the growth of the market studied.
- However, the illegal mining of sand and the availability of substitutes for silica sand are likely to restrain the growth of the studied market.
- Nevertheless, the development of sand-based treatments in dentistry and biotechnology is likely to create lucrative growth opportunities for the studied market.
- The United States represents the largest market for silica sand in the region owing to the highest consumption of silica sand from the oil and gas and glass production industries.
North America Silica Sand Market Trends
Oil and Gas Industry to Dominate the Market
- Silica sand, also known as "frac sand," comes from its use in hydraulic fracturing, a completion method used by oil and gas companies to produce natural gas, natural gas liquids, and oil from unconventional, low permeability reservoirs such as shale.
- Silica sand is essential in the process of fracturing shale to release natural gas, oil, and natural gas liquids from pores in the rock. When the high-pressure water stream forces the small perforations to become larger fractures, fracking sand keeps these fractures open to continue releasing fossil fuels. When white sand is used to prop open these fractures, it is referred to as a proppant. The longer the proppant can withstand the enormous pressure of the fractures. The more petroleum can be extracted, maximizing the well's efficiency.
- The United States and Canada are among the world's largest Oil and Gas producers. Canada is the world's fourth-largest producer of oil. The Canadian oil and gas industry has direct and indirect operations (including offshore) in twelve provinces and territories.
- According to the Energy Institute Statistical Review of World Energy 2023, Canada's oil production in 2022 was 274 million tonnes, accounting for 6.2% of the global share. Further, this represents a nearly 2.8% increase in production over the previous year.
- Additionally, according to the Canadian Association of Petroleum Producers, spending in Canada is expected to rise to USD 40 billion in 2023, 11% more compared to 2022. Oil sands investment for 2023 is expected to reach USD 11.5 billion, whereas conventional oil and natural gas capital investment is projected at USD 28.5 billion.
- The total production of crude oil and liquid fuels in North America was 27.81 million barrels per day in 2022, compared to 26.44 million barrels per day in 2021.
- The United States is one of the leading countries globally in the exploration of unconventional crude oil reserves, indicating a massive opportunity for the studied market in the country.
- The United States is one of the world's largest consumers and exporters of oil and gas. According to U.S. Energy Information Administration (EIA), crude oil production in the United States was an average of 11.9 million barrels per day (b/d) in 2022, up 0.7 million b/d from 2021. Also, the output will is expected to exceed 12.8 million b/d in 2023, breaking the previous annual average record of 12.3 million b/d set in 2019.
- Considering the steady growth of oil and gas production in the region, the demand for silica sand is likely to grow during the forecast period.
United States to Dominate the Regional Market
- The oil and gas industry is the country's major consumer of silica sand. According to the US Energy Information Administration, the crude oil output was 11.9 million bpd (barrels per day) in 2022. This is estimated to average 12.41 million bpd by 2023 and 12.8 million bpd in 2024. With the increase in heat consumption by the population and to meet the industrial requirement, the demand is expected to surge.
- The demand for whole-grain silica has increased in the United States in recent years. The market for whole-grain silica is being boosted by the development of new roads and buildings.
- The construction industry is one of the largest consumers of silica sand. The physical properties of silica sands are different from the normal construction sands. The properties of silica sand include the combination of chemical and physical properties, such as high silica content and very low levels of deleterious impurities, for which the demand for silica sand has been increasing in the construction industry in recent times.
- Additionally, as per further statistics generated by the US Census Bureau, the annual value for new construction put in place in the United States accounted for USD 1.66 trillion in 2022, compared to USD 1.50 trillion in 2021.
- The annual value of residential construction put in place in the United States was valued at USD 849.16 million in 2022, compared to USD 740.65 million in 2021. The annual value of non-residential construction put in place in the country was valued at USD 808.43 million in 2022, compared to USD 759.18 million in 2021, thereby increasing the consumption of silica sand in the short term.
- Foundry sand is a uniform silica sand of high consistency that is used to produce molds and cores for ferrous and nonferrous metal castings. It typically comprises more than 80% high-quality silica sand, 5-10% bentonite clay, 2 to 5% water, and less than 5% sea coal. Because of the high silica levels of silica sand, the foundry industry can produce high-integrity castings, free of defects and with superior surface finishes. The rising demand for steel and aluminum in various industries, including automotive, construction, and electronics, is projected to boost the consumption of silica sand in the foundry.
- With the growing construction industry, the ceramic industry in the country is expected to grow rapidly. According to the US Department of Commerce and Tile Council of North America (TCNA), total ceramic tile consumption in the United States was 285.4 million square meters in 2022. The volume of domestically produced tile was around 87.3 million square meters in 2022, up 2.3% in 2021.
- Consequently, given the demand and growth across various end-user industries in the country, the silica sand market in the United States is forecasted to witness steady growth in the coming years.
North America Silica Sand Industry Overview
The North America silica sand market is consolidated in nature. The major players (not in any particular order) include Covia Holdings LLC, Hi-Crush Inc., Source Energy Services Ltd., Sil Industrial Minerals, and Athabasca Minerals Inc., among others.
Additional Benefits:
- The market estimate (ME) sheet in Excel format
- 3 months of analyst support
Product Code: 50000792
TABLE OF CONTENTS
1 INTRODUCTION
- 1.1 Study Assumptions
- 1.2 Scope of the Study
2 RESEARCH METHODOLOGY
3 EXECUTIVE SUMMARY
4 MARKET DYNAMICS
- 4.1 Drivers
- 4.1.1 Growing Demand from the Glass Industry
- 4.1.2 Increasing Consumption in the Foundry Industry
- 4.1.3 Other Drivers
- 4.2 Restraints
- 4.2.1 Availability of Substitutes
- 4.2.2 Illegal Mining of Sand
- 4.3 Industry Value Chain Analysis
- 4.4 Porter's Five Forces Analysis
- 4.4.1 Bargaining Power of Suppliers
- 4.4.2 Bargaining power of Buyers
- 4.4.3 Threat of New Entrants
- 4.4.4 Threat of Substitute Products and Services
- 4.4.5 Degree of Competition
5 MARKET SEGMENTATION (Market Size in Volume)
- 5.1 End-User Industry
- 5.1.1 Glass Manufacturing
- 5.1.2 Foundry
- 5.1.3 Chemical Production
- 5.1.4 Construction
- 5.1.5 Paints and Coatings
- 5.1.6 Ceramics and Refractories
- 5.1.7 Filtration
- 5.1.8 Oil and Gas Recovery
- 5.1.9 Other End User Industries (Food Processing, Industrial Abrasives and Sports Fields)
- 5.2 Geography
- 5.2.1 United States
- 5.2.2 Canada
- 5.2.3 Mexico
6 COMPETITIVE LANDSCAPE
- 6.1 Merger & Acquisitions, Joint Ventures, Collaborations, and Agreements
- 6.2 Market Share (%)**/Ranking Analysis
- 6.3 Strategies Adopted by Leading Players
- 6.4 Company Profiles
- 6.4.1 Athabasca Minerals Inc.
- 6.4.2 Atlas Sand Company, LLC
- 6.4.3 Badger Mining Corporation
- 6.4.4 Capital Sand Company
- 6.4.5 Covia Holdings LLC
- 6.4.6 Hi-Crush Inc.
- 6.4.7 Sibelco
- 6.4.8 Signal Peak Silica LLC
- 6.4.9 Sil Industrial Minerals
- 6.4.10 Source Energy Services Ltd.
- 6.4.11 Superior Silica Sands
- 6.4.12 U.S. Silica
7 MARKET OPPORTUNITIES AND FUTURE TRENDS
- 7.1 Future Opportunities in the Water Treatment Industry
- 7.2 Development of Sand-based Treatments in Dentistry and Biotechnology
Have a question?


SELECT AN OPTION
Have a question?
Questions? Please give us a call or visit the contact form.