
Need help finding what you are looking for?
Contact Us
PUBLISHER: Mordor Intelligence | PRODUCT CODE: 1687725

PUBLISHER: Mordor Intelligence | PRODUCT CODE: 1687725
Azotobacter - Market Share Analysis, Industry Trends & Statistics, Growth Forecasts (2025 - 2030)
PUBLISHED:
PAGES: 277 Pages
DELIVERY TIME: 2-3 business days
SELECT AN OPTION
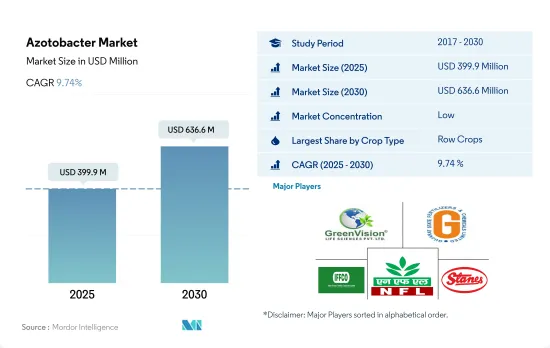
The Azotobacter Market size is estimated at 399.9 million USD in 2025, and is expected to reach 636.6 million USD by 2030, growing at a CAGR of 9.74% during the forecast period (2025-2030).
- Azotobacter refers to free-living bacteria that perform biological nitrogen fixation aerobically or anaerobically without depending on the host plants. Azotobacter biofertilizers accounted for an 11.3% share of the global biofertilizers market in 2022.
- The global area under organic crop cultivation increased by 29.1% during the historical period, rising from 11.1 million hectares in 2017 to 14.4 million hectares in 2022. In 2022, row crops accounted for the largest area under organic cultivation, with a 67.5% share, followed by horticulture crops and cash crops, with shares of 17.5% and 15.1%, respectively.
- Rice, barley, corn, wheat, rapeseed, sunflower, soybean, and other major field crops are grown worldwide. Row crops dominate the global Azotobacter market, accounting for 76.9% of the market in 2022. Azotobacter biofertilizers are useful for non-leguminous crops like paddy, wheat, millet, cotton, tomato, cabbage, mustard, and sunflower.
- The usage of Azotobacter in horticulture crops is increasing as the application of Azotobacter biofertilizer by replacing or in conjunction with various inorganic fertilizers is capable of increasing the fruit yield in various horticultural crops. The increase in yield and fruit set is not only attributed to its nitrogen-fixing ability but also due to Azotobacter's ability to increase the translocation of other nutrients from root to flower via plant foliage.
- Excessive nitrogen fertilizer application has been linked to environmental issues such as eutrophication, the greenhouse effect, and acid rain. Azotobacter biofertilizers can provide plants with the necessary nitrogen without overdosing them. These factors are anticipated to drive the global Azotobacter biofertilizers market to record a CAGR of 9.5% between 2023 and 2029.
- Nitrogen (N) is essential for increasing crop yields and can alter crops' ability to defend against herbivores. N-fertilizer is applied more frequently than required to maximize plant yield and economic profitability. Azotobacter is a viable option for reducing N fertilizer application.
- Asia-Pacific is the largest regional market for Azotobacter biofertilizers, accounting for a value of USD 138.2 million in 2022. China and India are the major country-wise markets in Asia-Pacific, accounting for shares of 99.2% and 0.2%, respectively, in the Azotobacter market. China has the highest nitrogen (N) fertilizer consumption rate in the world. While N fertilizer use has greatly aided China's food production, it has also resulted in unprecedented changes in biogeochemical cycles and endangered terrestrial and aquatic ecosystems. Fertilizer policy reforms in China can help reduce N fertilizer use and the resultant N pollution. Azotobacter biofertilizers also have the potential to reduce the use of synthetic N-based fertilizers.
- In India, under the National Mission on Oilseeds and Oil Palm (NMOOP), financial assistance, including a 50% subsidy to the tune of INR 300/ha, is being given for different components like biofertilizers, supply Rhizobium culture/Phosphate solubilizing bacteria/Zinc solubilizing bacteria/Azatobacter/Mycorrhiza, and vermicompost. These factors are expected to boost the market for Azotobacter biofertilizers between 2023 and 2029.
- North America is the second-largest regional segment of the global Azotobacter market. The United States and Canada dominate the North American market due to their efforts to achieve organic farming.
Global Azotobacter Market Trends
Organic production is at an all-time high in North America and Europe, due to the increasing awareness and Government initiatives.
- Organic agriculture has emerged as a significant contributor to sustainable food systems, with 187 countries practicing it globally. As of 2021, there was 72.3 million ha of organic agricultural land worldwide, with an average increase of 2.9% across all regions from 2018 to 2021. Organic arable land accounted for 14.4 million ha, representing 19.9% of the total organic agricultural land.
- The strongest markets for organic farming are North America and Europe, accounting for 41.0% of the global organic arable land. In 2022, Europe had 6.5 million ha of organic arable land, equivalent to 44.1% of the overall organic arable agricultural area. The most significant crops grown organically in North America and Europe are apples, strawberries, cereals, and olives.
- Developing countries in Asia-Pacific are also joining the organic agriculture movement and becoming self-sufficient in producing and providing fresh organic produce to meet their domestic demand. The trend of organic farming is gaining momentum in Asia-Pacific, with the region recording an 18.8% increase in organic arable land from 2017 to 2022. The major initiatives by governments in the region also play a vital role in the growing trend of organic farming. For example, Japan's Basic Plan for Food, Agriculture, and Rural Areas aims to triple the number of organic farmers and lands by 2030.
- The growth of organic agriculture is driven by the rising awareness of the benefits of organic farming, such as promoting soil health, reducing environmental impacts, and producing healthier food.
Per capita spending of organic food majorly observed in United States and Germany, attributed to the consumer demand for healthier and sustainable food
- The organic food market experienced significant growth in the past few years, with global sales reaching USD 120.6 billion in 2020, up from USD 70.8 billion in 2012. The trend toward organic food is being driven by several factors, such as increasing consumer demand for healthier, more sustainable food options and a growing awareness of the environmental impact of conventional agriculture. The global organic food market is expected to continue its growth trend over the coming years.
- According to a survey conducted by the Organic Trade Association in 2021, sales of organic fruits and vegetables increased by around 4.5% in the same year, accounting for 15% of the overall organic sales. North America dominates the market in terms of average spending on organic products, with per capita spending in the United States reaching USD 186.7 in 2021, the highest among all North American countries. Europe is also expected to experience significant growth in the organic food market, with Germany accounting for the highest per capita spending of USD 75.6 in 2021.
- While the organic food market is still dominated by developed countries with high consumer disposable incomes, it is also expected to grow in developing nations. For example, the increasing number of working-class people in the Asia-Pacific region may contribute to the market's expansion due to the growing availability and affordability of organic food products.
Azotobacter Industry Overview
The Azotobacter Market is fragmented, with the top five companies occupying 14.24%. The major players in this market are Green Vision Life Sciences, Gujarat State Fertilizers & Chemicals Ltd, Indian Farmers Fertiliser Cooperative Limited, National Fertilizers Limited and T.Stanes and Company Limited (sorted alphabetically).
Additional Benefits:
- The market estimate (ME) sheet in Excel format
- 3 months of analyst support
Product Code: 64673
TABLE OF CONTENTS
1 EXECUTIVE SUMMARY & KEY FINDINGS
2 REPORT OFFERS
3 INTRODUCTION
- 3.1 Study Assumptions & Market Definition
- 3.2 Scope of the Study
- 3.3 Research Methodology
4 KEY INDUSTRY TRENDS
- 4.1 Area Under Organic Cultivation
- 4.2 Per Capita Spending On Organic Products
- 4.3 Regulatory Framework
- 4.3.1 Argentina
- 4.3.2 Australia
- 4.3.3 Brazil
- 4.3.4 Canada
- 4.3.5 China
- 4.3.6 Egypt
- 4.3.7 France
- 4.3.8 Germany
- 4.3.9 India
- 4.3.10 Indonesia
- 4.3.11 Italy
- 4.3.12 Japan
- 4.3.13 Mexico
- 4.3.14 Netherlands
- 4.3.15 Nigeria
- 4.3.16 Philippines
- 4.3.17 Russia
- 4.3.18 South Africa
- 4.3.19 Spain
- 4.3.20 Thailand
- 4.3.21 Turkey
- 4.3.22 United Kingdom
- 4.3.23 United States
- 4.3.24 Vietnam
- 4.4 Value Chain & Distribution Channel Analysis
5 MARKET SEGMENTATION (includes market size in Value in USD and Volume, Forecasts up to 2030 and analysis of growth prospects)
- 5.1 Crop Type
- 5.1.1 Cash Crops
- 5.1.2 Horticultural Crops
- 5.1.3 Row Crops
- 5.2 Region
- 5.2.1 Africa
- 5.2.1.1 By Country
- 5.2.1.1.1 Egypt
- 5.2.1.1.2 Nigeria
- 5.2.1.1.3 South Africa
- 5.2.1.1.4 Rest of Africa
- 5.2.2 Asia-Pacific
- 5.2.2.1 By Country
- 5.2.2.1.1 Australia
- 5.2.2.1.2 China
- 5.2.2.1.3 India
- 5.2.2.1.4 Indonesia
- 5.2.2.1.5 Japan
- 5.2.2.1.6 Philippines
- 5.2.2.1.7 Thailand
- 5.2.2.1.8 Vietnam
- 5.2.2.1.9 Rest of Asia-Pacific
- 5.2.3 Europe
- 5.2.3.1 By Country
- 5.2.3.1.1 France
- 5.2.3.1.2 Germany
- 5.2.3.1.3 Italy
- 5.2.3.1.4 Netherlands
- 5.2.3.1.5 Russia
- 5.2.3.1.6 Spain
- 5.2.3.1.7 Turkey
- 5.2.3.1.8 United Kingdom
- 5.2.3.1.9 Rest of Europe
- 5.2.4 Middle East
- 5.2.4.1 By Country
- 5.2.4.1.1 Iran
- 5.2.4.1.2 Saudi Arabia
- 5.2.4.1.3 Rest of Middle East
- 5.2.5 North America
- 5.2.5.1 By Country
- 5.2.5.1.1 Canada
- 5.2.5.1.2 Mexico
- 5.2.5.1.3 United States
- 5.2.5.1.4 Rest of North America
- 5.2.6 South America
- 5.2.6.1 By Country
- 5.2.6.1.1 Argentina
- 5.2.6.1.2 Brazil
- 5.2.6.1.3 Rest of South America
- 5.2.1 Africa
6 COMPETITIVE LANDSCAPE
- 6.1 Key Strategic Moves
- 6.2 Market Share Analysis
- 6.3 Company Landscape
- 6.4 Company Profiles (includes Global Level Overview, Market Level Overview, Core Business Segments, Financials, Headcount, Key Information, Market Rank, Market Share, Products and Services, and Analysis of Recent Developments).
- 6.4.1 Ezzy Bioscience Pvt. Ltd
- 6.4.2 Green Vision Life Sciences
- 6.4.3 Gujarat State Fertilizers & Chemicals Ltd
- 6.4.4 Indian Farmers Fertiliser Cooperative Limited
- 6.4.5 Indogulf BioAg LLC (Biotech Division of Indogulf Company)
- 6.4.6 IPL Biologicals Limited
- 6.4.7 Jaipur Bio Fertilizers
- 6.4.8 National Fertilizers Limited
- 6.4.9 Samriddhi Crops India Pvt. Ltd
- 6.4.10 T.Stanes and Company Limited
7 KEY STRATEGIC QUESTIONS FOR AGRICULTURAL BIOLOGICALS CEOS
8 APPENDIX
- 8.1 Global Overview
- 8.1.1 Overview
- 8.1.2 Porter's Five Forces Framework
- 8.1.3 Global Value Chain Analysis
- 8.1.4 Market Dynamics (DROs)
- 8.2 Sources & References
- 8.3 List of Tables & Figures
- 8.4 Primary Insights
- 8.5 Data Pack
- 8.6 Glossary of Terms
Have a question?


SELECT AN OPTION
Have a question?
Questions? Please give us a call or visit the contact form.