
Need help finding what you are looking for?
Contact Us
PUBLISHER: Mordor Intelligence | PRODUCT CODE: 1690971

PUBLISHER: Mordor Intelligence | PRODUCT CODE: 1690971
United States Pea Protein - Market Share Analysis, Industry Trends & Statistics, Growth Forecasts (2025 - 2030)
PUBLISHED:
PAGES: 219 Pages
DELIVERY TIME: 2-3 business days
SELECT AN OPTION
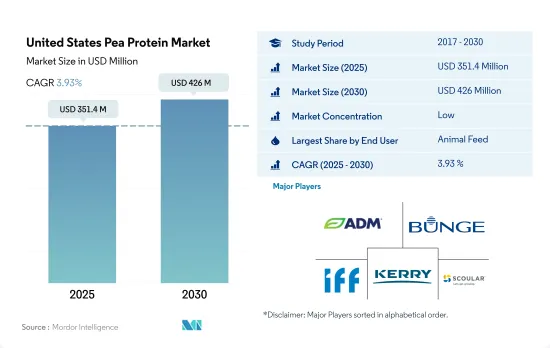
The United States Pea Protein Market size is estimated at 351.4 million USD in 2025, and is expected to reach 426 million USD by 2030, growing at a CAGR of 3.93% during the forecast period (2025-2030).
Manufacturers taking advantage of pea protein's structural functionality in various industries
- After animal feed, F&B remains the second-largest segment, majorly led by the meat alternative industry. The industry alone accounted for over 38.3% of pea protein volume consumed by the F&B sector in 2022. This can be attributed to properties offered by pea protein, including a similar amino acid profile as meat and its hypoallergenic quality that sets it apart and above mainstream sources such as soy. Key formulators like Lightlife Foods and Beyond Meat are increasingly coming up with plant-based meat alternatives, with pea protein being a major ingredient.
- Apart from its numerous functionalities, pea protein does not lose structural functionality under high temperatures, which is the primary factor driving its demand in the F&B segment. The segment also remained the fastest growing, with a projected volume CAGR of 8.56% between 2023 and 2029. The utilization of pea protein is expected to see significant growth in the US snacks market. High-protein, low-fat, and low-carb are the new trending keywords that snack companies look to add to their product characteristics. Some major brands offering snacks with pea protein as an ingredient are Siren Snacks, Larabar, and Simply Protein.
- Another fast-growing sub-segment for pea proteins is the sports and performance nutrition products category, which is projected to register a CAGR of 8.12% from 2023-2029. Some fitness proponents recommend pea protein to increase vegans' and vegetarians' protein consumption. The amino acids in pea proteins can be utilized almost as well as those found in animal proteins. Compared to dairy and soy, peas are less likely to cause allergies, do not worsen lactose intolerance, and, unlike soy, are usually not made from GMO plants.
United States Pea Protein Market Trends
Growth in plant protein consumption provides opportunities for key players in the ingredients market
- The per capita consumption rate of plant proteins is increasing at a considerable rate in the United States, supported by investments and innovations, resulting in a consumption rate of 40.28 grams per day, primarily due to a rising number of consumers turning vegan to promote animal welfare. This is because factory farming, where animals are maltreated, is a norm in the United States. Most Americans eat less meat and animal products, but they do not eliminate their consumption entirely. They also tend to be more flexitarian than vegan or vegetarian. Nearly 12% of consumers in the country prefer a plant-based diet, whereas 7% of consumers follow a flexitarian diet. Although consumers of all generations in the United States are interested in plant-based meals, individuals in their 20s and 30s are the keenest to adopt plant-based diets.
- There is a constant rise in the per capita consumption of pea protein due to its wide applications in different food products, like meat, poultry, and bakery products. Around 41% of consumers are interested in plant-based food derived from pea protein. Pea protein is mainly used in sports nutrition and meat alternatives. A typical serving of pea protein powder is 30 grams, with 25 grams of protein. Athletes usually use one serving per day but may take as many as three servings per day.
- Soy and whey proteins are used primarily in the food and beverage, supplement, and sports nutrition industries. In 2021, around 36% of consumers were familiar with soy protein and had consumed the same, whereas 31% of individuals consumed whey protein in the US. Similarly, the consumption of soy-based food and beverages favorably increased by 12.9% during 2014-2019, and it is likely to remain consistent throughout the forecast period.
The United States is one of the major pea producers globally
- Dry peas are considered the major raw material source for pea protein extraction, and the production data mentioned above is for dry peas only. As most farmers are planting peas to help crop rotation, pea production is flourishing in the country. Many manufacturers have been using pea protein as one of the major ingredients, especially Beyond Meat Inc. and Impossible Burgers. As a result, the production of peas in the United States increased by around 42% from 2017 to 2020. Pea protein can also substitute gluten as a stabilizer in snacks and cereals. After extensive research, pea protein is also entering the gluten-free market, as gluten is believed to cause intestine inflammation in some cases.
- Data shows that growers in the United States are expected to seed about 20% more field peas than in previous years. US farmers also cut acres of principal crops, including corn, soy, and wheat, by about 3%. In 2019, Montana's cultivated dry pea area was estimated at 198,300 ha, up by 44% from the previous year. The cultivated dry pea area in North Dakota was estimated at 163,900 ha, up by 8% from the previous year. In northern Central America, pea crops fall under the yellow (70%) and green (30%) categories, where yellow peas are the most used raw material to produce pea protein.
- According to the USA Dry Pea and Lentil Council, in the United States, some of the growers who had shifted to chickpeas ended up using dry seedling peas instead. Manufacturers in the pea protein market are also more focused on developing new and innovative offerings to fulfill consumers' changing needs and demands by using advanced technologies. As there is a higher level of certain amino acids in peas, it provides an opportunity for the players to tap into the potential posed by innovation.
United States Pea Protein Industry Overview
The United States Pea Protein Market is fragmented, with the top five companies occupying 25.91%. The major players in this market are Archer Daniels Midland Company, Bunge Limited, International Flavors & Fragrances, Inc., Kerry Group PLC and The Scoular Company (sorted alphabetically).
Additional Benefits:
- The market estimate (ME) sheet in Excel format
- 3 months of analyst support
Product Code: 90071
TABLE OF CONTENTS
1 EXECUTIVE SUMMARY & KEY FINDINGS
2 INTRODUCTION
- 2.1 Study Assumptions & Market Definition
- 2.2 Scope of the Study
- 2.3 Research Methodology
3 KEY INDUSTRY TRENDS
- 3.1 End User Market Volume
- 3.1.1 Baby Food and Infant Formula
- 3.1.2 Bakery
- 3.1.3 Beverages
- 3.1.4 Breakfast Cereals
- 3.1.5 Condiments/Sauces
- 3.1.6 Confectionery
- 3.1.7 Dairy and Dairy Alternative Products
- 3.1.8 Elderly Nutrition and Medical Nutrition
- 3.1.9 Meat/Poultry/Seafood and Meat Alternative Products
- 3.1.10 RTE/RTC Food Products
- 3.1.11 Snacks
- 3.1.12 Sport/Performance Nutrition
- 3.1.13 Animal Feed
- 3.1.14 Personal Care and Cosmetics
- 3.2 Protein Consumption Trends
- 3.2.1 Plant
- 3.3 Production Trends
- 3.3.1 Plant
- 3.4 Regulatory Framework
- 3.4.1 United States
- 3.5 Value Chain & Distribution Channel Analysis
4 MARKET SEGMENTATION (includes market size in Value in USD and Volume, Forecasts up to 2030 and analysis of growth prospects)
- 4.1 Form
- 4.1.1 Concentrates
- 4.1.2 Isolates
- 4.1.3 Textured/Hydrolyzed
- 4.2 End User
- 4.2.1 Animal Feed
- 4.2.2 Food and Beverages
- 4.2.2.1 By Sub End User
- 4.2.2.1.1 Bakery
- 4.2.2.1.2 Beverages
- 4.2.2.1.3 Breakfast Cereals
- 4.2.2.1.4 Condiments/Sauces
- 4.2.2.1.5 Confectionery
- 4.2.2.1.6 Dairy and Dairy Alternative Products
- 4.2.2.1.7 Meat/Poultry/Seafood and Meat Alternative Products
- 4.2.2.1.8 RTE/RTC Food Products
- 4.2.2.1.9 Snacks
- 4.2.3 Personal Care and Cosmetics
- 4.2.4 Supplements
- 4.2.4.1 By Sub End User
- 4.2.4.1.1 Baby Food and Infant Formula
- 4.2.4.1.2 Elderly Nutrition and Medical Nutrition
- 4.2.4.1.3 Sport/Performance Nutrition
5 COMPETITIVE LANDSCAPE
- 5.1 Key Strategic Moves
- 5.2 Market Share Analysis
- 5.3 Company Landscape
- 5.4 Company Profiles (includes Global Level Overview, Market Level Overview, Core Business Segments, Financials, Headcount, Key Information, Market Rank, Market Share, Products and Services, and Analysis of Recent Developments).
- 5.4.1 AGT Food and Ingredients Inc.
- 5.4.2 Anchor Ingredients Co. LLC
- 5.4.3 Archer Daniels Midland Company
- 5.4.4 Axiom Foods Inc.
- 5.4.5 Bunge Limited
- 5.4.6 Cargill Incorporated
- 5.4.7 Farbest-Tallman Foods Corporation
- 5.4.8 Glanbia PLC
- 5.4.9 Ingredion Incorporated
- 5.4.10 International Flavors & Fragrances, Inc.
- 5.4.11 Kerry Group PLC
- 5.4.12 Roquette Freres
- 5.4.13 The Scoular Company
6 KEY STRATEGIC QUESTIONS FOR PROTEIN INGREDIENTS INDUSTRY CEOS
7 APPENDIX
- 7.1 Global Overview
- 7.1.1 Overview
- 7.1.2 Porter's Five Forces Framework
- 7.1.3 Global Value Chain Analysis
- 7.1.4 Market Dynamics (DROs)
- 7.2 Sources & References
- 7.3 List of Tables & Figures
- 7.4 Primary Insights
- 7.5 Data Pack
- 7.6 Glossary of Terms
Have a question?


SELECT AN OPTION
Have a question?
Questions? Please give us a call or visit the contact form.