
PUBLISHER: Mordor Intelligence | PRODUCT CODE: 1911338

PUBLISHER: Mordor Intelligence | PRODUCT CODE: 1911338
Automotive Engine Oils - Market Share Analysis, Industry Trends & Statistics, Growth Forecasts (2026 - 2031)
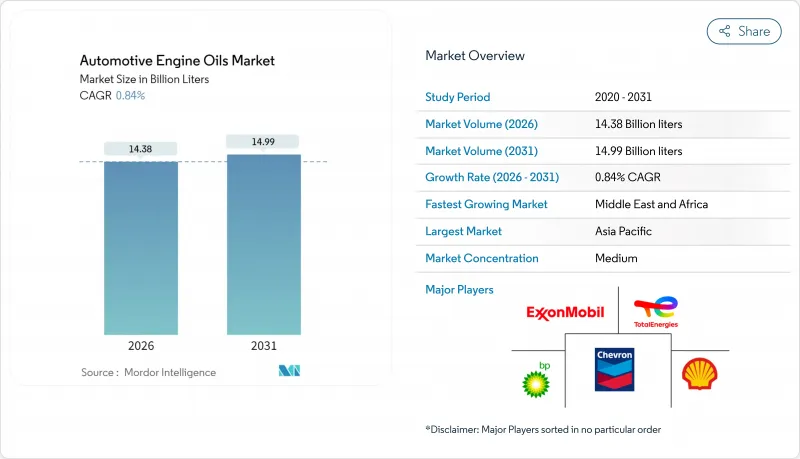
The Global Automotive Engine Oils Market is expected to grow from USD 14.26 billion in 2025 to USD 14.38 billion in 2026 and is forecast to reach USD 14.99 billion by 2031 at 0.84% CAGR over 2026-2031.
Continued enforcement of more stringent emission limits, rapid OEM migration to low-viscosity synthetic grades, and the surging vehicle parc in emerging economies collectively underpin this guarded expansion. Digital retailing, e-maintenance platforms, and long-drain oil specifications have also begun to redefine the revenue mix, encouraging value-added formulations even as mineral-oil dominance persists in cost-sensitive pockets. Meanwhile, counterfeit risks, crude-price volatility, and tightening waste-oil regulations temper near-term margin prospects, prompting greater supply-chain traceability and circular-economy investments.
Global Automotive Engine Oils Market Trends and Insights
Stricter Emission and Fuel-Economy Norms Spurring Low-Viscosity Synthetics
API SQ and ILSAC GF-7 were introduced in March 2025, mandating proven fuel-economy gains that tilt demand toward 0W-20 and 5W-30 synthetic grades. European ACEA 2024 revisions echo these requirements, with OEMs factory-filling lower-viscosity oils to hit Euro 7 and CAFE thresholds. Consumer uptake follows OEM guidance, reinforcing a volume migration from mineral to synthetic products even where sticker prices remain higher.
Digital Quick-Lube and E-Commerce Channels Expanding Reach
By 2024, online platforms handled nearly one-fifth of consumer oil sales in mature markets, while mobile quick-lube apps optimized service cycles through remote diagnostics. FUCHS's Southeast Asia roll-out combines IoT sensors with automated re-ordering for fleets, illustrating how digitalization lowers distributor friction and highlights synthetic oil value propositions.
Counterfeit/Low-Quality Lubricants in Developing Markets
Fake products account for as much as 15% of volume in several emerging countries. Shell deployed blockchain tracking and QR codes to authenticate packs, yet these systems add cost and require retailer education. Premium synthetics face the greatest exposure given their higher ticket value.
Other drivers and restraints analyzed in the detailed report include:
- Emerging-Market Two-Wheeler and Passenger-Car Boom
- OEM Proprietary Long-Drain Specifications Raising Oil Value
- Stricter Used-Oil Disposal and Recycling Regulations
For complete list of drivers and restraints, kindly check the Table Of Contents.
Segment Analysis
Passenger Car Motor Oil delivered 61.85% of the automotive engine oils market share in 2025 as OEM factory fills and quick-lube networks anchored demand. Motorcycle Engine Oil posted the swiftest pace, advancing at a 0.94% CAGR through 2031 amid Asia-Pacific's two-wheeler surge. MCO premiumization is underway, with Japanese and Indian OEMs specifying synthetic blends that tolerate high-RPM heat cycles and extend drains. Manufacturers that manage multi-category portfolios gain procurement scale and channel leverage.
Second-tier Heavy Duty Motor Oil supplies long-haul fleets and remains stable but faces electrification uncertainty. Still, telematics-enabled drain planning and emissions-after-treatment devices sustain lubricant value propositions, particularly in regions where charging infrastructure remains nascent.
The Global Automotive Engine Oils Report is Segmented by Product Type (Passenger Car Motor Oil, Heavy Duty Motor Oil, and Motorcycle Engine Oil), Base Stock (Mineral, Synthetic, Semi-Synthetic, and Bio-Based), and Geography (Asia-Pacific, North America, Europe, South America, and Middle-East and Africa). The Market Forecasts are Provided in Terms of Volume (Litres).
Geography Analysis
Asia-Pacific captured 43.36% of 2025 volume, led by China's 26.1-million-unit vehicle output and India's expanding two-wheeler base. Southeast Asian nations add incremental gains, offsetting moderating Chinese ICE growth as urban EV adoption climbs beyond 35% in top cities.
The Middle East and Africa will grow the fastest at a 2.17% CAGR to 2031. Saudi Vision 2030 infrastructure projects, UAE logistics expansion, and Nigeria's nascent assembly output collectively stimulate lubricant demand across passenger and commercial fleets. Wider GCC specification harmonization eases cross-border product flows, but counterfeit policing and used-oil stewardship lag behind.
North America and Europe are buoyed by a premium mix, and the adoption of low-viscosity synthetics renders them disproportionately profitable. Extended drains, EV e-fluids, and digital service models preview shifts likely to percolate into emerging markets. Regulatory headwinds around waste-oil collection and PFAS content compel research and development redeployments toward more benign chemistries.
- BP p.l.c.
- Chevron Corporation
- China Petroleum Corporation
- CNPC
- ENEOS Corporation
- Exxon Mobil Corporation
- FUCHS
- Gazpromneft - Lubricants Ltd.
- Gulf Oil International Ltd
- Idemitsu Kosan Co., Ltd.
- Indian Oil Corporation Ltd.
- LUKOIL
- Motul
- Repsol
- Saudi Arabian Oil Co.
- Shell plc
- SK ZIC
- TotalEnergies
- Veedol Corporation Limited
Additional Benefits:
- The market estimate (ME) sheet in Excel format
- 3 months of analyst support
TABLE OF CONTENTS
1 Introduction
- 1.1 Study Assumptions and Market Definition
- 1.2 Scope of the Study
2 Research Methodology
3 Executive Summary
4 Market Landscape
- 4.1 Market Overview
- 4.2 Market Drivers
- 4.2.1 Stricter emission and fuel-economy norms spurring low-viscosity synthetics
- 4.2.2 Digital quick-lube and e-commerce channels expanding reach
- 4.2.3 Emerging-market two-wheeler and passenger-car boom
- 4.2.4 OEM proprietary long-drain specifications raising oil value
- 4.2.5 PAO (Polyalphaolefin) and GTL (Gas-to-Liquids) supply expansion lowering synthetic cost
- 4.3 Market Restraints
- 4.3.1 Volatile crude and base-oil prices compressing margins
- 4.3.2 Counterfeit/low-quality lubricants in developing markets
- 4.3.3 Stricter used-oil disposal and recycling regulations
- 4.4 Value Chain and Distribution Channel Analysis
- 4.5 Porter's Five Forces
- 4.5.1 Threat of New Entrants
- 4.5.2 Bargaining Power of Suppliers
- 4.5.3 Bargaining Power of Buyers
- 4.5.4 Threat of Substitutes
- 4.5.5 Industry Rivalry
- 4.6 Regulatory Framework
- 4.7 Automotive Industry Trends
5 Market Size and Growth Forecasts (Volume)
- 5.1 By Product Type
- 5.1.1 Passenger Car Motor Oil (PCMO)
- 5.1.1.1 0W-XX
- 5.1.1.2 5W-XX
- 5.1.1.3 10W-XX
- 5.1.1.4 15W-XX
- 5.1.1.5 Monogrades
- 5.1.1.6 Other Grades
- 5.1.2 Heavy Duty Motor Oil (HDMO)
- 5.1.2.1 0W-XX
- 5.1.2.2 5W-XX
- 5.1.2.3 10W-XX
- 5.1.2.4 15W-XX
- 5.1.2.5 Monogrades
- 5.1.2.6 Other Grades
- 5.1.3 Motorcycle Engine Oil (MCO)
- 5.1.3.1 0W-XX
- 5.1.3.2 5W-XX
- 5.1.3.3 10W-XX
- 5.1.3.4 15W-XX
- 5.1.3.5 Monogrades
- 5.1.3.6 Other Grades
- 5.1.1 Passenger Car Motor Oil (PCMO)
- 5.2 By Base Stock
- 5.2.1 Mineral
- 5.2.2 Synthetic
- 5.2.3 Semi-Synthetic
- 5.2.4 Bio-Based
- 5.3 By Geography
- 5.3.1 Asia-Pacific
- 5.3.1.1 China
- 5.3.1.2 India
- 5.3.1.3 Pakistan
- 5.3.1.4 Bangladesh
- 5.3.1.5 Japan
- 5.3.1.6 South Korea
- 5.3.1.7 Taiwan
- 5.3.1.8 Australia
- 5.3.1.9 Malaysia
- 5.3.1.10 Indonesia
- 5.3.1.11 Thailand
- 5.3.1.12 Vietnam
- 5.3.1.13 Rest of Asia-Pacific
- 5.3.2 North America
- 5.3.2.1 United States
- 5.3.2.2 Canada
- 5.3.2.3 Mexico
- 5.3.3 Europe
- 5.3.3.1 Germany
- 5.3.3.2 United Kingdom
- 5.3.3.3 France
- 5.3.3.4 Italy
- 5.3.3.5 Spain
- 5.3.3.6 Nordic Countries
- 5.3.3.7 Russia
- 5.3.3.8 Rest of Europe
- 5.3.4 South America
- 5.3.4.1 Brazil
- 5.3.4.2 Argentina
- 5.3.4.3 Colombia
- 5.3.4.4 Rest of South America
- 5.3.5 Middle-East and Africa
- 5.3.5.1 Saudi Arabia
- 5.3.5.2 United Arab Emirates
- 5.3.5.3 Qatar
- 5.3.5.4 Iran
- 5.3.5.5 South Africa
- 5.3.5.6 Egypt
- 5.3.5.7 Nigeria
- 5.3.5.8 Rest of Middle-East and Africa
- 5.3.1 Asia-Pacific
6 Competitive Landscape
- 6.1 Market Concentration
- 6.2 Strategic Moves
- 6.3 Market Share (%)/Ranking Analysis
- 6.4 Company Profiles (includes Global level Overview, Market level overview, Core Segments, Financials as available, Production Capacity, Strategic Information, Market Rank/Share for key companies, Products and Services, and Recent Developments)
- 6.4.1 BP p.l.c.
- 6.4.2 Chevron Corporation
- 6.4.3 China Petroleum Corporation
- 6.4.4 CNPC
- 6.4.5 ENEOS Corporation
- 6.4.6 Exxon Mobil Corporation
- 6.4.7 FUCHS
- 6.4.8 Gazpromneft - Lubricants Ltd.
- 6.4.9 Gulf Oil International Ltd
- 6.4.10 Idemitsu Kosan Co., Ltd.
- 6.4.11 Indian Oil Corporation Ltd.
- 6.4.12 LUKOIL
- 6.4.13 Motul
- 6.4.14 Repsol
- 6.4.15 Saudi Arabian Oil Co.
- 6.4.16 Shell plc
- 6.4.17 SK ZIC
- 6.4.18 TotalEnergies
- 6.4.19 Veedol Corporation Limited
7 Market Opportunities and Future Outlook
- 7.1 White-space and Unmet-need Assessment
8 Key Strategic Questions for CEOs

