
Need help finding what you are looking for?
Contact Us
PUBLISHER: Mordor Intelligence | PRODUCT CODE: 1693750

PUBLISHER: Mordor Intelligence | PRODUCT CODE: 1693750
Bioinsecticides - Market Share Analysis, Industry Trends & Statistics, Growth Forecasts (2025 - 2030)
PUBLISHED:
PAGES: 279 Pages
DELIVERY TIME: 2-3 business days
SELECT AN OPTION
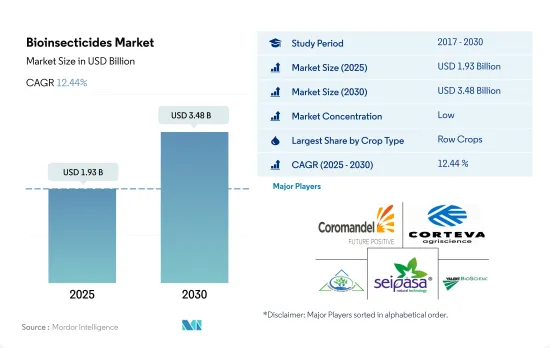
The Bioinsecticides Market size is estimated at 1.93 billion USD in 2025, and is expected to reach 3.48 billion USD by 2030, growing at a CAGR of 12.44% during the forecast period (2025-2030).
- Bioinsecticides are natural substances derived from various sources that effectively control insect pests while being safe for non-target organisms and easily degradable in sewage treatment plants and natural environments. These unique features make bioinsecticides an increasingly popular choice for farmers and consumers.
- The bioinsecticides market is dominated by row crops, which accounted for 84.0% of the global market value in 2022. Major row crops such as barley, corn, wheat, rapeseed, rye, sunflower, soybean, and rice are among the most widely farmed globally. Following closely behind are horticulture crops, which had a market share of 11.8% in 2022.
- North America leads the global bioinsecticides market, accounting for 40.8% of the market share in 2022, followed by Europe and Asia-Pacific, with market shares of 33.2% and 17.5%, respectively. The transition to organic agriculture through agroecological and sustainable agricultural practices gained traction globally, focusing on reducing fertilizers and pesticide consumption, particularly due to the pandemic.
- The Pesticide Action Network (PAN) is a global network of over 600 non-governmental organizations, institutions, and individuals working to promote environmentally sound and socially just alternatives to hazardous pesticides. Through its initiatives and programs, PAN is raising awareness about the negative effects of pesticides and driving the adoption of bioinsecticides as a safer and more sustainable alternative.
- With its unique features and benefits and growing consumer preference for chemical-free produce and organically grown food, bioinsecticides are set to experience growth in the global market, with an estimated CAGR of 12.2% between 2023 and 2029.
- Bioinsecticides are biologically-derived pesticides that use microorganisms such as fungi, bacteria, or even plant extracts to combat pest insects that disrupt crop growth and development. North America, Europe, and Asia-Pacific are dominating the global bioinsecticides market.
- The North American region accounted for 40.8%, by value, of the global bioinsecticides market in 2022. North American countries are establishing certain policies to increase organic farming. For instance, the United States implemented USDA's Organic Transition Initiative and a regional integrated pest management center. Canada implemented a ban on certain pesticides through pest management centers. In Mexico, there is growing opposition to the use of chemical pesticides. All these initiatives are driving the bioinsecticides market in the region.
- Europe is the second-largest market for bioinsecticides. The European Union is promoting organic farming by setting the target of achieving 25% of the region's agricultural land under organic farming by 2030. As part of the strategy, all member countries must reduce their use of chemical pesticides by half by 2030. Therefore all the member countries are implementing individual initiatives and policies, including imposing a high tax on chemical pesticides in Italy.
- Asia-Pacific is the third-largest market for bioinsecticides. China and India hold the major share of the Asia-Pacific bioinsecticides market. China, the world's largest pesticide user, intends to reduce pesticide use by 10% in horticultural crops and 5% in rice, wheat, and corn cultivation by 2025. Pesticide bans worldwide and increased organic farming are expected to drive the global bioinsecticides market during the forecast period.
Global Bioinsecticides Market Trends
Organic production is at an all-time high in North America and Europe, due to the increasing awareness and Government initiatives.
- Organic agriculture has emerged as a significant contributor to sustainable food systems, with 187 countries practicing it globally. As of 2021, there was 72.3 million ha of organic agricultural land worldwide, with an average increase of 2.9% across all regions from 2018 to 2021. Organic arable land accounted for 14.4 million ha, representing 19.9% of the total organic agricultural land.
- The strongest markets for organic farming are North America and Europe, accounting for 41.0% of the global organic arable land. In 2022, Europe had 6.5 million ha of organic arable land, equivalent to 44.1% of the overall organic arable agricultural area. The most significant crops grown organically in North America and Europe are apples, strawberries, cereals, and olives.
- Developing countries in Asia-Pacific are also joining the organic agriculture movement and becoming self-sufficient in producing and providing fresh organic produce to meet their domestic demand. The trend of organic farming is gaining momentum in Asia-Pacific, with the region recording an 18.8% increase in organic arable land from 2017 to 2022. The major initiatives by governments in the region also play a vital role in the growing trend of organic farming. For example, Japan's Basic Plan for Food, Agriculture, and Rural Areas aims to triple the number of organic farmers and lands by 2030.
- The growth of organic agriculture is driven by the rising awareness of the benefits of organic farming, such as promoting soil health, reducing environmental impacts, and producing healthier food.
Per capita spending of organic food majorly observed in United States and Germany, attributed to the consumer demand for healthier and sustainable food
- The organic food market experienced significant growth in the past few years, with global sales reaching USD 120.6 billion in 2020, up from USD 70.8 billion in 2012. The trend toward organic food is being driven by several factors, such as increasing consumer demand for healthier, more sustainable food options and a growing awareness of the environmental impact of conventional agriculture. The global organic food market is expected to continue its growth trend over the coming years.
- According to a survey conducted by the Organic Trade Association in 2021, sales of organic fruits and vegetables increased by around 4.5% in the same year, accounting for 15% of the overall organic sales. North America dominates the market in terms of average spending on organic products, with per capita spending in the United States reaching USD 186.7 in 2021, the highest among all North American countries. Europe is also expected to experience significant growth in the organic food market, with Germany accounting for the highest per capita spending of USD 75.6 in 2021.
- While the organic food market is still dominated by developed countries with high consumer disposable incomes, it is also expected to grow in developing nations. For example, the increasing number of working-class people in the Asia-Pacific region may contribute to the market's expansion due to the growing availability and affordability of organic food products.
Bioinsecticides Industry Overview
The Bioinsecticides Market is fragmented, with the top five companies occupying 1.69%. The major players in this market are Coromandel International Ltd, Corteva Agriscience, IPL Biologicals Limited, Seipasa SA and Valent Biosciences LLC (sorted alphabetically).
Additional Benefits:
- The market estimate (ME) sheet in Excel format
- 3 months of analyst support
Product Code: 500008
TABLE OF CONTENTS
1 EXECUTIVE SUMMARY & KEY FINDINGS
2 REPORT OFFERS
3 INTRODUCTION
- 3.1 Study Assumptions & Market Definition
- 3.2 Scope of the Study
- 3.3 Research Methodology
4 KEY INDUSTRY TRENDS
- 4.1 Area Under Organic Cultivation
- 4.2 Per Capita Spending On Organic Products
- 4.3 Regulatory Framework
- 4.3.1 Argentina
- 4.3.2 Australia
- 4.3.3 Brazil
- 4.3.4 Canada
- 4.3.5 China
- 4.3.6 Egypt
- 4.3.7 France
- 4.3.8 Germany
- 4.3.9 India
- 4.3.10 Indonesia
- 4.3.11 Italy
- 4.3.12 Japan
- 4.3.13 Mexico
- 4.3.14 Netherlands
- 4.3.15 Nigeria
- 4.3.16 Philippines
- 4.3.17 Russia
- 4.3.18 South Africa
- 4.3.19 Spain
- 4.3.20 Thailand
- 4.3.21 Turkey
- 4.3.22 United Kingdom
- 4.3.23 United States
- 4.3.24 Vietnam
- 4.4 Value Chain & Distribution Channel Analysis
5 MARKET SEGMENTATION (includes market size in Value in USD and Volume, Forecasts up to 2030 and analysis of growth prospects)
- 5.1 Crop Type
- 5.1.1 Cash Crops
- 5.1.2 Horticultural Crops
- 5.1.3 Row Crops
- 5.2 Region
- 5.2.1 Africa
- 5.2.1.1 By Country
- 5.2.1.1.1 Egypt
- 5.2.1.1.2 Nigeria
- 5.2.1.1.3 South Africa
- 5.2.1.1.4 Rest of Africa
- 5.2.2 Asia-Pacific
- 5.2.2.1 By Country
- 5.2.2.1.1 Australia
- 5.2.2.1.2 China
- 5.2.2.1.3 India
- 5.2.2.1.4 Indonesia
- 5.2.2.1.5 Japan
- 5.2.2.1.6 Philippines
- 5.2.2.1.7 Thailand
- 5.2.2.1.8 Vietnam
- 5.2.2.1.9 Rest of Asia-Pacific
- 5.2.3 Europe
- 5.2.3.1 By Country
- 5.2.3.1.1 France
- 5.2.3.1.2 Germany
- 5.2.3.1.3 Italy
- 5.2.3.1.4 Netherlands
- 5.2.3.1.5 Russia
- 5.2.3.1.6 Spain
- 5.2.3.1.7 Turkey
- 5.2.3.1.8 United Kingdom
- 5.2.3.1.9 Rest of Europe
- 5.2.4 Middle East
- 5.2.4.1 By Country
- 5.2.4.1.1 Iran
- 5.2.4.1.2 Saudi Arabia
- 5.2.4.1.3 Rest of Middle East
- 5.2.5 North America
- 5.2.5.1 By Country
- 5.2.5.1.1 Canada
- 5.2.5.1.2 Mexico
- 5.2.5.1.3 United States
- 5.2.5.1.4 Rest of North America
- 5.2.6 South America
- 5.2.6.1 By Country
- 5.2.6.1.1 Argentina
- 5.2.6.1.2 Brazil
- 5.2.6.1.3 Rest of South America
- 5.2.1 Africa
6 COMPETITIVE LANDSCAPE
- 6.1 Key Strategic Moves
- 6.2 Market Share Analysis
- 6.3 Company Landscape
- 6.4 Company Profiles (includes Global Level Overview, Market Level Overview, Core Business Segments, Financials, Headcount, Key Information, Market Rank, Market Share, Products and Services, and Analysis of Recent Developments).
- 6.4.1 Andermatt Group AG
- 6.4.2 Certis U.S.A. LLC
- 6.4.3 Coromandel International Ltd
- 6.4.4 Corteva Agriscience
- 6.4.5 IPL Biologicals Limited
- 6.4.6 Jaipur Bio Fertilizers
- 6.4.7 Lallemand Inc.
- 6.4.8 Seipasa SA
- 6.4.9 T.Stanes and Company Limited
- 6.4.10 Valent Biosciences LLC
7 KEY STRATEGIC QUESTIONS FOR AGRICULTURAL BIOLOGICALS CEOS
8 APPENDIX
- 8.1 Global Overview
- 8.1.1 Overview
- 8.1.2 Porter's Five Forces Framework
- 8.1.3 Global Value Chain Analysis
- 8.1.4 Market Dynamics (DROs)
- 8.2 Sources & References
- 8.3 List of Tables & Figures
- 8.4 Primary Insights
- 8.5 Data Pack
- 8.6 Glossary of Terms
Have a question?


SELECT AN OPTION
Have a question?
Questions? Please give us a call or visit the contact form.