
Need help finding what you are looking for?
Contact Us
PUBLISHER: Mordor Intelligence | PRODUCT CODE: 1693769

PUBLISHER: Mordor Intelligence | PRODUCT CODE: 1693769
Asia-Pacific Agricultural Biologicals - Market Share Analysis, Industry Trends & Statistics, Growth Forecasts (2025 - 2030)
PUBLISHED:
PAGES: 262 Pages
DELIVERY TIME: 2-3 business days
SELECT AN OPTION
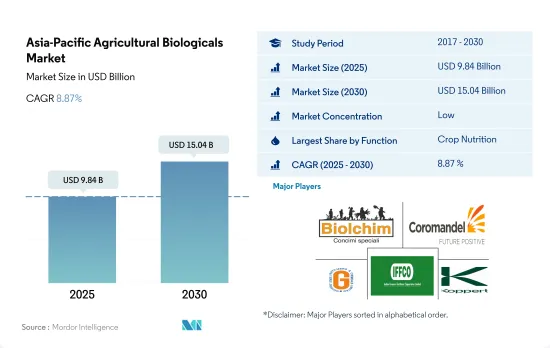
The Asia-Pacific Agricultural Biologicals Market size is estimated at 9.84 billion USD in 2025, and is expected to reach 15.04 billion USD by 2030, growing at a CAGR of 8.87% during the forecast period (2025-2030).
- In the Asia-Pacific region, agricultural biologicals play a key role in sustainable agriculture. These products reduce the use of chemical fertilizers and pesticides by providing required nutrients and controlling pests and insects in crops. The agricultural biologicals market in the region is growing Y-o-Y. From 2017 to 2022, the market value grew by a CAGR of 2.2%.
- The demand for biological solutions in Asia-Pacific is being driven primarily by export markets such as the European Union, which is tightening regulations on the use of some conventional pesticides and local consumer and customer demand for more sustainably grown food. Thus, more growers are showing a growing interest in alternative solutions. The most promising segments are high-value fruits and vegetables (e.g., berries and grapes) eaten fresh and crops grown in greenhouses.
- PAN Asia Pacific (PANAP), one of five regional centers of the Pesticide Action Network, is creating an awareness campaign regarding the harmful effects of pesticides on humans and the environment and promoting biodiversity-based ecological agriculture.
- Countries such as China, India, Australia, and Indonesia are adopting organic farming strategies. China and India are the major countries holding shares of 50.5% and 32.6%, respectively, of the agricultural biologicals market in the region. These countries are implementing different initiatives to encourage organic farming and agricultural biologicals usage widely. For instance, China is planning to reduce 10% and 5% pesticide usage in horticultural crops and row crops, respectively. India, through many initiatives like PKVY and MOVCDNER, provides financial support to farmers to buy agricultural biologicals for organic farming.
- The Asia-Pacific region is one of the world's major organic producers. Rice, sugarcane, and fresh fruits and vegetables are among the major organic crops cultivated in the region. China and India are the region's main organic crop producers and have the highest organic product consumption markets.
- The area of the region that was organically farmed increased significantly between 2017 and 2022, rising from 3.1 million hectares in 2017 to 3.8 million hectares in 2022. The region's biologicals market increased by 10.1% during the historical period and is expected to increase by about 65.1% over the forecast period, reaching USD 13.81 billion by 2029.
- As an individual country, China dominated the Asia-Pacific agricultural biologicals market in 2022 by 50.5% of the market value and 78.6% of the market volume. India occupied second place with 32.6%, and the Rest of Asia-Pacific held 5.9% of the total Asia-Pacific biologicals market values the same year.
- In 2022, row crops in the Asia-Pacific region consumed more biological fertilizers, accounting for 80.1% of the total market value. This is due to the region's huge area under cultivation of field crops, as they are the stable food in many countries in the region. This is followed by cash crops and horticultural crops, which had 10.9% and 8.3% shares, respectively, in the same year.
- The rising trend in organic crop areas and the rising demand for organic products and organic fertilizers reduce overall chemical fertilizer use. The overall cost of crop production and government attempts to encourage organic farming are expected to drive the Asia-Pacific biologicals market between 2023 and 2029.
Asia-Pacific Agricultural Biologicals Market Trends
Growing government support in countries like China, India, Indonesia, and Australia, boosts organic farming in the region
- The area under organic agricultural land in the Asia-Pacific region was over 3.7 million hectares in 2021, representing 26.4% of the global organic area, as per FiBL statistics. Moreover, the organic area under cultivation witnessed a growth of 19.3% between 2017-2022. As of 2020, the region recorded around 1.83 million organic producers, with India topping the list with 1.3 million organic producers. China, India, Indonesia, and Australia are the major countries with large organic cultivation areas in the region. Government authorities in countries such as China and India constantly promote organic agriculture to reduce reliance on chemical inputs for crop cultivation. For instance, India has implemented schemes such as Paramparagat Krishi Vikas Yojana and the All India Network Programme on Organic Farming (AI-NPOF).
- In 2021, China accounted for the maximum share of 66.1% with 2.5 million hectares, followed by India, Indonesia, and Australia with 19.3%, 1.5%, and 1.4% shares, respectively. The crops grown in the total organic land can be divided into three types, namely row crops, horticultural crops, and cash crops. Row crops occupy a major share of organic agricultural land in the region, which accounted for a 67.5% share with 2.5 million hectares in 2021. The major row crops grown in the region include paddy, wheat, pulses, soybeans, and millets.
- Cash crops held the second largest share, with 0.7 million hectares in 2021, accounting for an 18.5% share of organic cropland. The demand for organic cash crops, such as sugar and organic tea, is increasing globally. Globally, China and India are the largest organic green and black tea producers, respectively. The growing international demand is expected to increase the organic acreages in the region.
Per capita spending on organic product predominant in Australia and China's organic food market growing significantly
- Organic products in India represent far less than 1.0% of the global value demand, with a per capita expenditure of just USD 0.08 in 2021. However, with people becoming more aware of the benefits of consuming organic food and the growth in demand for organic products in categories such as tea and organic juice, India represents a potential market over the coming years. It is expected to reach a value of USD 153.3 million by 2025. Currently, the market for organic goods in the region is very fragmented, with just a few supermarkets and specialty stores selling them, as only people from higher-income families are possible customers.
- China continues to show organic growth above the regional and global averages, posting a 13.3% expansion in 2021. A positive growth pattern is expected to continue, with China averaging a CAGR of 7.1% between 2023 and 2029.
- Organic products are anticipated to experience strong growth in China, registering a value CAGR of 7.1% between 2023 and 2029 and reaching a total of USD 6.4 billion by 2025. This growth can be attributed to an increasing emphasis on the importance of organic products among the younger generation, a rise in demand for organic baby food due to the growing number of mothers in the workforce, and the increasing adoption of the health and wellness trend. Growing consumer knowledge and buying motivations are expected to lead to a better understanding of the sustainable qualities of organic food in the region. Increased per capita income, along with increased consumer awareness of the importance of organic food intake, has the potential to raise per capita expenditure on organic food items in the Asia-Pacific region.
Asia-Pacific Agricultural Biologicals Industry Overview
The Asia-Pacific Agricultural Biologicals Market is fragmented, with the top five companies occupying 6.21%. The major players in this market are Biolchim SpA, Coromandel International Ltd, Gujarat State Fertilizers & Chemicals Ltd, Indian Farmers Fertiliser Cooperative Limited and Koppert Biological Systems Inc. (sorted alphabetically).
Additional Benefits:
- The market estimate (ME) sheet in Excel format
- 3 months of analyst support
Product Code: 500029
TABLE OF CONTENTS
1 EXECUTIVE SUMMARY & KEY FINDINGS
2 REPORT OFFERS
3 INTRODUCTION
- 3.1 Study Assumptions & Market Definition
- 3.2 Scope of the Study
- 3.3 Research Methodology
4 KEY INDUSTRY TRENDS
- 4.1 Area Under Organic Cultivation
- 4.2 Per Capita Spending On Organic Products
- 4.3 Regulatory Framework
- 4.3.1 Australia
- 4.3.2 China
- 4.3.3 India
- 4.3.4 Indonesia
- 4.3.5 Japan
- 4.3.6 Philippines
- 4.3.7 Thailand
- 4.3.8 Vietnam
- 4.4 Value Chain & Distribution Channel Analysis
5 MARKET SEGMENTATION (includes market size in Value in USD and Volume, Forecasts up to 2030 and analysis of growth prospects)
- 5.1 Function
- 5.1.1 Crop Nutrition
- 5.1.1.1 Biofertilizer
- 5.1.1.1.1 Azospirillum
- 5.1.1.1.2 Azotobacter
- 5.1.1.1.3 Mycorrhiza
- 5.1.1.1.4 Phosphate Solubilizing Bacteria
- 5.1.1.1.5 Rhizobium
- 5.1.1.1.6 Other Biofertilizers
- 5.1.1.2 Biostimulants
- 5.1.1.2.1 Amino Acids
- 5.1.1.2.2 Fulvic Acid
- 5.1.1.2.3 Humic Acid
- 5.1.1.2.4 Protein Hydrolysates
- 5.1.1.2.5 Seaweed Extracts
- 5.1.1.2.6 Other Biostimulants
- 5.1.1.3 Organic Fertilizer
- 5.1.1.3.1 Manure
- 5.1.1.3.2 Meal Based Fertilizers
- 5.1.1.3.3 Oilcakes
- 5.1.1.3.4 Other Organic Fertilizers
- 5.1.2 Crop Protection
- 5.1.2.1 Biocontrol Agents
- 5.1.2.1.1 Macrobials
- 5.1.2.1.2 Microbials
- 5.1.2.2 Biopesticides
- 5.1.2.2.1 Biofungicides
- 5.1.2.2.2 Bioherbicides
- 5.1.2.2.3 Bioinsecticides
- 5.1.2.2.4 Other Biopesticides
- 5.1.1 Crop Nutrition
- 5.2 Crop Type
- 5.2.1 Cash Crops
- 5.2.2 Horticultural Crops
- 5.2.3 Row Crops
- 5.3 Country
- 5.3.1 Australia
- 5.3.2 China
- 5.3.3 India
- 5.3.4 Indonesia
- 5.3.5 Japan
- 5.3.6 Philippines
- 5.3.7 Thailand
- 5.3.8 Vietnam
- 5.3.9 Rest of Asia-Pacific
6 COMPETITIVE LANDSCAPE
- 6.1 Key Strategic Moves
- 6.2 Market Share Analysis
- 6.3 Company Landscape
- 6.4 Company Profiles (includes Global Level Overview, Market Level Overview, Core Business Segments, Financials, Headcount, Key Information, Market Rank, Market Share, Products and Services, and Analysis of Recent Developments).
- 6.4.1 Biolchim SpA
- 6.4.2 Coromandel International Ltd
- 6.4.3 Genliduo Bio-tech Corporation Ltd
- 6.4.4 Gujarat State Fertilizers & Chemicals Ltd
- 6.4.5 Indian Farmers Fertiliser Cooperative Limited
- 6.4.6 Koppert Biological Systems Inc.
- 6.4.7 Novozymes
- 6.4.8 Sustane Natural Fertilizer Inc.
- 6.4.9 Valagro
- 6.4.10 Valent Biosciences LLC
7 KEY STRATEGIC QUESTIONS FOR AGRICULTURAL BIOLOGICALS CEOS
8 APPENDIX
- 8.1 Global Overview
- 8.1.1 Overview
- 8.1.2 Porter's Five Forces Framework
- 8.1.3 Global Value Chain Analysis
- 8.1.4 Market Dynamics (DROs)
- 8.2 Sources & References
- 8.3 List of Tables & Figures
- 8.4 Primary Insights
- 8.5 Data Pack
- 8.6 Glossary of Terms
Have a question?


SELECT AN OPTION
Have a question?
Questions? Please give us a call or visit the contact form.