
PUBLISHER: Mordor Intelligence | PRODUCT CODE: 1651061

PUBLISHER: Mordor Intelligence | PRODUCT CODE: 1651061
North America Museums, Historical Sites, Zoos, And Parks - Market Share Analysis, Industry Trends & Statistics, Growth Forecasts (2025 - 2030)
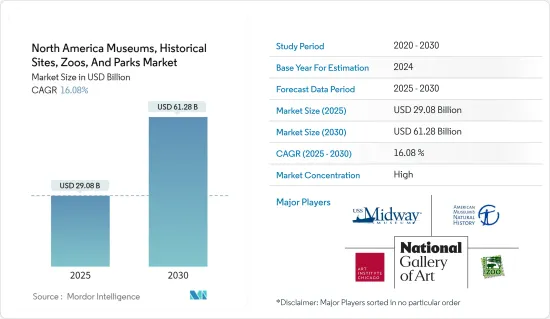
The North America Museums, Historical Sites, Zoos, And Parks Market size is estimated at USD 29.08 billion in 2025, and is expected to reach USD 61.28 billion by 2030, at a CAGR of 16.08% during the forecast period (2025-2030).
The market is set for remarkable growth, driven by various factors such as increasing government support, rising demand for cultural and educational experiences, and technological advancements leading to digitalization efforts within the industry. Moreover, the relaxation of travel restrictions and a growing emphasis on conservation and environmental awareness are expected to further stimulate market expansion. Institutions in this sector are increasingly focusing on enhancing visitor experiences through innovative digital offerings, thereby catering to changing consumer preferences and ensuring sustainability in a rapidly evolving landscape.
Furthermore, strategic partnerships and collaborations between public and private entities present opportunities for synergistic growth and innovation, while evolving societal values towards experiential learning and environmental stewardship create avenues for market differentiation and expansion. Overall, the markett is set to experience significant growth, presenting lucrative opportunities for stakeholders across the region.
North America Museums, Historical Sites, Zoos, And Parks Market Trends
Significance of Historical Sites Nurturing North America's Cultural and Economic Landscape
Historical sites significantly contribute to the growth and enhancement of North American museums, zoos, parks, and the broader cultural sector. These sites serve as vital educational resources, offering interpretive programs, guided tours, and exhibits that delve into their historical significance. By doing so, they foster a deeper understanding of the region's past and its enduring impact on contemporary society.
The North American historical sites sector encompasses a diverse array of attractions, spanning various themes, periods, and geographic locations. In the United States, iconic destinations like Independence Hall in Philadelphia, Colonial Williamsburg in Virginia, and the Alamo in Texas draw millions of annual visitors. These sites offer insights into the nation's founding, colonial history, and cultural heritage. Similarly, Canada boasts notable historical sites like Quebec City's Old Town, the Fortress of Louisbourg in Nova Scotia, and the Canadian Museum of History in Ottawa, each showcasing the country's rich tapestry of history and heritage.
Furthermore, historical sites contribute significantly to local economies. They generate revenue through visitor spending on admissions, tours, souvenirs, and hospitality services. Many historical sites also forge partnerships with government agencies, nonprofits, and private stakeholders. These collaborations bolster efforts in conservation, infrastructure development, and educational initiatives.
US Museums, Historical Sites, Zoos, and Parks Sector, a Pillar of Tourism and Cultural Heritage
In the U.S., museums, historical sites, zoos and parks are a thriving industry that has an important impact on our country's tourism, culture heritage and well being as a whole. These places offer not only recreational activities, but also important learning opportunities for a wide range of visitors.
The U.S. Museum is famous for its extensive collection, top-quality exhibitions, and educational initiatives. In cities such as New York, Washington, D.C., and Los Angeles, they are a major draw, covering a wide range of topics, from art and history to science and technology. U.S. zoos and wildlife parks, known for their focus on animal conservation, education, and entertainment, showcase a wide variety of both exotic and native species. Wildlife parks, in particular, offer immersive encounters in natural habitats, fostering a deeper appreciation for wildlife conservation and environmental stewardship.
With a vast network of national parks, state parks, urban parks, and scenic landscapes, the U.S. offers an abundance of outdoor recreational opportunities. From renowned destinations like Yellowstone and Yosemite National Parks to urban gems like Central Park and Golden Gate Park, these green spaces provide both residents and tourists a chance to reconnect with nature and enjoy outdoor amenities.
North America Museums, Historical Sites, Zoos, And Parks Industry Overview
The market is expected to be concentrated with a large number of players. Some of the major players present in the market are the Smithsonian Institution, Washington, D.C., National Gallery of Art, Washington, D.C., Cincinnati Zoo & Botanical Garden, Art Gallery of Ontario, Museum of Anthropology at UBC, The Montreal Museum of Fine Arts, The American Museum of Natural History, USS Midway Museum, and the Art Institute of Chicago, among others. The market is expected to remain competitive over the forecasted period.
Additional Benefits:
- The market estimate (ME) sheet in Excel format
- 3 months of analyst support
TABLE OF CONTENTS
1 INTRODUCTION
- 1.1 Study Assumptions and Market Definition
- 1.2 Scope of the Study
2 RESEARCH METHODOLOGY
3 EXECUTIVE SUMMARY
4 MARKET DYNAMICS AND INSIGHTS
- 4.1 Market Overview
- 4.2 Market Drivers
- 4.3 Market Restraints
- 4.4 Value Chain Analysis
- 4.5 Industry Attractiveness: Porter's Five Forces Analysis
- 4.5.1 Threat of New Entrants
- 4.5.2 Bargaining Power of Buyers
- 4.5.3 Bargaining Power of Suppliers
- 4.5.4 Threat of Substitutes
- 4.5.5 Intensity of Competitive Rivalry
- 4.6 Insights into Technological Advancements in the Industry
- 4.7 Impact of COVID-19 on the Market
5 MARKET SEGMENTATION
- 5.1 By Type
- 5.1.1 Museums
- 5.1.2 Historical Sites
- 5.1.3 Zoos And Botanical Gardens
- 5.1.4 Nature Parks
- 5.1.5 Other Similar Institutions
- 5.2 By Revenue Source
- 5.2.1 Tickets
- 5.2.2 Food And Beverages
- 5.2.3 Other Revenue Souces
- 5.3 By Geography
- 5.3.1 USA
- 5.3.2 Canada
- 5.3.3 Rest of North America
6 COMPETITIVE LANDSCAPE
- 6.1 Market Concentration Overview
- 6.2 Company Profiles
- 6.2.1 National Gallery of Art, Washington, D.C.
- 6.2.2 Cincinnati Zoo & Botanical Garden
- 6.2.3 Art Institute of Chicago
- 6.2.4 USS Midway Museum
- 6.2.5 The American Museum of Natural History
- 6.2.6 Art Gallery of Ontario
- 6.2.7 Museum of Anthropology at UBC
- 6.2.8 The Montreal Museum of Fine Arts
- 6.2.9 Independence Hall
- 6.2.10 The Statue of Liberty
- 6.2.11 Gettysburg National Battlefield
- 6.2.12 Jamestown Settlement
- 6.2.13 Houston Zoo
- 6.2.14 Yellowstone National Park*
7 MARKET OPPORTUNITIES AND FUTURE TRENDS
8 DISCLAIMER AND ABOUT US

