
Need help finding what you are looking for?
Contact Us
PUBLISHER: Mordor Intelligence | PRODUCT CODE: 1693866

PUBLISHER: Mordor Intelligence | PRODUCT CODE: 1693866
United States Dairy Desserts - Market Share Analysis, Industry Trends & Statistics, Growth Forecasts (2025 - 2030)
PUBLISHED:
PAGES: 162 Pages
DELIVERY TIME: 2-3 business days
SELECT AN OPTION
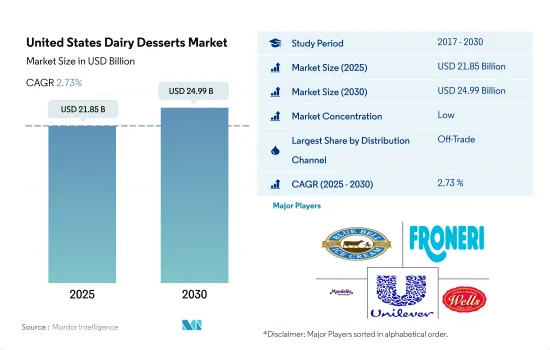
The United States Dairy Desserts Market size is estimated at 21.85 billion USD in 2025, and is expected to reach 24.99 billion USD by 2030, growing at a CAGR of 2.73% during the forecast period (2025-2030).
Strong penetration of organized retail channels fueling the market growth
- The off-trade segment dominates the distribution channels due to the wide accessibility of dairy desserts in these off-trade formats. In the off-trade segment, the online retail channel sub-segment is the fastest-growing one, and it is projected to record a CAGR of 3.01% over the forecast period. The growth of e-commerce has enabled companies to access a larger target market and effectively serve customer needs. Many people started ordering food online, particularly dairy desserts, due to their hectic schedules and the nationwide lockdown in 2020. The four main e-commerce channels for dairy desserts were direct-to-consumer, click-and-collect, retail grocery delivery, and concierge services.
- The sales value of dairy desserts through on-trade channels worldwide declined by 0.15% in 2020 from 2019 as foodservice industries were shut down due to the outbreak, which led to logistic and supply disruption. In 2021, the United States had around 32,027 full-service restaurant franchise establishments. Based on the distribution channel, the overall frozen dairy consumption was around 21.9 pounds per person in 2021. However, people have consumed 5.6 fewer pounds of frozen dairy products per person since 2000.
- Off-trade is projected to be the fastest-growing distribution channel, registering a CAGR of 2.63% during the forecast period. This increase is expected mostly due to the rising demand for dairy desserts, which are widely accessible at supermarkets and online retailers. The omnichannel approach adopted by major retailers worldwide also drives the US dairy desserts market. Retailers such as Costco, Trader Joe's, and Walmart focus on omnichannel shopping, particularly expanding and integrating online capabilities into brick-and-mortar stores.
United States Dairy Desserts Market Trends
The increasing interest on ice cream products to balance their daily energy intake is driving the market
- The per capita consumption of dairy desserts, including ice cream, cheesecakes, and frozen desserts, is increasing yearly in the United States due to their various health benefits, easy availability, and premium ice creams. In 2022, the per capita consumption of dairy desserts increased by 1.2% compared to 2021. Among dairy desserts, consumers majorly consume ice creams in the country. Ice creams are dairy-sourced frozen foods usually consumed as snacks or desserts. Ice cream is considered a good source of calcium and phosphorous, containing 10% daily value per serving. While ice cream is part of a balanced diet, its high palatability increases the likelihood of overconsumption and increased daily energy intake.
- Ice creams with low-calorie (150 calories per serving) or no-sugar options compared to regular ice creams have gained popularity among health-conscious consumers. Due to this, regular ice cream consumption experienced a dip of 9% in 2021, and low-fat ice cream consumption increased by 20%. Given the high demand for ice cream, 9% of all milk produced in the United States is used to make frozen desserts.
- The United States has some strict standards for dairy dessert consumption. Federal regulations or Standards of Identity stipulate that ice creams must contain a minimum of 10% milk fat and 20% total milk solids by weight, and sherbets should have a milk fat content of 1-2% and weigh a minimum of 6 pounds to the gallon. Almost 74% of Americans in the United States eat ice cream at least once a week. Around 84% of Americans purchase ice creams at grocery stores and eat them at home.
United States Dairy Desserts Industry Overview
The United States Dairy Desserts Market is fragmented, with the top five companies occupying 33.95%. The major players in this market are Blue Bell Creameries LP, Froneri International Limited, Mondelez International Inc., Unilever PLC and Wells Enterprises Inc. (sorted alphabetically).
Additional Benefits:
- The market estimate (ME) sheet in Excel format
- 3 months of analyst support
Product Code: 50000724
TABLE OF CONTENTS
1 EXECUTIVE SUMMARY & KEY FINDINGS
2 REPORT OFFERS
3 INTRODUCTION
- 3.1 Study Assumptions & Market Definition
- 3.2 Scope of the Study
- 3.3 Research Methodology
4 KEY INDUSTRY TRENDS
- 4.1 Per Capita Consumption
- 4.2 Raw Material/commodity Production
- 4.2.1 Milk
- 4.3 Regulatory Framework
- 4.3.1 United States
- 4.4 Value Chain & Distribution Channel Analysis
5 MARKET SEGMENTATION (includes market size in Value in USD and Volume, Forecasts up to 2030 and analysis of growth prospects)
- 5.1 Product Type
- 5.1.1 Cheesecakes
- 5.1.2 Frozen Desserts
- 5.1.3 Ice Cream
- 5.1.4 Mousses
- 5.1.5 Others
- 5.2 Distribution Channel
- 5.2.1 Off-Trade
- 5.2.1.1 Convenience Stores
- 5.2.1.2 Online Retail
- 5.2.1.3 Specialist Retailers
- 5.2.1.4 Supermarkets and Hypermarkets
- 5.2.1.5 Others (Warehouse clubs, gas stations, etc.)
- 5.2.2 On-Trade
- 5.2.1 Off-Trade
6 COMPETITIVE LANDSCAPE
- 6.1 Key Strategic Moves
- 6.2 Market Share Analysis
- 6.3 Company Landscape
- 6.4 Company Profiles (includes Global Level Overview, Market Level Overview, Core Business Segments, Financials, Headcount, Key Information, Market Rank, Market Share, Products and Services, and Analysis of Recent Developments).
- 6.4.1 Blue Bell Creameries LP
- 6.4.2 Conagra Brands Inc.
- 6.4.3 Dairy Farmers of America Inc.
- 6.4.4 Froneri International Limited
- 6.4.5 Giffords Dairy Inc.
- 6.4.6 HP Hood LLC
- 6.4.7 Mondelez International Inc.
- 6.4.8 Unilever PLC
- 6.4.9 Wells Enterprises Inc.
7 KEY STRATEGIC QUESTIONS FOR DAIRY AND DAIRY ALTERNATIVE CEOS
8 APPENDIX
- 8.1 Global Overview
- 8.1.1 Overview
- 8.1.2 Porter's Five Forces Framework
- 8.1.3 Global Value Chain Analysis
- 8.1.4 Market Dynamics (DROs)
- 8.2 Sources & References
- 8.3 List of Tables & Figures
- 8.4 Primary Insights
- 8.5 Data Pack
- 8.6 Glossary of Terms
Have a question?


SELECT AN OPTION
Have a question?
Questions? Please give us a call or visit the contact form.