
Need help finding what you are looking for?
Contact Us
PUBLISHER: Mordor Intelligence | PRODUCT CODE: 1693946

PUBLISHER: Mordor Intelligence | PRODUCT CODE: 1693946
Satellite Vessel Tracking - Market Share Analysis, Industry Trends & Statistics, Growth Forecasts (2025 - 2030)
PUBLISHED:
PAGES: 166 Pages
DELIVERY TIME: 2-3 business days
SELECT AN OPTION
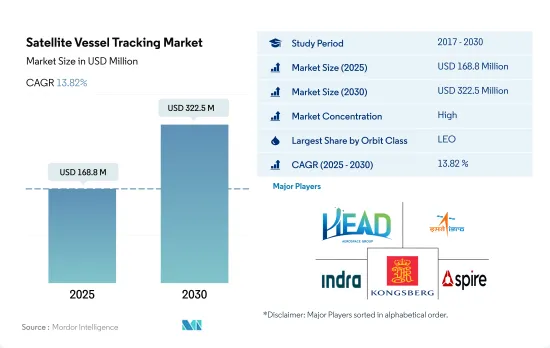
The Satellite Vessel Tracking Market size is estimated at 168.8 million USD in 2025, and is expected to reach 322.5 million USD by 2030, growing at a CAGR of 13.82% during the forecast period (2025-2030).
LEO satellites are expected to lead the segment
- It has been noted that the LEO orbit is widely chosen among the other two orbits because of its proximity to the Earth. Many weather and communication satellites tend to have high Earth orbits farthest from the surface. Satellites in medium Earth orbit include navigational and specialized satellites designed to monitor a specific area. Most vessel tracking satellites and Earth observation satellites are in low Earth orbit.
- Initially, after the introduction of Automatic Identification System (AIS) equipment and its availability, this equipment had a major limitation. The Earth's curvature limits the AIS equipment's horizontal range to about 74 km from shore. However, this information availability challenge has been eliminated with the technological development and introduction of small satellites into low Earth orbit.
- From 2017 to 2022, 115+ satellite vessel tracking satellites manufactured and launched were placed in low Earth orbit because of their added advantages. Various countries across the globe own these satellites for commercial purposes.
- The increasing use of these satellites in areas such as tracking ships to prevent pollution, identifying the movement of dangerous goods, and maritime surveillance is expected to drive the demand for the development of satellites during the forecast period.
Global Satellite Vessel Tracking Market Trends
Global rising demand expected for satellite miniaturization
- The ability of the small satellite to perform nearly all of the functions of a traditional satellite at a fraction of the cost of a traditional satellite has increased the viability of building, launching, and operating small satellite constellations. The demand from North America is primarily driven by the United States, which manufactures the largest number of small satellites annually. In North America, during 2017-2022, a total of 596 nanosatellites were placed into orbit by various players in the region. Currently, NASA is involved in several projects aimed at developing these satellites.
- The demand from Europe is primarily driven by Germany, France, Russia, and the United Kingdom, which manufacture the largest number of small satellites annually. During 2017-2022, more than 50 nano and microsatellites were placed into orbit by various players in the region. The miniaturization and commercialization of electronic components and systems have driven market participation, resulting in the emergence of new market players who aim to capitalize on and enhance the current market scenario. For instance, a UK-based startup, Open Cosmos, partnered with ESA to provide commercial nanosatellite launch services to end users while ensuring competitive cost savings of around 90%.
- The demand from Asia-Pacific is primarily driven by China, Japan, and India, which manufacture the largest number of small satellites annually. During 2017-2022, more than 190 nano and microsatellites were placed into orbit by various players in the region. China is investing significant resources toward augmenting its space-based capabilities. The country has launched the most significant number of nano and microsatellites in Asia-Pacific to date.
Increasing investment opportunities in the market
- Global government expenditure for space programs in North America hit approximately 103 billion in 2021. The region is the epicenter of space innovation and research, with the presence of the world's biggest space agency, NASA. In 2022, the US government spent nearly USD 62 billion on its space programs, making it the highest spender on space in the world. In the United States, federal agencies receive annual funding from Congress, which is USD 32.33 billion for its subsidiaries.
- Additionally, countries in Europe are recognizing the importance of various investments in the space domain. They are increasing their spending on space activities and innovation to stay competitive and innovative in the global space industry. On this note, in November 2022, ESA announced that it had proposed a 25% boost in space funding over the next three years designed to maintain Europe's lead in Earth observation, expand navigation services, and remain a partner in exploration with the United States. The European Space Agency (ESA) asks its 22 nations to back a budget of EUR 18.5 billion from 2023 to 2025. Germany, France, and Italy are the major contributors.
- Considering the increase in space-related activities in the Asia-Pacific region, in 2022, according to the draft budget of Japan, the space budget of the country was over USD 1.4 billion, which included the development of the H3 rocket, Engineering Test Satellite-9, and the nation's Information Gathering Satellite (IGS) program. Similarly, the proposed budget for India's space programs for FY 2022 was USD 1.83 billion. And in 2022, South Korea's Ministry of Science and ICT announced a space budget of USD 619 million for manufacturing satellites, rockets, and other key space equipment.
Satellite Vessel Tracking Industry Overview
The Satellite Vessel Tracking Market is fairly consolidated, with the top five companies occupying 142.05%. The major players in this market are HEAD Aerospace, Indian Space Research Organisation (ISRO), Indra Systemmas, Kongsberg and Spire Global, Inc. (sorted alphabetically).
Additional Benefits:
- The market estimate (ME) sheet in Excel format
- 3 months of analyst support
Product Code: 50001259
TABLE OF CONTENTS
1 EXECUTIVE SUMMARY & KEY FINDINGS
2 REPORT OFFERS
3 INTRODUCTION
- 3.1 Study Assumptions & Market Definition
- 3.2 Scope of the Study
- 3.3 Research Methodology
4 KEY INDUSTRY TRENDS
- 4.1 Satellite Mass
- 4.2 Satellite Miniaturization
- 4.3 Spending On Space Programs
- 4.4 Regulatory Framework
- 4.4.1 Global
- 4.4.2 Australia
- 4.4.3 Brazil
- 4.4.4 Canada
- 4.4.5 China
- 4.4.6 France
- 4.4.7 Germany
- 4.4.8 India
- 4.4.9 Iran
- 4.4.10 Japan
- 4.4.11 New Zealand
- 4.4.12 Russia
- 4.4.13 Singapore
- 4.4.14 South Korea
- 4.4.15 United Arab Emirates
- 4.4.16 United Kingdom
- 4.4.17 United States
- 4.5 Value Chain & Distribution Channel Analysis
5 MARKET SEGMENTATION (includes market size in Value in USD, Forecasts up to 2030 and analysis of growth prospects)
- 5.1 Satellite Mass
- 5.1.1 10-100kg
- 5.1.2 100-500kg
- 5.1.3 Below 10 Kg
- 5.2 Orbit Class
- 5.2.1 GEO
- 5.2.2 LEO
- 5.3 Satellite Subsystem
- 5.3.1 Propulsion Hardware and Propellant
- 5.3.2 Satellite Bus & Subsystems
- 5.3.3 Solar Array & Power Hardware
- 5.3.4 Structures, Harness & Mechanisms
- 5.4 End User
- 5.4.1 Commercial
- 5.4.2 Military & Government
- 5.4.3 Other
6 COMPETITIVE LANDSCAPE
- 6.1 Key Strategic Moves
- 6.2 Market Share Analysis
- 6.3 Company Landscape
- 6.4 Company Profiles (includes Global Level Overview, Market Level Overview, Core Business Segments, Financials, Headcount, Key Information, Market Rank, Market Share, Products and Services, and Analysis of Recent Developments).
- 6.4.1 Hawkeye360
- 6.4.2 HEAD Aerospace
- 6.4.3 Indian Space Research Organisation (ISRO)
- 6.4.4 Indra Systemmas
- 6.4.5 Kleos Space
- 6.4.6 Kongsberg
- 6.4.7 Spire Global, Inc.
- 6.4.8 Terma
- 6.4.9 Unseenlabs
7 KEY STRATEGIC QUESTIONS FOR SATELLITE CEOS
8 APPENDIX
- 8.1 Global Overview
- 8.1.1 Overview
- 8.1.2 Porter's Five Forces Framework
- 8.1.3 Global Value Chain Analysis
- 8.1.4 Market Dynamics (DROs)
- 8.2 Sources & References
- 8.3 List of Tables & Figures
- 8.4 Primary Insights
- 8.5 Data Pack
- 8.6 Glossary of Terms
Have a question?


SELECT AN OPTION
Have a question?
Questions? Please give us a call or visit the contact form.