
Need help finding what you are looking for?
Contact Us
PUBLISHER: Mordor Intelligence | PRODUCT CODE: 1693949

PUBLISHER: Mordor Intelligence | PRODUCT CODE: 1693949
North America Remote Sensing Satellites - Market Share Analysis, Industry Trends & Statistics, Growth Forecasts (2025 - 2030)
PUBLISHED:
PAGES: 166 Pages
DELIVERY TIME: 2-3 business days
SELECT AN OPTION
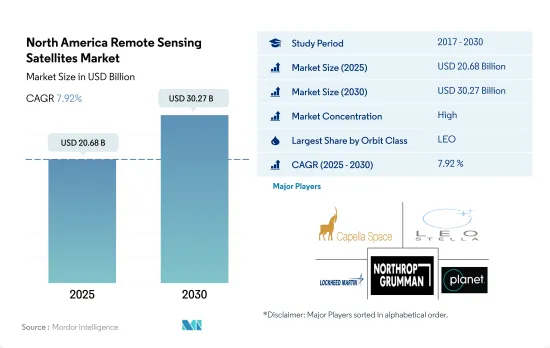
The North America Remote Sensing Satellites Market size is estimated at 20.68 billion USD in 2025, and is expected to reach 30.27 billion USD by 2030, growing at a CAGR of 7.92% during the forecast period (2025-2030).
The demand for LEO satellites is driving the segment's growth
- At launch, a satellite or spacecraft is usually placed into one of many special orbits around Earth, or it can be launched into an interplanetary journey. Satellites orbit the Earth at varying distances depending on their design and primary purpose. Each orbit has its own benefits and challenges, including increased coverage and decreased energy efficiency. Satellites in medium Earth orbit include navigational and specialized satellites designed to monitor a specific area. Most science satellites, including NASA's Earth Observing System, are in low Earth orbit.
- The different satellites manufactured and launched in this region have various applications. For instance, during 2017-2022, out of the seven satellites launched in MEO, most were built for navigation/global positioning purposes. Similarly, among the 32 satellites launched into GEO, most were deployed for communication and Earth observation purposes. Around 3000+ LEO satellites manufactured and launched were owned by North American organizations.
- The growing use of remote sensing satellites in areas such as electronic intelligence, Earth science/meteorology, laser imaging, optical imaging, and meteorology is expected to drive market demand during the forecast period. The market is expected to surge by 68% during the forecast period.
North America Remote Sensing Satellites Market Trends
The global demand for satellite miniaturization is rising
- The ability of small satellites to perform nearly all the functions of a traditional satellite at a fraction of its cost has increased the viability of building, launching, and operating small satellite constellations. Small satellites are increasingly preferred for scientific research, military, and defense sectors over commercial applications. During 2017-2022, a total of 596 nanosatellites were placed in orbit by various players in the region.
- The demand from North America is primarily driven by the United States, which manufactures the largest number of small satellites each year. Though the launches from the country have decreased over the last three years, there is huge potential in the country's industry, and the ongoing investments in the startups and the nano and microsatellite development projects are expected to boost the region's revenue growth.
- NASA supports nano and microsatellite developers under several support initiatives. For instance, under the CubeSat Launch initiative (CSLI), NASA provides access to space for small satellites and CubeSats developed by NASA centers and programs, educational institutions, and non-profit organizations. This provides CubeSat developers access to a low-cost pathway to conduct research in the areas of science, exploration, technology development, education, and operations. The Canadian government is emphasizing the development of necessary skill sets for nanosatellite development at the university level. For instance, Wyvern, a Canadian startup, aims at providing relatively low-cost access to hyperspectral imaging taken from low Earth orbit with the help of CubeSats.
Investment opportunities are increasing in the market
- In North America, government expenditure for space programs reached approximately USD 103 billion in 2021. The region is the epicenter of space innovation and research, with the presence of the world's biggest space agency, NASA. In 2022, the US government spent nearly USD 62 billion on its space programs, making it the highest spender on space programs in the world. In terms of research and investment grants, the region's governments and the private sector have dedicated funds for research and innovation in the space sector. Agencies spend available budgetary resources by making financial promises called obligations. For instance, till February 2023, NASA provided USD 333 million as research grants.
- According to the Canadian government, the Canadian space sector employs 10,000 people and adds around USD 2.3 billion to the Canadian GDP. The government reported that 90% of Canadian space firms are small and medium-sized businesses. The Canadian Space Agency (CSA) budget is modest, and the estimated budgetary spending for 2022-23 was USD 329 million. The Canadian government envisions ensuring the total coverage of high-speed internet throughout the country by 2030.
- In July 2019, the Canadian government announced an investment of USD 64.7 million in Telesat to provide better broadband internet access to rural and remote communities. Telesat aimed to utilize its financial aid to build and test technologies that use LEO satellites to boost connectivity. The MoU stated a potential investment of CAD 600 million for gaining privileged access to the satellite network and helping deliver affordable high-speed internet services worth CAD 1.2 billion by 2029.
North America Remote Sensing Satellites Industry Overview
The North America Remote Sensing Satellites Market is fairly consolidated, with the top five companies occupying 99.31%. The major players in this market are Capella Space Corp., LeoStella, Lockheed Martin Corporation, Northrop Grumman Corporation and Planet Labs Inc. (sorted alphabetically).
Additional Benefits:
- The market estimate (ME) sheet in Excel format
- 3 months of analyst support
Product Code: 50001262
TABLE OF CONTENTS
1 EXECUTIVE SUMMARY & KEY FINDINGS
2 REPORT OFFERS
3 INTRODUCTION
- 3.1 Study Assumptions & Market Definition
- 3.2 Scope of the Study
- 3.3 Research Methodology
4 KEY INDUSTRY TRENDS
- 4.1 Satellite Mass
- 4.2 Satellite Miniaturization
- 4.3 Spending On Space Programs
- 4.4 Regulatory Framework
- 4.4.1 Canada
- 4.4.2 United States
- 4.5 Value Chain & Distribution Channel Analysis
5 MARKET SEGMENTATION (includes market size in Value in USD, Forecasts up to 2030 and analysis of growth prospects)
- 5.1 Satellite Mass
- 5.1.1 10-100kg
- 5.1.2 100-500kg
- 5.1.3 500-1000kg
- 5.1.4 Below 10 Kg
- 5.1.5 above 1000kg
- 5.2 Orbit Class
- 5.2.1 GEO
- 5.2.2 LEO
- 5.2.3 MEO
- 5.3 Satellite Subsystem
- 5.3.1 Propulsion Hardware and Propellant
- 5.3.2 Satellite Bus & Subsystems
- 5.3.3 Solar Array & Power Hardware
- 5.3.4 Structures, Harness & Mechanisms
- 5.4 End User
- 5.4.1 Commercial
- 5.4.2 Military & Government
- 5.4.3 Other
6 COMPETITIVE LANDSCAPE
- 6.1 Key Strategic Moves
- 6.2 Market Share Analysis
- 6.3 Company Landscape
- 6.4 Company Profiles (includes Global Level Overview, Market Level Overview, Core Business Segments, Financials, Headcount, Key Information, Market Rank, Market Share, Products and Services, and Analysis of Recent Developments).
- 6.4.1 Ball Corporation
- 6.4.2 Capella Space Corp.
- 6.4.3 Esri
- 6.4.4 GomSpaceApS
- 6.4.5 IHI Corp
- 6.4.6 ImageSat International
- 6.4.7 LeoStella
- 6.4.8 Lockheed Martin Corporation
- 6.4.9 Maxar Technologies Inc.
- 6.4.10 Northrop Grumman Corporation
- 6.4.11 Planet Labs Inc.
- 6.4.12 Spire Global, Inc.
- 6.4.13 Thales
7 KEY STRATEGIC QUESTIONS FOR SATELLITE CEOS
8 APPENDIX
- 8.1 Global Overview
- 8.1.1 Overview
- 8.1.2 Porter's Five Forces Framework
- 8.1.3 Global Value Chain Analysis
- 8.1.4 Market Dynamics (DROs)
- 8.2 Sources & References
- 8.3 List of Tables & Figures
- 8.4 Primary Insights
- 8.5 Data Pack
- 8.6 Glossary of Terms
Have a question?


SELECT AN OPTION
Have a question?
Questions? Please give us a call or visit the contact form.