
Need help finding what you are looking for?
Contact Us
PUBLISHER: Mordor Intelligence | PRODUCT CODE: 1693954

PUBLISHER: Mordor Intelligence | PRODUCT CODE: 1693954
North America Satellite Manufacturing - Market Share Analysis, Industry Trends & Statistics, Growth Forecasts (2025 - 2030)
PUBLISHED:
PAGES: 188 Pages
DELIVERY TIME: 2-3 business days
SELECT AN OPTION
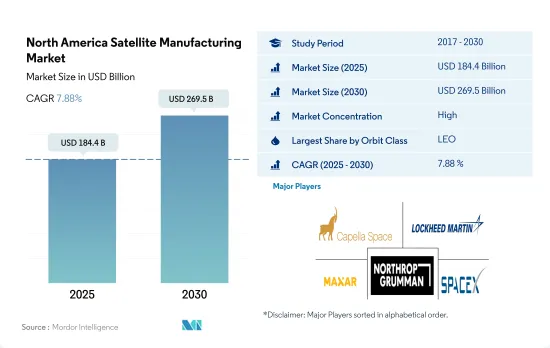
The North America Satellite Manufacturing Market size is estimated at 184.4 billion USD in 2025, and is expected to reach 269.5 billion USD by 2030, growing at a CAGR of 7.88% during the forecast period (2025-2030).
LEO satellites are driving demand in the North America satellite manufacturing market
- During launch, a satellite or spacecraft is usually placed into one of many special orbits around the Earth, or it can be launched into an interplanetary journey. There are three types of Earth orbit: geostationary orbit (GEO), medium Earth orbit (MEO), and low Earth orbit (LEO). Many weather and communication satellites tend to have high Earth orbits farther from the surface. Satellites in medium Earth orbit include navigational and specialized satellites designed to monitor a specific area. Most science satellites, including NASA's Earth Observation System, are in low Earth orbit.
- Different satellites manufactured and launched in this region have different applications. For instance, during 2017-2022, out of the seven satellites launched in the MEO orbit, most were built for navigation/global positioning purposes. Similarly, out of the 32 satellites in the GEO orbit, most were deployed for communication and Earth observation purposes. Around 3,000+ LEO satellites owned by North American organizations were launched during this period.
- The growing use of satellites in areas such as electronic intelligence, Earth science/meteorology, laser imaging, and optical imaging is expected to drive the North American satellite manufacturing market during the forecast period. By orbit class, the market is expected to register a CAGR of 68% during the forecast period, and LEO satellites are expected to dominate the market.
The increased importance of satellite miniaturization has aided growth in the region
- The North American satellite manufacturing market is characterized by the presence of several players. However, the market is dominated by only a few players because of their wide range of product offerings. Private companies like SpaceX, Blue Origin, and Boeing are investing heavily in space technology and driving innovation in the industry. Space organizations like NASA have partnered with private players like SpaceX in the production and launch of satellites in the region.
- In addition, the satellite manufacturing industry is driven by demand for satellites for applications ranging from military surveillance, communications, and navigation to Earth observation. As a result, the demand for satellites from the civilian/government, commercial, and military sectors is increasing. During 2017-2022, 4,351 satellites were launched in the region. The number of satellites launched from 2021 to 2022 grew by 61%, while it grew by 40% from 2020 to 2021.
- In terms of the number of satellites operated by a country, the United States is the leading country, with over 2900+ satellites launched during 2017-2022, followed by Canada and Mexico. Major technological changes, such as miniaturization and the introduction of reusable satellite launch systems, are expected to open new opportunities in the North American satellite manufacturing market during the forecast period. The market is expected to surge by 68% in the forecast period, and the United States is anticipated to dominate the market.
North America Satellite Manufacturing Market Trends
Rising Demand for Satellite Miniaturization in North America
- The ability of small satellites to perform nearly all of the functions of traditional satellites at a fraction of their cost has increased the viability of building, launching, and operating small satellite constellations. Small satellites are being preferred for scientific research and military and defense sector applications. Small satellites typically have shorter development cycles, and smaller development teams can be produced on the same production line and are cheaper to launch into orbit. Revolutionary technological advancements facilitated the miniaturization of electronics, reducing the satellite bus size and mass over time for manufacturers. During the historical period, a total of 580 nanosatellites were placed into orbit by various players in the region.
- The demand from North America is primarily driven by the United States, which manufactures the largest number of small satellites each year. The country's launches have increased over the last three years, which shows the country's huge potential. In addition, the ongoing investments in startups and the nano and microsatellite development projects are expected to boost growth in the region.
- Currently, NASA is involved in several projects aimed at developing these satellites. NASA is making use of CubeSats for conducting advanced exploration, demonstrating newly emerging technologies for conducting scientific research and educational investigations. The Canadian government is emphasizing the development of necessary skill sets for nanosatellite development at the university level. For instance, Wyvern, a Canadian startup, aims at providing relatively low-cost access to hyperspectral imaging taken from a low Earth orbit with the help of CubeSats.
Investment Opportunities in the North American Satellite Manufacturing Market
- In North America, government expenditure for space programs hit a record of approximately USD 24.8 billion in 2022. The region is the epicentre of space innovation and research, with the presence of the world's biggest space agency, NASA. In 2022, the US government spent nearly USD 62 billion on its space programs, making it the highest spender on space in the world. In the United States, federal agencies receive funding from Congress every year worth USD 32.33 billion for their subsidiaries.
- In January 2023, according to the Canadian government, the Canadian space sector added USD 2.3 billion to the Canadian GDP and employed 10,000 people. The government reported that 90% of Canadian space firms are small- and medium-sized businesses. The Canadian Space Agency (CSA) budget is modest, and the estimated budgetary spending for 2022-23 was USD 329 million.
- Space agencies spend available budgetary resources by making financial promises called obligations. For instance, until February 2023, the National Aeronautics and Space Administration (NASA) distributed USD 333 million as research grants. The Canadian Space Agency (CSA) announced an opportunity for the Canadian space science community to advance its knowledge of space in atmospheric and Earth-system science, lunar gateway/Artemis technology application, planetary exploration, space astronomy, and solar-terrestrial science. In April 2022, three grants totalling USD 132,831 thousand were awarded to Canadian universities to support projects that use data collected by AstroSat to understand better how stars are formed.
North America Satellite Manufacturing Industry Overview
The North America Satellite Manufacturing Market is fairly consolidated, with the top five companies occupying 98.41%. The major players in this market are Capella Space Corp., Lockheed Martin Corporation, Maxar Technologies Inc., Northrop Grumman Corporation and Space Exploration Technologies Corp. (sorted alphabetically).
Additional Benefits:
- The market estimate (ME) sheet in Excel format
- 3 months of analyst support
Product Code: 50001279
TABLE OF CONTENTS
1 EXECUTIVE SUMMARY & KEY FINDINGS
2 REPORT OFFERS
3 INTRODUCTION
- 3.1 Study Assumptions & Market Definition
- 3.2 Scope of the Study
- 3.3 Research Methodology
4 KEY INDUSTRY TRENDS
- 4.1 Satellite Miniaturization
- 4.2 Satellite Mass
- 4.3 Spending On Space Programs
- 4.4 Regulatory Framework
- 4.4.1 Canada
- 4.4.2 United States
- 4.5 Value Chain & Distribution Channel Analysis
5 MARKET SEGMENTATION (includes market size in Value in USD, Forecasts up to 2030 and analysis of growth prospects)
- 5.1 Application
- 5.1.1 Communication
- 5.1.2 Earth Observation
- 5.1.3 Navigation
- 5.1.4 Space Observation
- 5.1.5 Others
- 5.2 Satellite Mass
- 5.2.1 10-100kg
- 5.2.2 100-500kg
- 5.2.3 500-1000kg
- 5.2.4 Below 10 Kg
- 5.2.5 above 1000kg
- 5.3 Orbit Class
- 5.3.1 GEO
- 5.3.2 LEO
- 5.3.3 MEO
- 5.4 End User
- 5.4.1 Commercial
- 5.4.2 Military & Government
- 5.4.3 Other
- 5.5 Satellite Subsystem
- 5.5.1 Propulsion Hardware and Propellant
- 5.5.2 Satellite Bus & Subsystems
- 5.5.3 Solar Array & Power Hardware
- 5.5.4 Structures, Harness & Mechanisms
- 5.6 Propulsion Tech
- 5.6.1 Electric
- 5.6.2 Gas based
- 5.6.3 Liquid Fuel
- 5.7 Country
- 5.7.1 Canada
- 5.7.2 United States
6 COMPETITIVE LANDSCAPE
- 6.1 Key Strategic Moves
- 6.2 Market Share Analysis
- 6.3 Company Landscape
- 6.4 Company Profiles (includes Global Level Overview, Market Level Overview, Core Business Segments, Financials, Headcount, Key Information, Market Rank, Market Share, Products and Services, and Analysis of Recent Developments).
- 6.4.1 Capella Space Corp.
- 6.4.2 Lockheed Martin Corporation
- 6.4.3 Maxar Technologies Inc.
- 6.4.4 Northrop Grumman Corporation
- 6.4.5 Planet Labs Inc.
- 6.4.6 Space Exploration Technologies Corp.
- 6.4.7 Spire Global, Inc.
- 6.4.8 Swarm Technologies, Inc.
- 6.4.9 Thales
7 KEY STRATEGIC QUESTIONS FOR SATELLITE CEOS
8 APPENDIX
- 8.1 Global Overview
- 8.1.1 Overview
- 8.1.2 Porter's Five Forces Framework
- 8.1.3 Global Value Chain Analysis
- 8.1.4 Market Dynamics (DROs)
- 8.2 Sources & References
- 8.3 List of Tables & Figures
- 8.4 Primary Insights
- 8.5 Data Pack
- 8.6 Glossary of Terms
Have a question?


SELECT AN OPTION
Have a question?
Questions? Please give us a call or visit the contact form.