
PUBLISHER: Mordor Intelligence | PRODUCT CODE: 1851174

PUBLISHER: Mordor Intelligence | PRODUCT CODE: 1851174
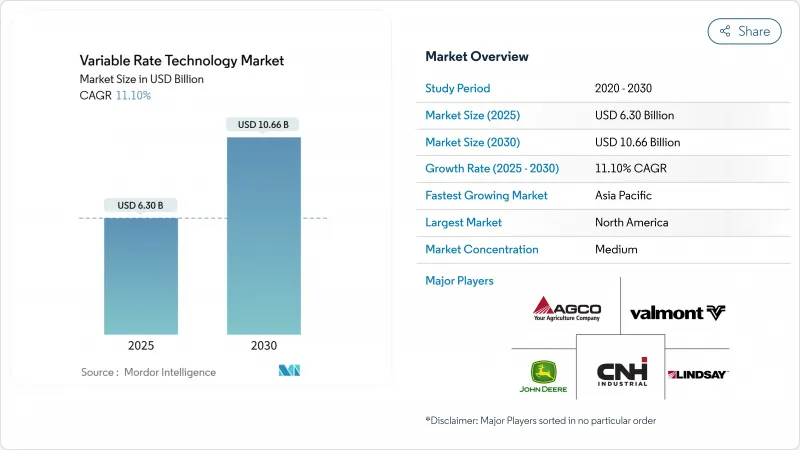
Variable Rate Technology - Market Share Analysis, Industry Trends & Statistics, Growth Forecasts (2025 - 2030)
The Variable Rate Technology Market size is estimated at USD 6.30 billion in 2025 and is projected to reach USD 10.66 billion by 2030, at a CAGR of 11.10% during the forecast period.
Rising pressure to produce more food with fewer resources, combined with regulatory scrutiny over fertilizer and pesticide use, positions the variable rate technology market as a pivotal enabler of precision input management. Wider farm digitalization, embedded on-equipment AI, and favorable subsidy programs strengthen technology appeal, while consolidation among equipment makers accelerates platform innovation. North America remains the revenue anchor, yet Asia-Pacific contributes the most incremental growth as modernization schemes expand. Hardware sales still dominate value creation, but service-centric business models scale quickly, signaling an industry shift toward outcome-based offerings.
Global Variable Rate Technology Market Trends and Insights
Rapid Digitalization of Farms
Sixty-one percent of United States farms already rely on precision hardware that feeds real-time agronomic data into cloud platforms. Equipment makers allocate multibillion-dollar budgets to autonomous solutions that lower labor needs and refine application accuracy, illustrated by John Deere's decade-long USD 20 billion domestic manufacturing plan. European policy likewise prioritizes an upcoming digital strategy for agriculture, ensuring sustained funding for connected devices. Closed feedback loops created by AI-driven algorithms continuously adjust prescriptions, moving the variable rate technology market beyond static maps toward self-learning systems. Yet a widening digital divide between large and small farms threatens equitable technology uptake.
Government Subsidies and Incentive Schemes
Policymakers use grants, rebates, and eco-schemes to underwrite adoption costs. The USDA Climate-Smart Commodities initiative channels USD 3.1 billion into projects that necessitate granular production data and, by extension, precision input tools. Australia's On-Farm Connectivity Program covers half the cost of smart irrigation devices, while India's Digital Agriculture Mission earmarks INR 6,000 crore (USD 722.89 million) for connected infrastructure. Europe's Common Agricultural Policy directs at least 25% of direct payments toward eco-schemes that reward variable-rate fertilization. These subsidies lower entry barriers, especially for mid-size farms whose cash flows were once restricted by high-tech spending.
High Capital Expenditure of VRT-Ready Machinery
Profitability breakeven often starts at economic farm sizes above EUR 100,000 (USD 114,923.51), leaving smaller operations priced out of equipment purchases. Lenders such as AgDirect offer sector-specific loans, yet collateral hurdles persist for family farms with thin balance sheets. As a workaround, equipment-as-a-service contracts spread costs across acres serviced rather than units owned.
Other drivers and restraints analyzed in the detailed report include:
- Rising Agricultural Labor Shortage
- Satellite NB-IoT-Enabled Sub-Acre Prescriptions
- Patchy Rural Connectivity Infrastructure
For complete list of drivers and restraints, kindly check the Table Of Contents.
Segment Analysis
In 2024, cereals and grains represented 37.60% of revenues, cementing their role as the foundation of the variable rate technology market. These broad-acre crops benefit from decades of prescription mapping that fine-tunes nitrogen, phosphorus, and seeding density across large tracts. Commercial crops such as cotton, tobacco, and specialty fibers deliver the fastest gains with a 14.80% CAGR outlook, as higher margins justify premium sensors and on-equipment AI. Variable rate technology market size for commercial crops is anticipated to climb in tandem with quality-linked pricing schemes that reward precise micronaire or leaf grade. Continuous monitoring of plant stress via multispectral cameras feeds real-time models that initiate potassium or foliar-feed interventions within minutes. This responsiveness helps producers capture contract bonuses and reduce grade-related downgrades. Cereals will keep anchoring installed base volumes, yet specialty segments set the pace for advanced feature uptake.
Second-generation soil spectroscopy now measures nutrient release curves that underpin fertilizer micro-dosing in oilseed and pulse rotations. Adoption is especially strong in Brazil and India, where protein and oil content directly influence farm-gate prices. The variable rate technology market further penetrates orchard and vineyard operations as fruit exporters demand tighter Brix and color tolerances. Providers bundle sap analysis and irrigation rate control into subscription services so smaller acreage fruit farms can access high-end analytics without outright equipment purchases.
Fertilizers held a 31.70% market share in 2024 because nitrogen efficiency improvements deliver quick paybacks in most climatic zones. Variable-rate irrigation is poised for a 17.20% CAGR by 2030, reflecting escalating water scarcity and regulatory caps on seasonal withdrawals. In California trials, precision pivots cut water use by 25% with no yield penalty, validating the economics for almond and pistachio groves. The variable rate technology market size for irrigation equipment is forecast to add USD 1 billion in incremental sales by 2030, buoyed by subsidy programs that reimburse low-pressure nozzle retrofits. Crop-protection spraying follows close behind as computer-vision weed identification slashes herbicide volumes by up to 80%. Added to these gains, yield monitoring applications complete the data feedback loop that refines future prescriptions and anchors subscription renewals for analytics software.
Integration of wireless soil probes with cloud dashboards enables irrigation decisions that account for evapotranspiration forecasts and future rainfall probability. This predictive capability extends pump life and trims energy demand, reinforcing the resource-efficiency value proposition. Fertilizer applications now leverage real-time tissue testing via portable lab kits that sync to rate controllers, converting static maps into season-long dynamic schedules. Product innovation in biological crop-protection inputs further amplifies the need for precise micro-dosing that hinges on sensor-driven variable rate algorithms.
The Variable Rate Technology Market Report is Segmented by Crop Type (Cereals and Grains and More), by Application (Fertilizers, Crop-Protection Chemicals, and More), by Offering (Hardware and More), by Implementation Method (Map-Based VRT and More), by Farm Size (Large Farms and More) and by Geography (North America, Europe, and More). The Market Forecasts are Provided in Terms of Value (USD).
Geography Analysis
North America generated 39% of 2024 revenue for the variable rate technology market. Strong machinery penetration, supportive financing, and USDA climate-smart procurement rules anchor demand. Subsidy frameworks reward documented nutrient reductions, spurring the adoption of smart implements that capture nozzle-level logs. Rural broadband lags in parts of the Midwest and Prairie provinces, yet satellite link rollouts promise coverage boosts by 2026. Ohio State trials show a 6% yield lift when VR nitrogen intersects with drone stand counts, proof points that validate ongoing investment. Dealer ecosystems supply certified technicians who maintain fleets and interpret data, underscoring the service growth narrative.
Asia-Pacific is the fastest climber, tracking a 14.1% CAGR to 2030 as governments attach digital farming clauses to modernization spending. China's latest Five-Year Plan promotes low-carbon, high-efficiency agriculture that dovetails with targeted input delivery. India's Aadhaar-linked Farmer Registry simplifies subsidy disbursement for sensor kits, while Japan's Food and Agriculture Ministry co-funds paddy-specific variable rate seeding trials. The region's small-plot structure sparks creative solutions, including shared-service drones operated by village entrepreneurs. Water scarcity across Australia and Northern China accelerates variable-rate irrigation uptake, driving cross-border knowledge transfer and hardware imports.
Europe embeds variable rate technology adoption within sweeping climate policy. The Common Agricultural Policy for 2023-27 allocates EUR 269.5 billion (USD 312.4 billion), nearly half aimed at climate objectives that include reduced fertilizer leaching and pesticide drift. Each member state must earmark at least 25% of direct payments for eco-schemes, many of which list precision application as a qualifying practice. Countries such as the Netherlands fund digitization grants that reimburse up to 40% of sensor installations, hastening implementation. Data sovereignty rules raise compliance costs as platforms adapt to General Data Protection Regulation obligations. Nonetheless, consortium projects like Germany's 5G Testbed Agriculture expedite confidence in secure connectivity, and Pan-European carbon initiatives depend on traceable input data generated by rate controllers.
- Deere & Company
- AGCO Corporation
- CNH Industrial N.V.
- Valmont Industries, Inc.
- Lindsay Corporation
- EarthOptics
- Hexagon AB
- CropX Technologies
- TeeJet Technologies (Spraying Systems)
- DJI
- DroneDeploy
- The Climate Corporation (Bayer AG)
- EOS Data Analytics,Inc
- SoilOptix
- Frontier Agriculture Ltd
Additional Benefits:
- The market estimate (ME) sheet in Excel format
- 3 months of analyst support
TABLE OF CONTENTS
1 Introduction
- 1.1 Study Assumptions and Market Definition
- 1.2 Scope of the Study
2 Research Methodology
3 Executive Summary
4 Market Landscape
- 4.1 Market Overview
- 4.2 Market Drivers
- 4.2.1 Rapid digitalization of farms
- 4.2.2 Government subsidies and incentive schemes
- 4.2.3 Rising agriculture labour shortage
- 4.2.4 Satellite NB-IoT-enabled sub-acre prescriptions
- 4.2.5 Carbon credit monetization demanding input traceability
- 4.2.6 On-equipment AI chips for offline VRT analytics
- 4.3 Market Restraints
- 4.3.1 High capital expenditure of VRT-ready machinery
- 4.3.2 Patchy rural connectivity infrastructure
- 4.3.3 Data ownership and sharing ambiguities
- 4.3.4 Shortage of VRT skilled agronomic service providers
- 4.4 Regulatory Landscape
- 4.5 Technological Outlook
- 4.6 Porter's Five Forces Analysis
- 4.6.1 Threat of New Entrants
- 4.6.2 Bargaining Power of Buyers
- 4.6.3 Bargaining Power of Suppliers
- 4.6.4 Threat of Substitutes
- 4.6.5 Intensity of Competitive Rivalry
5 Market Size and Growth Forecasts (Value)
- 5.1 By Crop Type
- 5.1.1 Cereals and Grains
- 5.1.2 Fruits and Vegetables
- 5.1.3 Oilseeds and Pulses
- 5.1.4 Commercial Crops
- 5.2 By Application
- 5.2.1 Fertilizers
- 5.2.2 Crop-protection Chemicals
- 5.2.3 Soil Sensing
- 5.2.4 Yield Monitoring
- 5.2.5 Irrigation
- 5.2.6 Others (variable-rate seeding/planting, variable-rate lime and soil-amendment application)
- 5.3 By Offering
- 5.3.1 Hardware
- 5.3.2 Software
- 5.3.3 Services
- 5.4 By Implementation Method
- 5.4.1 Map-based VRT
- 5.4.2 Sensor-based VRT
- 5.5 By Farm Size
- 5.5.1 Large Farms (greater than 1,000 ha)
- 5.5.2 Medium Farms (200-1,000 ha)
- 5.5.3 Small Farms (less than 200 ha)
- 5.6 By Geography
- 5.6.1 North America
- 5.6.1.1 United States
- 5.6.1.2 Canada
- 5.6.1.3 Mexico
- 5.6.1.4 Rest of North America
- 5.6.2 Europe
- 5.6.2.1 Germany
- 5.6.2.2 France
- 5.6.2.3 United Kingdom
- 5.6.2.4 Italy
- 5.6.2.5 Spain
- 5.6.2.6 Russia
- 5.6.2.7 Rest of Europe
- 5.6.3 Asia-Pacific
- 5.6.3.1 China
- 5.6.3.2 Japan
- 5.6.3.3 India
- 5.6.3.4 South Korea
- 5.6.3.5 Australia
- 5.6.3.6 Rest of Asia-Pacific
- 5.6.4 Middle East
- 5.6.4.1 Turkey
- 5.6.4.2 Saudi Arabia
- 5.6.4.3 United Arab Emirates
- 5.6.4.4 Rest of Middle East
- 5.6.5 Africa
- 5.6.5.1 South Africa
- 5.6.5.2 Egypt
- 5.6.5.3 Nigeria
- 5.6.5.4 Rest of Africa
- 5.6.1 North America
6 Competitive Landscape
- 6.1 Market Concentration
- 6.2 Strategic Moves
- 6.3 Market Share Analysis
- 6.4 Company Profiles (includes Global level Overview, Market level overview, Core Segments, Financials as available, Strategic Information, Market Rank/Share, Products and Services, Recent Developments)
- 6.4.1 Deere & Company
- 6.4.2 AGCO Corporation
- 6.4.3 CNH Industrial N.V.
- 6.4.4 Valmont Industries, Inc.
- 6.4.5 Lindsay Corporation
- 6.4.6 EarthOptics
- 6.4.7 Hexagon AB
- 6.4.8 CropX Technologies
- 6.4.9 TeeJet Technologies (Spraying Systems)
- 6.4.10 DJI
- 6.4.11 DroneDeploy
- 6.4.12 The Climate Corporation (Bayer AG)
- 6.4.13 EOS Data Analytics,Inc
- 6.4.14 SoilOptix
- 6.4.15 Frontier Agriculture Ltd
7 Market Opportunities and Future Outlook

