
Need help finding what you are looking for?
Contact Us
PUBLISHER: Mordor Intelligence | PRODUCT CODE: 1693517

PUBLISHER: Mordor Intelligence | PRODUCT CODE: 1693517
Phosphatic Fertilizer - Market Share Analysis, Industry Trends & Statistics, Growth Forecasts (2025 - 2030)
PUBLISHED:
PAGES: 321 Pages
DELIVERY TIME: 2-3 business days
SELECT AN OPTION
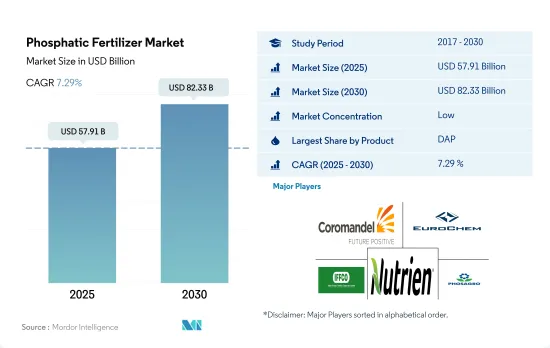
The Phosphatic Fertilizer Market size is estimated at 57.91 billion USD in 2025, and is expected to reach 82.33 billion USD by 2030, growing at a CAGR of 7.29% during the forecast period (2025-2030).
Reducing phosphorous content in the soils and the need for the element in crop growth may drive the market
- Diammonium phosphate (DAP) dominated the phosphatic fertilizer market in 2022, capturing a significant 41.3% global consumption share, equivalent to 30.9 million metric tons. Its popularity stems from its composition, with 46.0% phosphate and 18.0% ammonium, serving as a nitrogen source. This made DAP the top choice for farmers worldwide. The market value of DAP reached USD 23.3 billion in 2022.
- Monoammonium phosphate (MAP) emerged as the second most favored phosphatic fertilizer, trailing behind DAP. The global MAP market, valued at USD 11.3 billion in 2022, witnessed a consumption volume of 15.3 million metric tons. Notably, MAP boasts a water-soluble P content of around 90%, surpassing the crop growth requirements.
- Triple superphosphate (TSP), a pure phosphate-based fertilizer with the highest phosphate content of 46.0%, accounted for 21.1% of global phosphate fertilizer consumption in 2022. The TSP market is poised for growth, especially with the expansion of legume crop cultivation areas.
- Single superphosphate (SSP) constituted 16.7% of global phosphatic fertilizer consumption in 2022. SSP finds significant usage in oilseed crops, owing to its role in providing crucial sulfur trace elements for edible oils and calcium nutrients in acidic soils. These factors indicate a potential uptick in SSP usage in the coming years.
- The phosphatic fertilizer market is projected to witness robust growth, with an estimated CAGR of 7.0% from 2023 to 2030. This growth is primarily driven by the escalating global demand for phosphatic fertilizers as more farmers seek to enhance their crop yields.
The need to improve productivity and rising demand to address the phosphate deficiency are expected to fuel the growth of the market
- The Asia-Pacific region dominated the global phosphatic fertilizer market and accounted for about 58.6% of the total market value, accounting for about USD 32.8 billion in 2022. In 2022, DAP occupied a market share of 49.8% in the Asia-Pacific phosphatic fertilizers market. The greater demand for DAP in the region is due to its greater efficiency than other phosphatic fertilizers like TSP and SSP.
- China was the world's leading producer of phosphorus fertilizers, accounting for nearly 10.3% value share of the global phosphatic fertilizer market in 2022. Its exports represented approximately 25.3% of the world's exports. The top importers from China are Indonesia, Australia, and Iran.
- North America secured the second-largest market share at 10.6%. Phosphatic fertilizers, after nitrogen fertilizers, are the second most crucial nutrient source for crops. In North America, mono ammonium phosphate (MAP) and diammonium phosphate (DAP) dominated the market in 2022, with shares of 66.3% and 30.9%, respectively. The high phosphate content in MAP drove its demand.
- In 2022, the South American phosphatic fertilizer market held a 20.3% share of the global market, and it is projected to register a CAGR of 6.9% during 2023-2030.
- The global phosphatic fertilizer market has witnessed a consistent upward trajectory in both value and volume, barring a dip in 2020, primarily attributed to the disruptions caused by the COVID-19 pandemic. However, the market value is expected to rebound during 2023-2030, driven by a decline in global cultivation areas.
Global Phosphatic Fertilizer Market Trends
The rising pressure on the agriculture industry to meet the growing food demand is expected to increase the area under field crop cultivation
- The global agricultural sector grapples with numerous challenges. The United Nations projects a world population surpassing 9 billion by 2050, potentially straining an agricultural industry already struggling with labor shortages and shrinking fields due to urbanization. The Food and Agriculture Organization predicts that by 2050, 70% of the global population will reside in urban areas. With arable land dwindling worldwide, farmers are increasingly relying on fertilizers to bolster crop yields in an effort to meet the rising demand for food.
- The Asia-Pacific region stands as the leading global agricultural producer, with agriculture employing roughly 20% of its workforce. Field crop cultivation dominates, encompassing over 95% of the region's crop area. Rice, wheat, and corn, collectively occupying 24.3% of the crop area in 2022, are the primary field crops in the region, which is a testament to the region's agricultural diversity and productivity.
- North America ranks as the second-largest arable region globally, boasting a diverse crop portfolio with a focus on field crops. Notably, corn, cotton, rice, soybean, and wheat take center stage, as highlighted by the USDA. In 2022, the United States commanded 46.2% of North America's crop cultivation area. However, adverse environmental conditions, including severe flooding in regions like Texas and Houston, led to a significant drop in the country's crop acreage between 2017 and 2019, underscoring the vulnerability of agricultural production to climate change.
Canola has the highest application rate of potassic fertilizers globally, with an average application rate of 248.6 kg/ha
- Corn, rapeseed, cotton, sorghum, rice, wheat, and soybean are prominent crops globally, known for their high nutrient requirements. The average primary nutrient application rates for these crops in 2022 were as follows: corn (230.57 kg/ha), rapeseed (255.75 kg/ha), cotton (172.70 kg/ha), sorghum (158.46 kg/ha), rice (154.49 kg/ha), wheat (135.35 kg/ha), and soybean (120.97 kg/ha). Primary nutrients are vital for crops, facilitating metabolic processes and contributing to the formation of essential plant tissues, including cells, cell membranes, and chlorophyll. Notably, phosphorus is crucial for cultivating high-quality crops, while potassium plays a pivotal role in activating enzymes necessary for plant growth.
- On a global scale, field crops have an average nutrient application rate of 164.31 kg/ha for nitrogen, potassium, and phosphorus. Nitrogen takes the lead as the most widely used primary nutrient, with an application rate of 224.6 kg/ha, followed by potassium at 150.3 kg/ha. Phosphorus ranks third, with a consumption rate of 117.9 kg/ha in 2022.
- In 2022, rapeseed had the highest nitrogen application rate at 347.4 kg/ha. Corn led in phosphorus application at 156.3 kg/ha, and canola topped in potassium application at 248.6 kg/ha.
- Field crop cultivation is rising globally, with notable growth in South America and Asia-Pacific. These regions are emerging as key markets for fertilizers. Developed regions like Europe and North America, along with areas grappling with nutrient deficiencies, are increasingly turning to specialty fertilizers for their efficacy. These dynamics are poised to fuel the primary nutrient fertilizers market in the coming years.
Phosphatic Fertilizer Industry Overview
The Phosphatic Fertilizer Market is fragmented, with the top five companies occupying 13.55%. The major players in this market are Coromandel International Ltd., EuroChem Group, Indian Farmers Fertiliser Cooperative Limited, Nutrien Ltd. and PhosAgro Group of Companies (sorted alphabetically).
Additional Benefits:
- The market estimate (ME) sheet in Excel format
- 3 months of analyst support
Product Code: 92581
TABLE OF CONTENTS
1 EXECUTIVE SUMMARY & KEY FINDINGS
2 REPORT OFFERS
3 INTRODUCTION
- 3.1 Study Assumptions & Market Definition
- 3.2 Scope of the Study
- 3.3 Research Methodology
4 KEY INDUSTRY TRENDS
- 4.1 Acreage Of Major Crop Types
- 4.1.1 Field Crops
- 4.1.2 Horticultural Crops
- 4.2 Average Nutrient Application Rates
- 4.2.1 Primary Nutrients
- 4.2.1.1 Field Crops
- 4.2.1.2 Horticultural Crops
- 4.2.1 Primary Nutrients
- 4.3 Agricultural Land Equipped For Irrigation
- 4.4 Regulatory Framework
- 4.5 Value Chain & Distribution Channel Analysis
5 MARKET SEGMENTATION (includes market size in Value in USD and Volume, Forecasts up to 2030 and analysis of growth prospects)
- 5.1 Type
- 5.1.1 Straight
- 5.1.1.1 Phosphatic
- 5.1.1.1.1 DAP
- 5.1.1.1.2 MAP
- 5.1.1.1.3 SSP
- 5.1.1.1.4 TSP
- 5.1.1.1.5 Others
- 5.1.1 Straight
- 5.2 Application Mode
- 5.2.1 Fertigation
- 5.2.2 Foliar
- 5.2.3 Soil
- 5.3 Crop Type
- 5.3.1 Field Crops
- 5.3.2 Horticultural Crops
- 5.3.3 Turf & Ornamental
- 5.4 Region
- 5.4.1 Asia-Pacific
- 5.4.1.1 Australia
- 5.4.1.2 Bangladesh
- 5.4.1.3 China
- 5.4.1.4 India
- 5.4.1.5 Indonesia
- 5.4.1.6 Japan
- 5.4.1.7 Pakistan
- 5.4.1.8 Philippines
- 5.4.1.9 Thailand
- 5.4.1.10 Vietnam
- 5.4.1.11 Rest of Asia-Pacific
- 5.4.2 Europe
- 5.4.2.1 France
- 5.4.2.2 Germany
- 5.4.2.3 Italy
- 5.4.2.4 Netherlands
- 5.4.2.5 Russia
- 5.4.2.6 Spain
- 5.4.2.7 Ukraine
- 5.4.2.8 United Kingdom
- 5.4.2.9 Rest of Europe
- 5.4.3 Middle East & Africa
- 5.4.3.1 Nigeria
- 5.4.3.2 Saudi Arabia
- 5.4.3.3 South Africa
- 5.4.3.4 Turkey
- 5.4.3.5 Rest of Middle East & Africa
- 5.4.4 North America
- 5.4.4.1 Canada
- 5.4.4.2 Mexico
- 5.4.4.3 United States
- 5.4.4.4 Rest of North America
- 5.4.5 South America
- 5.4.5.1 Argentina
- 5.4.5.2 Brazil
- 5.4.5.3 Rest of South America
- 5.4.1 Asia-Pacific
6 COMPETITIVE LANDSCAPE
- 6.1 Key Strategic Moves
- 6.2 Market Share Analysis
- 6.3 Company Landscape
- 6.4 Company Profiles
- 6.4.1 Coromandel International Ltd.
- 6.4.2 EuroChem Group
- 6.4.3 Indian Farmers Fertiliser Cooperative Limited
- 6.4.4 K+S Aktiengesellschaft
- 6.4.5 Koch Industries Inc.
- 6.4.6 Nutrien Ltd.
- 6.4.7 PhosAgro Group of Companies
- 6.4.8 SABIC Agri-Nutrients Co.
7 KEY STRATEGIC QUESTIONS FOR FERTILIZER CEOS
8 APPENDIX
- 8.1 Global Overview
- 8.1.1 Overview
- 8.1.2 Porter's Five Forces Framework
- 8.1.3 Global Value Chain Analysis
- 8.1.4 Market Dynamics (DROs)
- 8.2 Sources & References
- 8.3 List of Tables & Figures
- 8.4 Primary Insights
- 8.5 Data Pack
- 8.6 Glossary of Terms
Have a question?


SELECT AN OPTION
Have a question?
Questions? Please give us a call or visit the contact form.