
PUBLISHER: Mordor Intelligence | PRODUCT CODE: 1687224

PUBLISHER: Mordor Intelligence | PRODUCT CODE: 1687224
Syngas - Market Share Analysis, Industry Trends & Statistics, Growth Forecasts (2025 - 2030)
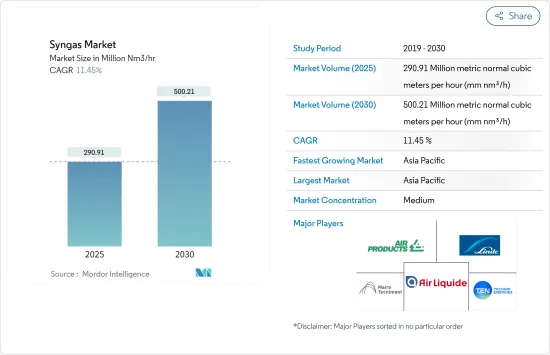
The Syngas Market size is estimated at 290.91 million metric normal cubic meters per hour (mm nm3/h) in 2025, and is expected to reach 500.21 million metric normal cubic meters per hour (mm nm3/h) by 2030, at a CAGR of 11.45% during the forecast period (2025-2030).
COVID-19 negatively impacted the market in 2020. However, with the resumption of operations in major applications in 2021, the market is expected to recover significantly during the forecast period.
Key Highlights
- The growing demand for syngas from the electricity and chemical industry, increasing environmental awareness and government regulations on renewable fuel use, and increasing hydrogen demand for fertilizers are expected to drive the growth of the market.
- Conversely, syngas production plant setup requires high capital investment and funding. This factor is expected to hinder the market's growth.
- The development of underground coal gasification technology is likely to act as an opportunity in the future.
- Asia-Pacific dominated the market across the world, with the largest consumption, holding a major share in the market.
Syngas Market Trends
Ammonia Segment to Dominate the Market
- Ammonia is produced from syngas with methane as the main feedstock. Steam and methane are passed through a catalyst to produce carbon dioxide and hydrogen in the first phase. In the second phase, air is added, forming carbon dioxide, hydrogen, nitrogen, and steam.
- In the next step, carbon dioxide is removed, the mixture is dried, and nitrogen and hydrogen, which were previously compressed and cooled, are combined in the presence of a catalyst to form ammonia. The remaining syngas formed in the penultimate step is sent back to the reactor.
- Ammonia is the basic building block of the global nitrogen industry. Consumption of ammonia for nitrogen fertilizers accounts for over 80% of the global ammonia market.
- Ammonia is used to produce ammonium nitrates to make explosives. It is also used in producing acrylonitrile for acrylic fibers and plastics, hexamethylenediamine for nylon 66, caprolactam for nylon 6, isocyanates for polyurethanes and hydrazine, and various amines and nitriles.
- According to the United States Geological 2022, global ammonia production is estimated to be 150 million metric tons in 2021.
- China is the major producer of ammonia, followed by Russia, the United States, and India. In 2021, China's ammonia production was 39 million metric tons.
- Ammonia production in the United States was estimated to be 14 million metric tons. Sixteen companies produced it at 35 plants in 16 States in the United States in 2021. About 60% of the total US ammonia production capacity was in Louisiana, Oklahoma, and Texas because of their large natural gas reserves.
- According to the US Geological Survey, it is estimated that global ammonia capacity is expected to increase by 4% during the next four years. Capacity additions are expected in Africa, Eastern Europe, and South Asia.
- Therefore, with the rapid growth of the ammonia industry, the demand for syngas is expected to increase during the forecast period.
Asia-Pacific Region to Drive the Market Demand
- Asia-Pacific dominated the global market share, with rising demand from the countries such as China and India, which are among the fastest-growing economies across the world. Moreover, countries are moving toward renewable energy sources, which triggers market growth.
- In China, Air Products was awarded a long-term onsite contract to supply syngas to Jiutai New Material Co. Ltd for its high-value mono-ethylene glycol project in Hohhot, China. The project is expected to start in 2023. The facility/plant is designed to produce over 500,000 Nm3/hr of syngas, comprised of five gasifiers, two approximately 100,000 Nm3/hr air separation units (ASU) with syngas purification and processing, and associated infrastructure and utilities.
- A breakthrough in the coal-to-syngas processing facility in Xuwei National Petrochemical Park, Lianyungang City, Jiangsu Province, China, is evident in the 80% Air Products/20% joint venture with Debang Xinghua Technology Co. Ltd (a subsidiary of Jiangsu Debang Chemical Industrial Group Co. Ltd ('Debang Group')).
- India developed a technology to convert high ash Indian coal to methanol and established its first pilot plant in Hyderabad. The process of converting coal into methanol may consist of converting coal to synthesis (syngas) gas, and further process, thus adding to the syn gas market in the country.
- Indian conglomerate Reliance Industries Limited also announced its plans to turn syngas into blue hydrogen in its Jamnagar complex until the pricing of green hydrogen comes down. Such factors may positively affect the market studied.
- Ammonia is majorly used in fertilizer production. The Indian government has also provided a budget allocation for fertilizers in FY 2021-22 of USD 10.75 billion. This is expected to drive the syn gas market for ammonia production during the forecast period.
- Therefore, the abovementioned factors are expected to impact the market in the future significantly.
Syngas Industry Overview
The syngas market is partly fragmented in nature. Some of the key players in the market (not in particular order) include Air Liquide SA, Linde PLC, Air Products and Chemicals Inc., Maire Tecnimont SpA, and Technip Energies NV, among other companies.
Additional Benefits:
- The market estimate (ME) sheet in Excel format
- 3 months of analyst support
TABLE OF CONTENTS
1 INTRODUCTION
- 1.1 Study Assumptions
- 1.2 Scope of the Report
2 RESEARCH METHODOLOGY
3 EXECUTIVE SUMMARY
4 MARKET DYNAMICS
- 4.1 Drivers
- 4.1.1 Growing Demand in the Electricity and Chemical Industry
- 4.1.2 Increasing Environmental Awareness and Government Regulations on the Use of Renewable Fuel
- 4.1.3 Increasing Hydrogen Demand for Fertilizers
- 4.2 Restraints
- 4.2.1 High Capital Investment and Funding
- 4.3 Industry Value Chain Analysis
- 4.4 Porter's Five Forces Analysis
- 4.4.1 Bargaining Power of Suppliers
- 4.4.2 Bargaining Power of Buyers
- 4.4.3 Threat of New Entrants
- 4.4.4 Threat of Substitute Products and Services
- 4.4.5 Degree of Competition
5 MARKET SEGMENTATION (Market Size in Volume)
- 5.1 Feedstock
- 5.1.1 Pet Coke
- 5.1.2 Coal
- 5.1.3 Natural Gas
- 5.1.4 Other Feedstock Types
- 5.2 Technology
- 5.2.1 Steam Reforming
- 5.2.2 Gasification
- 5.3 Gasifier Type
- 5.3.1 Fixed Bed
- 5.3.2 Entrained Flow
- 5.3.3 Fluidized Bed
- 5.4 Application
- 5.4.1 Methanol
- 5.4.2 Ammonia
- 5.4.3 Hydrogen
- 5.4.4 Liquid Fuels
- 5.4.5 Direct Reduced Iron
- 5.4.6 Synthetic Natural Gas
- 5.4.7 Electricity
- 5.4.8 Other Applications
- 5.5 Geography
- 5.5.1 Asia-Pacific
- 5.5.1.1 China
- 5.5.1.2 India
- 5.5.1.3 Rest of Asia-Pacific
- 5.5.2 North America
- 5.5.2.1 United States
- 5.5.2.2 Canada
- 5.5.2.3 Trinidad and Tobago
- 5.5.3 Europe
- 5.5.3.1 Russia
- 5.5.3.2 Rest of Europe
- 5.5.4 South America
- 5.5.4.1 Venezuela
- 5.5.4.2 Brazil
- 5.5.4.3 Rest of South America
- 5.5.5 Middle East and Africa
- 5.5.5.1 Saudi Arabia
- 5.5.5.2 Qatar
- 5.5.5.3 South Africa
- 5.5.5.4 Iran
- 5.5.5.5 Rest of Middle East and Africa
- 5.5.1 Asia-Pacific
6 COMPETITIVE LANDSCAPE
- 6.1 Mergers and Acquisitions, Joint Ventures, Collaborations, and Agreements
- 6.2 Market Ranking Analysis
- 6.3 Strategies Adopted by Leading Players
- 6.4 Company Profiles
- 6.4.1 A.H.T Syngas Technology NV
- 6.4.2 Air Liquide
- 6.4.3 Air Products and Chemicals Inc.
- 6.4.4 Airpower Technologies Limited
- 6.4.5 John Wood Group PLC
- 6.4.6 KBR Inc.
- 6.4.7 Linde PLC
- 6.4.8 Maire Tecnimont Spa
- 6.4.9 Sasol
- 6.4.10 Shell PLC
- 6.4.11 Technip Energies NV
- 6.4.12 Topsoe AS
7 MARKET OPPORTUNITIES AND FUTURE TRENDS
- 7.1 Development of Underground Coal Gasification Technology

