PUBLISHER: Mordor Intelligence | PRODUCT CODE: 2120393

PUBLISHER: Mordor Intelligence | PRODUCT CODE: 2120393
Text Analytics - Market Share Analysis, Industry Trends & Statistics, Growth Forecasts (2026 - 2031)
According to Mordor Intelligence, the text analytics market reached USD 18.81 billion in 2026 and is forecast to climb to USD 51.17 billion by 2031, advancing at a 22.16% CAGR during 2026-2031.
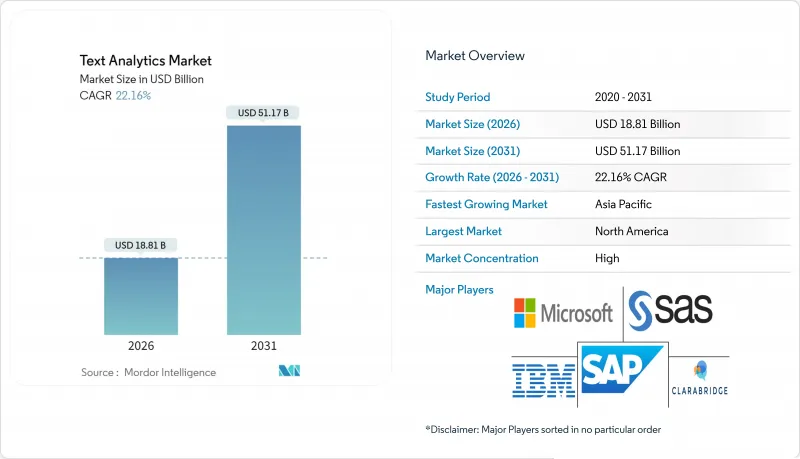
This report Segments the Industry Into by Deployment (On-Premise, and Cloud), by Application (Risk Management, Fraud Management, Business Intelligence, and More), by End-User Industry (BFSI, Healthcare, Energy and Utility, and More), and by Geography. The Market Forecasts are Provided in Terms of Value (USD).
Global Text Analytics Market Trends and Insights
Integration of Large Language Models into Enterprise Text Analytics
Enterprises plugged large language models (LLMs) into production workflows to automate clause extraction, nuance detection, and conversational summarization. Microsoft's 2025 release of GPT-4 inside Azure AI Language cut labeled-data requirements by 40% compared with prior transformers, trimming annotation budgets for procurement and legal teams. Oracle added generative document understanding to its cloud stack, letting customers surface payment terms and liability caps across thousands of contracts in minutes. These gains arrive with bias and hallucination risks, so organizations increasingly deploy human-in-the-loop validation layers. Despite mitigation costs, the economic upside is significant; McKinsey estimates generative AI could unlock USD 2.6-4.4 trillion in annual value across functions.
Proliferation of Unstructured Text Data Across Enterprises
Customer reviews, help-desk notes, safety logs, and regulatory filings pour into corporate repositories faster than manual teams can read them. A mid-2025 LinkedIn survey found that enterprises stored 55% more unstructured text than in 2024, exceeding structured-data growth by a factor of four. This flood makes automated parsing a necessity rather than an optimization. Vendors now bundle pre-trained entity catalogs for domains such as life sciences and oil and gas, accelerating time-to-benefit for specialized users. However, as vocabularies evolve, models face drift, reinforcing demand for continuous retraining services.
Data Privacy and Compliance Concerns
Fragmented data-protection regimes create compliance silos. The EU GDPR authorizes fines up to 4% of global revenue; Meta paid EUR 1.2 billion (USD 1.3 billion) in 2023 for unlawful transfers, while TikTok incurred EUR 345 million (USD 378 million) for child-data lapses, raising executive sensitivity to textual-data flows. California's 2023 Consumer Privacy amendments grant residents the right to opt out of automated decision-making, forcing dual pipelines for opted-in and opted-out records. The EU AI Act classifies sentiment and emotion recognition as high risk, layering conformity assessments onto deployment timelines. Compliance costs land heaviest on SMEs that lack in-house counsel, motivating uptake of audit-ready SaaS platforms.
Other drivers and restraints analyzed in the detailed report include:
- Growing Demand for Social Media Analytics
- Rising Adoption of Predictive Analytics for Customer Insights
- High Carbon Footprint of Deep-Learning Text Analytics Workloads
For complete list of drivers and restraints, kindly check the Table Of Contents.
Segment Analysis
Services claimed 23.06% CAGR potential, outstripping software growth as organizations grapple with model drift and domain fine-tuning. In 2025, software still held 61.43% of text analytics market share, spanning NLP engines, sentiment scorers, and pretrained transformers. Yet rising linguistic variation and regulatory audits make continuous retraining a must, steering budgets toward managed services and annotation outsourcing.
Vendors respond with outcome-based contracts, cost per extracted entity, or per summarized page, that cap risk for buyers. However, proprietary schemas can lock enterprises into a single provider, prompting calls for open-source formats. For software vendors, bundling low-cost APIs with premium consulting offers a hedge against margin squeeze.
On-premises installations controlled 59.89% of 2025 spend, yet the cloud slice is growing at a 22.99% CAGR as hybrid patterns mature. A 2025 preliminary study calculated that shifting to the cloud cut the total cost of ownership 40-50% by eliminating hardware refresh and granting instant access to updated models. Cloud deployments are projected to overtake on-premises deployments by 2029 if current momentum holds.
Hybrid designs anonymize text in public clouds while retaining personally identifiable information on-premises, appeasing bankers and hospitals that fear data-residency breaches. The EU Data Act bolsters portability rights, forcing providers to support open export formats and sparking a race for interoperability. Edge deployments, though niche, enable factory gateways and autonomous vehicles to parse logs offline, cutting latency. The primary hurdle is model sync; rural facilities may update only monthly, letting drift accumulate.
Complete Report Scope:
- By Component
- Software
- Services
- By Deployment Model
- On-premise
- Cloud
- By Analytics Type
- Sentiment Analysis
- Predictive Analytics
- Speech Analytics
- Other Analytics Types
- By Application
- Risk Management
- Fraud Management
- Business Intelligence
- Social Media Analysis
- Customer Care Services
- Governance, Risk and Compliance Management
- Other Applications
- By End-User Industry
- BFSI
- Healthcare
- Energy and Utilities
- Retail and E-commerce
- Government and Defense
- IT and Telecom
- Other End-User Industries
- By Enterprise Size
- Large Enterprises
- Small and Medium Enterprises (SMEs)
- By Geography
- North America
- United States
- Canada
- Mexico
- South America
- Brazil
- Argentina
- Rest of South America
- Europe
- United Kingdom
- Germany
- France
- Italy
- Spain
- Rest of Europe
- Asia-Pacific
- China
- Japan
- India
- South Korea
- ASEAN
- Oceania
- Rest of Asia-Pacific
- Middle East and Africa
- Middle East
- Saudi Arabia
- United Arab Emirates
- Turkey
- Rest of Middle East
- Africa
- South Africa
- Nigeria
- Egypt
- Rest of Africa
- Middle East
- North America
Geography Analysis
North America accounted for 42.33% of global revenue in 2025, anchored by early adoption across tech, finance, and retail. Vendors in the region bundle text analytics into wider AI portfolios, driving down per-document pricing. Regulatory headwinds, notably the California privacy amendments, spark investment in explainability toolkits.
Asia-Pacific is projected to post a 23.57% CAGR, the fastest worldwide. China's 2025 guidelines promoted sovereign LLMs for industry and government, mandating domestic hosting and splintering the global model ecosystem. Japan's Digital Agency digitizes municipal services, spawning demand for Japanese-language chatbots, while India's IT services giants export multilingual analytics covering Hindi, Tamil, and Bengali. The text analytics market size in Asia-Pacific is poised to exceed USD 15 billion by 2031 if growth holds.
Europe shows steady uptake, driven by ESG-reporting mandates that require textual data parsing. The EU AI Act introduces conformity assessments, raising entry barriers but fueling demand for compliant, explainable platforms. South America's market remains nascent, hampered by cloud-infrastructure gaps and currency volatility. In the Middle East and Africa, sovereign wealth funds in the United Arab Emirates and Saudi Arabia bankroll smart-city projects that embed NLP into citizen-service portals.
- IBM Corporation
- Microsoft Corporation
- SAP SE
- SAS Institute Inc.
- Lexalytics Inc.
- Luminoso Technologies Inc.
- Clarabridge Inc.
- Micro Focus International plc
- OpenText Corporation
- RapidMiner Inc.
- Infegy Inc.
- Medallia Inc.
- Google LLC
- Amazon Web Services, Inc.
- Oracle Corporation
- Qualtrics International Inc.
- Snowflake Inc.
- Altair Engineering Inc.
- Databricks Inc.
- Sinequa
- Yext Inc.
- KNIME AG
Additional Benefits:
- The market estimate (ME) sheet in Excel format
- 3 months of analyst support
TABLE OF CONTENTS
1 INTRODUCTION
- 1.1 Study Assumptions and Market Definition
- 1.2 Scope of the Study
2 RESEARCH METHODOLOGY
3 EXECUTIVE SUMMARY
4 MARKET LANDSCAPE
- 4.1 Market Overview
- 4.2 Market Drivers
- 4.2.1 Growing Demand for Social Media Analytics
- 4.2.2 Rising Adoption of Predictive Analytics for Customer Insights
- 4.2.3 Proliferation of Unstructured Text Data Across Enterprises
- 4.2.4 Integration of Large Language Models into Enterprise Text Analytics
- 4.2.5 Expansion of Real-Time Text Analytics in Edge IoT Devices
- 4.2.6 Regulatory Mandates for ESG Disclosure Requiring Textual Data Parsing
- 4.3 Market Restraints
- 4.3.1 Lack of Skilled Personnel and Awareness
- 4.3.2 Data Privacy and Compliance Concerns
- 4.3.3 High Carbon Footprint of Deep-Learning Text Analytics Workloads
- 4.3.4 Increasing Cost of High-Quality Multilingual Training Data
- 4.4 Industry Value Chain Analysis
- 4.5 Regulatory Landscape
- 4.6 Technological Outlook
- 4.7 Porter's Five Forces Analysis
- 4.7.1 Bargaining Power of Suppliers
- 4.7.2 Bargaining Power of Buyers
- 4.7.3 Threat of New Entrants
- 4.7.4 Threat of Substitute Products
- 4.7.5 Intensity of Competitive Rivalry
- 4.8 Impact of Macroeconomic Factors on the Market
5 MARKET SIZE AND GROWTH FORECASTS (VALUE)
- 5.1 By Component
- 5.1.1 Software
- 5.1.2 Services
- 5.2 By Deployment Model
- 5.2.1 On-premise
- 5.2.2 Cloud
- 5.3 By Analytics Type
- 5.3.1 Sentiment Analysis
- 5.3.2 Predictive Analytics
- 5.3.3 Speech Analytics
- 5.3.4 Other Analytics Types
- 5.4 By Application
- 5.4.1 Risk Management
- 5.4.2 Fraud Management
- 5.4.3 Business Intelligence
- 5.4.4 Social Media Analysis
- 5.4.5 Customer Care Services
- 5.4.6 Governance, Risk and Compliance Management
- 5.4.7 Other Applications
- 5.5 By End-User Industry
- 5.5.1 BFSI
- 5.5.2 Healthcare
- 5.5.3 Energy and Utilities
- 5.5.4 Retail and E-commerce
- 5.5.5 Government and Defense
- 5.5.6 IT and Telecom
- 5.5.7 Other End-User Industries
- 5.6 By Enterprise Size
- 5.6.1 Large Enterprises
- 5.6.2 Small and Medium Enterprises (SMEs)
- 5.7 By Geography
- 5.7.1 North America
- 5.7.1.1 United States
- 5.7.1.2 Canada
- 5.7.1.3 Mexico
- 5.7.2 South America
- 5.7.2.1 Brazil
- 5.7.2.2 Argentina
- 5.7.2.3 Rest of South America
- 5.7.3 Europe
- 5.7.3.1 United Kingdom
- 5.7.3.2 Germany
- 5.7.3.3 France
- 5.7.3.4 Italy
- 5.7.3.5 Spain
- 5.7.3.6 Rest of Europe
- 5.7.4 Asia-Pacific
- 5.7.4.1 China
- 5.7.4.2 Japan
- 5.7.4.3 India
- 5.7.4.4 South Korea
- 5.7.4.5 ASEAN
- 5.7.4.6 Oceania
- 5.7.4.7 Rest of Asia-Pacific
- 5.7.5 Middle East and Africa
- 5.7.5.1 Middle East
- 5.7.5.1.1 Saudi Arabia
- 5.7.5.1.2 United Arab Emirates
- 5.7.5.1.3 Turkey
- 5.7.5.1.4 Rest of Middle East
- 5.7.5.2 Africa
- 5.7.5.2.1 South Africa
- 5.7.5.2.2 Nigeria
- 5.7.5.2.3 Egypt
- 5.7.5.2.4 Rest of Africa
- 5.7.5.1 Middle East
- 5.7.1 North America
6 COMPETITIVE LANDSCAPE
- 6.1 Market Concentration
- 6.2 Strategic Moves
- 6.3 Market Share Analysis
- 6.4 Company Profiles (Includes Global Level Overview, Market Level Overview, Core Segments, Financials as Available, Strategic Information, Market Rank/Share for Key Companies, Products and Services, and Recent Developments)
- 6.4.1 IBM Corporation
- 6.4.2 Microsoft Corporation
- 6.4.3 SAP SE
- 6.4.4 SAS Institute Inc.
- 6.4.5 Lexalytics Inc.
- 6.4.6 Luminoso Technologies Inc.
- 6.4.7 Clarabridge Inc.
- 6.4.8 Micro Focus International plc
- 6.4.9 OpenText Corporation
- 6.4.10 RapidMiner Inc.
- 6.4.11 Infegy Inc.
- 6.4.12 Medallia Inc.
- 6.4.13 Google LLC
- 6.4.14 Amazon Web Services, Inc.
- 6.4.15 Oracle Corporation
- 6.4.16 Qualtrics International Inc.
- 6.4.17 Snowflake Inc.
- 6.4.18 Altair Engineering Inc.
- 6.4.19 Databricks Inc.
- 6.4.20 Sinequa
- 6.4.21 Yext Inc.
- 6.4.22 KNIME AG
7 MARKET OPPORTUNITIES AND FUTURE OUTLOOK
- 7.1 White-Space and Unmet-Need Assessment

