PUBLISHER: Mordor Intelligence | PRODUCT CODE: 2120468

PUBLISHER: Mordor Intelligence | PRODUCT CODE: 2120468
Application Performance Management - Market Share Analysis, Industry Trends & Statistics, Growth Forecasts (2026 - 2031)
According to Mordor Intelligence, the application performance management market size was valued at USD 12.27 billion in 2025 and estimated to grow from USD 15.87 billion in 2026 to reach USD 57.53 billion by 2031, at a CAGR of 29.40% during the forecast period (2026-2031).
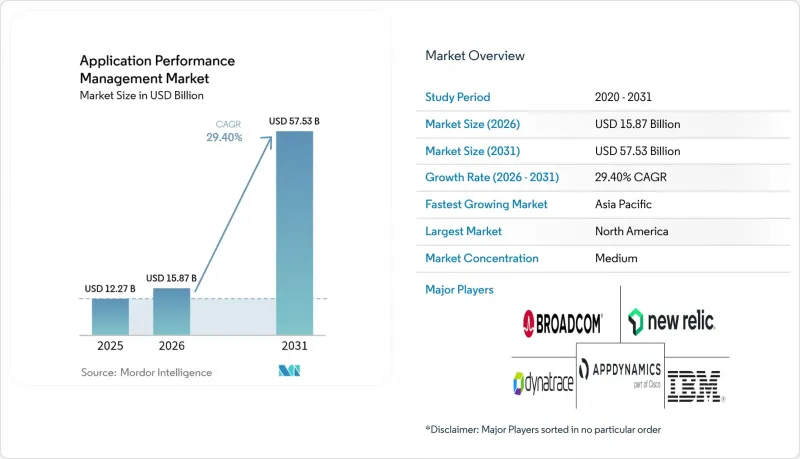
This report is Segmented by Deployment (On-Premise, Cloud), Enterprise Size (SMEs, Large Enterprises), Component (Solutions, Services), Application Type (Web-Based, Mobile, Microservices), End-User Industry (BFSI, IT and Telecom, Retail, Healthcare, Manufacturing, and More), and Geography (North America, South America, Europe, APAC, MEA). The Market Forecasts are Provided in Terms of Value (USD).
Global Application Performance Management Market Trends and Insights
Rapid Shift to Cloud-Native and Micro-Services Architectures
Enterprises replacing monolithic stacks with distributed microservices now orchestrate roughly 35 interconnected components per transaction, a complexity surge that legacy agents cannot trace efficiently. Kubernetes has become the default control plane, and New Relic's eBPF-powered offering auto-discovers every pod and service without code changes. Faster development cycles, up to 40% shorter, intensify the need for continuity between build and run phases. Consequently, demand spikes for distributed tracing, service-mesh visibility, and topology-aware analytics that adjust to ephemeral workloads. Vendors differentiate by correlating metrics, logs, and traces in near real time to keep release velocity from outpacing reliability targets.
Rising Demand for Unified Observability Across DevOps Tool-Chains
Large enterprises routinely juggle five or more monitoring tools, forcing engineers to swivel between dashboards, prolonging incident resolution. OpenTelemetry's rise catalyzes consolidation, letting teams decouple data collection from analysis engines. Firms that collapse tool sprawl into single-pane platforms report 30% quicker resolution times and 25% lower operations overhead. Central governance bodies now vet purchases against cross-domain telemetry requirements, cementing unified observability as a budgetary mandate. The Application Performance Management market, therefore, rewards vendors offering integrated metric, log, trace, and event workflows that accelerate decision loops.
Budget Squeeze from FinOps Optimization of Tool Stacks
FinOps audits expose monitoring spend as a disproportionate slice of cloud bills; one enterprise topped USD 65 million yearly on a single platform. Consumption pricing tied to cardinality drives unpredictable charges, spurring tooling rationalization. Cost-governance startups parse observability invoices, flagging unused licenses and high-water-mark billing that spikes during seasonal peaks. SMEs feel the pinch first, often postponing full-stack monitoring rollouts. Vendors now counter with adaptive data retention, on-demand licensing tiers, and anomaly-based sampling that aligns cost visibility with business value.
Other drivers and restraints analyzed in the detailed report include:
- Proliferation of Mobile and IoT Transactions Requiring Real-Time Insight
- Growth in Digital-First Customer Experience Programs
- Complex, Expensive Licensing Models Limiting Wider Adoption
For complete list of drivers and restraints, kindly check the Table Of Contents.
Segment Analysis
Cloud offerings commanded 62.15% of the Application Performance Management market share in 2025 and are projected to advance at a 32.55% CAGR, confirming SaaS as the default consumption model. Enterprises offload infrastructure management to vendors, unlocking instant global reach and continuous feature delivery. Hybrid models rise where data protection rules keep subsets of telemetry on-site; here, edge agents forward redacted insights to cloud-based AI layers for correlation. Consumption billing aligns cost to load, though it requires vigilance to avoid overruns. Vendors add traffic-aware throttling and adaptive retention so that the Application Performance Management market continues to broaden across verticals with contrasting compliance footprints.
A parallel trend sees observability embedded into multi-cloud blueprints, with single dashboards spanning AWS, Azure, Google Cloud, and private stacks. Users adopt cloud-native APIs over traditional SNMP traps, speeding onboarding. Edge computing pushes monitoring closer to devices, granting sub-second anomaly detection for IoT and low-latency retail. These developments cement cloud deployment as the bellwether of platform innovation, setting the cadence for AI, auto-remediation, and predictive capacity modules.
Large enterprises held a 57.05% share of the Application Performance Management market size in 2025, reflecting entrenched global estates that rely on Tier-1 solutions. These firms prioritize full-stack correlation, often consolidating from five tools to two to streamline workflows. SMEs, however, clock the fastest 33.55% CAGR as SaaS onboarding slashes time-to-value and pay-as-you-go billing lowers entry barriers. Automated instrumentation reduces dependence on scarce observability talent, while AI-translated queries help non-experts extract insights with natural language capabilities boosted by Honeycomb's Grit acquisition.
SMEs gravitate toward modular bundles that grow with workload scale, favoring OpenTelemetry so they can switch analytics back ends without reinstrumenting code. FinOps hygiene is stronger among small teams that track every dollar, encouraging high-visibility usage dashboards. This democratization widens the Application Performance Management market addressable base, compelling vendors to ship "lite" tiers that preserve enterprise-grade security yet simplify onboarding.
Complete Report Scope:
- By Deployment
- On-premise
- Cloud
- By Enterprise Size
- Small and Medium-Sized Enterprises (SMEs)
- Large Enterprises
- By Component
- Solutions
- Application Performance Monitoring and Analytics
- End-User Experience Monitoring
- Infrastructure and Network Monitoring
- Services
- Professional Services
- Managed Services
- Solutions
- By Application Type
- Web-based Applications
- Mobile Applications
- Micro-services and Containerised Workloads
- By End-user Industry
- Banking, Financial Services and Insurance (BFSI)
- Information Technology and Telecommunications
- Retail and E-commerce
- Healthcare and Life Sciences
- Manufacturing
- Government and Public Sector
- Others
- By Geography
- North America
- United States
- Canada
- Mexico
- South America
- Brazil
- Argentina
- Rest of South America
- Europe
- United Kingdom
- Germany
- France
- Italy
- Spain
- Russia
- Rest of Europe
- Asia-Pacific
- China
- Japan
- India
- South Korea
- ASEAN
- Australia and New Zealand
- Rest of Asia-Pacific
- Middle East and Africa
- Middle East
- Saudi Arabia
- United Arab Emirates
- Turkey
- Rest of Middle East
- Africa
- South Africa
- Nigeria
- Rest of Africa
- Middle East
- North America
Geography Analysis
North America retained 37.75% of the Application Performance Management market in 2025, supported by mature cloud ecosystems and a dense vendor landscape led by New Relic, Datadog, and Dynatrace. U.S. banks and hospitals allocate bigger slices of IT spend to observability as compliance regimes tighten, while Canada's telecommunications and energy verticals adopt APM to secure high-availability targets. Mexico sees expanding digital commerce that heightens interest in real-user monitoring.
Asia-Pacific is growing at a 31.25% CAGR, fueled by hyperscaler data-center rollouts across China, India, and Southeast Asia. Government digital agendas and 5G network launches raise expectations for app responsiveness. Japanese and South Korean manufacturers integrate APM into Industry 4.0 lines, focusing on predictive downtime avoidance. Indian IT service providers embed observability into outsourcing contracts to guarantee client SLAs.
Europe shows steady uptake, shaped by GDPR and emerging sovereignty rules that keep data within borders. The U.K. and Germany lead spending, emphasizing OpenTelemetry compliance to minimize lock-in. France grows telehealth adoption, Italy modernizes e-government portals, and the Nordics invest in edge monitoring for green-energy microgrids. Middle East and Africa remain nascent but accelerate as fintech and e-commerce gain prominence.
- Cisco Systems, Inc. (AppDynamics)
- New Relic, Inc.
- Dynatrace, Inc.
- International Business Machines Corporation
- Broadcom Inc. (Including CA Technologies)
- Microsoft Corporation
- Micro Focus International plc
- Datadog, Inc.
- Splunk Inc. (incl. SignalFx)
- Akamai Technologies, Inc.
- SolarWinds Corporation
- Riverbed Technology, Inc.
- Oracle Corporation
- BMC Software, Inc.
- Elastic N.V.
- Instana LLC (IBM)
- ManageEngine - Zoho Corporation Pvt. Ltd.
- LogicMonitor, Inc.
- AppOptics (SolarWinds)
- Correlsense Ltd.
Additional Benefits:
- The market estimate (ME) sheet in Excel format
- 3 months of analyst support
TABLE OF CONTENTS
1 INTRODUCTION
- 1.1 Study Assumptions and Market Definition
- 1.2 Scope of the Study
2 RESEARCH METHODOLOGY
3 EXECUTIVE SUMMARY
4 MARKET LANDSCAPE
- 4.1 Market Overview
- 4.2 Market Drivers
- 4.2.1 Rapid shift to cloud-native and micro-services architectures
- 4.2.2 Rising demand for unified observability across DevOps tool-chains
- 4.2.3 Proliferation of mobile and IoT transactions requiring real-time insight
- 4.2.4 Growth in digital-first customer experience programs
- 4.2.5 AI-driven auto-remediation reducing MTTR (under-reported)
- 4.2.6 Edge-to-core performance data monetisation by telecom operators (under-reported)
- 4.3 Market Restraints
- 4.3.1 Budget squeeze from FinOps optimisation of tool stacks
- 4.3.2 Complex, expensive licensing models limiting wider adoption
- 4.3.3 Skill-set gap in distributed-tracing and open telemetry (under-reported)
- 4.3.4 Data-sovereignty hurdles for cross-border APM data lakes (under-reported)
- 4.4 Value Chain Analysis
- 4.5 Regulatory Landscape
- 4.6 Technological Outlook
- 4.7 Porter's Five Forces Analysis
- 4.7.1 Bargaining Power of Suppliers
- 4.7.2 Bargaining Power of Buyers
- 4.7.3 Threat of New Entrants
- 4.7.4 Threat of Substitute Products
- 4.7.5 Intensity of Competitive Rivalry
- 4.8 Impact of Macro-Economic Shifts
5 MARKET SIZE AND GROWTH FORECASTS (VALUE)
- 5.1 By Deployment
- 5.1.1 On-premise
- 5.1.2 Cloud
- 5.2 By Enterprise Size
- 5.2.1 Small and Medium-Sized Enterprises (SMEs)
- 5.2.2 Large Enterprises
- 5.3 By Component
- 5.3.1 Solutions
- 5.3.1.1 Application Performance Monitoring and Analytics
- 5.3.1.2 End-User Experience Monitoring
- 5.3.1.3 Infrastructure and Network Monitoring
- 5.3.2 Services
- 5.3.2.1 Professional Services
- 5.3.2.2 Managed Services
- 5.3.1 Solutions
- 5.4 By Application Type
- 5.4.1 Web-based Applications
- 5.4.2 Mobile Applications
- 5.4.3 Micro-services and Containerised Workloads
- 5.5 By End-user Industry
- 5.5.1 Banking, Financial Services and Insurance (BFSI)
- 5.5.2 Information Technology and Telecommunications
- 5.5.3 Retail and E-commerce
- 5.5.4 Healthcare and Life Sciences
- 5.5.5 Manufacturing
- 5.5.6 Government and Public Sector
- 5.5.7 Others
- 5.6 By Geography
- 5.6.1 North America
- 5.6.1.1 United States
- 5.6.1.2 Canada
- 5.6.1.3 Mexico
- 5.6.2 South America
- 5.6.2.1 Brazil
- 5.6.2.2 Argentina
- 5.6.2.3 Rest of South America
- 5.6.3 Europe
- 5.6.3.1 United Kingdom
- 5.6.3.2 Germany
- 5.6.3.3 France
- 5.6.3.4 Italy
- 5.6.3.5 Spain
- 5.6.3.6 Russia
- 5.6.3.7 Rest of Europe
- 5.6.4 Asia-Pacific
- 5.6.4.1 China
- 5.6.4.2 Japan
- 5.6.4.3 India
- 5.6.4.4 South Korea
- 5.6.4.5 ASEAN
- 5.6.4.6 Australia and New Zealand
- 5.6.4.7 Rest of Asia-Pacific
- 5.6.5 Middle East and Africa
- 5.6.5.1 Middle East
- 5.6.5.1.1 Saudi Arabia
- 5.6.5.1.2 United Arab Emirates
- 5.6.5.1.3 Turkey
- 5.6.5.1.4 Rest of Middle East
- 5.6.5.2 Africa
- 5.6.5.2.1 South Africa
- 5.6.5.2.2 Nigeria
- 5.6.5.2.3 Rest of Africa
- 5.6.5.1 Middle East
- 5.6.1 North America
6 COMPETITIVE LANDSCAPE
- 6.1 Market Concentration
- 6.2 Strategic Moves
- 6.3 Market Share Analysis
- 6.4 Company Profiles (includes Global level Overview, Market level overview, Core Segments, Financials as available, Strategic Information, Market Rank/Share for key companies, Products and Services, and Recent Developments)
- 6.4.1 Cisco Systems, Inc. (AppDynamics)
- 6.4.2 New Relic, Inc.
- 6.4.3 Dynatrace, Inc.
- 6.4.4 International Business Machines Corporation
- 6.4.5 Broadcom Inc. (Including CA Technologies)
- 6.4.6 Microsoft Corporation
- 6.4.7 Micro Focus International plc
- 6.4.8 Datadog, Inc.
- 6.4.9 Splunk Inc. (incl. SignalFx)
- 6.4.10 Akamai Technologies, Inc.
- 6.4.11 SolarWinds Corporation
- 6.4.12 Riverbed Technology, Inc.
- 6.4.13 Oracle Corporation
- 6.4.14 BMC Software, Inc.
- 6.4.15 Elastic N.V.
- 6.4.16 Instana LLC (IBM)
- 6.4.17 ManageEngine - Zoho Corporation Pvt. Ltd.
- 6.4.18 LogicMonitor, Inc.
- 6.4.19 AppOptics (SolarWinds)
- 6.4.20 Correlsense Ltd.
7 MARKET OPPORTUNITIES AND FUTURE OUTLOOK
- 7.1 White-space and Unmet-Need Assessment

