
PUBLISHER: Mordor Intelligence | PRODUCT CODE: 1851183

PUBLISHER: Mordor Intelligence | PRODUCT CODE: 1851183
Recreation Services - Market Share Analysis, Industry Trends & Statistics, Growth Forecasts (2025 - 2030)
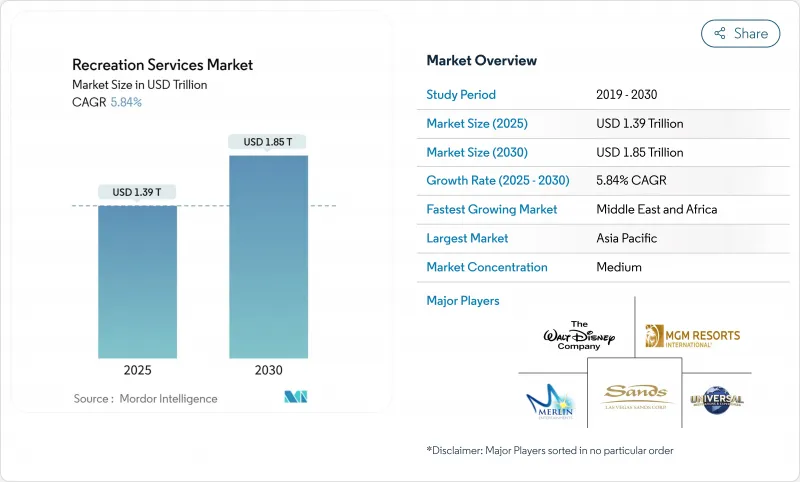
The recreation services market size stands at USD 1.32 trillion in 2024 and is set to climb to USD 1.85 trillion by 2030, reflecting a 5.8% CAGR.
Strong forward bookings, resilient ticket-price uplifts, and expanding private construction outlays confirm that demand rather than stimulus propels the expansion. Operators with effective pricing leverage are already capturing wider recreation services market share, and the fundamental belief that physical venues remain central to leisure budgets persists even as digital options multiply. Investors highlight three secular currents underpinning growth: digital-physical integration that extends spending beyond entry gates, Asia-Pacific's enlarging middle class channeling discretionary income into leisure travel, and increasingly differentiated visitor preferences that reward tailored experiences over one-size-fits-all models. Compact, content-rich attractions are now achieving cash-on-cash returns comparable to mega-parks when supported by data analytics and agile pricing, opening the field to a broader developer base and injecting fresh competition into the recreation services market.
Global Recreation Services Market Trends and Insights
Consumer-Led Shift Toward Experiential Leisure in Asia-Pacific
Ticketing reforms, streamlined visas, and rising disposable incomes continue to boost intra-regional trips across Asia-Pacific . Macao's mass-gaming revenue grew 14% year on year in Q3 2024 even though arrivals lagged 2019 levels, showing that spend per visitor is climbing. Operators tailoring shows and branded retail to local culture capture longer dwell times, driving repeat visits and fortifying recreation services market share in the region. Parallel policy frameworks encourage wellness and culinary products that blunt volatility in gaming income, securing a broader experiential base for steady growth.
Surge of IP-Centric Theme Parks
Parks anchored in well-known film, comic, or gaming franchises systematically post higher retail sales per head than non-IP properties . Universal Orlando's Epic Universe opening on 22 May 2025 will add 50 attractions across five themed lands, and state modelling projects USD 2 billion of first-year regional output. Retail corridors sited beside key rides convert affinity into merchandise sales, reinforcing brand loyalty and creating a protective cash-flow buffer for the recreation services industry during broader economic dips.
High Up-Front CAPEX for Experiential Venues
Global reconstruction-cost indices show material and labour inputs rising 4.6% year on year in 2024. Flagship projects frequently exceed USD 500 million, exemplified by Marina Bay Sands' USD 8 billion second-phase expansion. Smaller developers often pivot to joint ventures or license agreements to curb financial risk, but extended capital cycles slow net new supply and reinforce pricing discipline across the recreation services market.
Other drivers and restraints analyzed in the detailed report include:
- Casino-Resort Non-Gaming Diversification
- Urban Revitalization via Cultural Anchors
- Rising Liability-Insurance Premiums for High-Thrill Attractions
For complete list of drivers and restraints, kindly check the Table Of Contents.
Segment Analysis
Amusement parks and water parks accounted for a little over half of the 2024 revenue in the recreation services market size. These venues achieve high guest spend by blending branded retail, themed food, and paid queue-skipping products, and reinvestment cycles can often be funded organically. Sports facilities and events occupy a smaller base yet carry the swiftest expansion track at 7% CAGR through 2030. Marathon calendars, esports leagues, and global tournaments channel infrastructure spend forward, accelerating cash flow earlier in project cycles and adding fresh content streams that broaden the recreation services market.
Capital discipline signals a strategic pivot. Parks once seen as capital-heavy are refining their footprints into compact, content-rich formats. In parallel, smaller-scale sports stadiums pursue flexible configurations to host everything from urban-trail races to drone competitions. This versatility allows operators to maximise utilisation and stabilise revenue across seasons, securing a stronger recreation services market share for players agile enough to pivot.
Admission tickets supplied 58% of worldwide revenue in 2024, making them the cornerstone of the recreation services market size. Operators nonetheless report incremental gains from food and beverage as chef partnerships and festival-style tastings draw spend that does not extend queue times. Amid fluctuating attendance cycles, premium dining becomes a hedge that cushions cash flows even during softer visitation weeks.
Brand collaborations provide further upside. Consumer-goods partners purchase geo-targeted activations that reach audiences during extended dwell times. This sponsorship revenue grows without relying on gates, so operators fortify earnings resilience as macro volatility waxes and wanes. Improved analytics help refine menu assortments and forecast demand, boosting margins and flagging new cross-sell prospects in the recreation services market.
Recreational Services Market is Segmented by Type (Amusements (Theme and Water Parks), Gambling and Casino, and More), Revenue Stream (Admission/Ticket Sales, Food and Beverage, Merchandise and Licensing, and More), Age Group (<18 Years, 18-35 Years, 36-55 Years, 55+ Years), Mode (On-site/Physical, Online and Virtual Experiences) and Geography. The Market Forecasts are Provided in Terms of Value (USD).
Geography Analysis
Asia-Pacific commanded 34% of global revenue in 2024, the largest regional recreation services market share. Expanded intra-Asia flights and domestic tourism stimulus in China, Japan, and South Korea sustain capacity growth. Macao recorded USD 6.1 billion in mass-gaming receipts during Q3 2024, even with visitor volumes below 2019, underscoring rising yield per guest. Secondary Indian cities commission mid-scale water parks aligned with local climate and land costs, indicating depth beyond tier-one urban centres and reinforcing the recreation services market size outlook.
North America remains the innovation hub of the recreation services industry. Private construction spending on amusement and recreation projects reached USD 16.9 billion in April 2024, topping pre-pandemic peaks. Integrated resorts bolster non-gaming revenue through arena residencies and interactive art, demonstrating that a mature market still captures new demand layers. Policy stability, robust financing channels, and a culture of entertainment experimentation support a diversified pipeline that nourishes the broader recreation services market.
The Middle East and Africa post the fastest forecast CAGR, close to 8% through 2030. Sovereign-backed giga-projects in Saudi Arabia, Qatar, and the United Arab Emirates funnel capital into mixed-reality arenas, indoor surf lagoons, and heritage revitalisation. Saudi Arabia's ambition of hosting 150 million visitors by 2030 drivesnearly year-roundd indoor attractions that offset desert seasonality. Combined, these initiatives broaden the recreation services market size and extend tourism benefits beyond traditional beach and pilgrimage corridors.
- The Walt Disney Company
- Universal Destinations & Experiences (Comcast)
- Merlin Entertainments Group
- SeaWorld Entertainment Inc.
- Six Flags Entertainment Corp.
- Cedar Fair L.P.
- Las Vegas Sands Corp.
- MGM Resorts International
- Galaxy Entertainment Group
- Wynn Resorts Ltd.
- Live Nation Entertainment Inc.
- Madison Square Garden Entertainment Corp.
- Bourne Leisure Holdings Ltd.
- Palace Entertainment (Parques Reunidos)
- Parques Reunidos Servicios Centrales, S.A.
- Chimelong Group
- Carnival Corporation & plc
- SeaWorld Parks & Entertainment
- Merlin Entertainments Group
- Parques Reunidos
Additional Benefits:
- The market estimate (ME) sheet in Excel format
- 3 months of analyst support
TABLE OF CONTENTS
1 INTRODUCTION
- 1.1 Study Assumptions and Market Definition
- 1.2 Scope of the Study
2 RESEARCH METHODOLOGY
3 EXECUTIVE SUMMARY
4 MARKET LANDSCAPE
- 4.1 Market Overview
- 4.2 Market Drivers
- 4.2.1 Consumer-led Shift Toward Experiential Leisure Travel in Asia-Pacific
- 4.2.2 Surge of IP-based Theme Parks Tied to Global Media Franchises
- 4.2.3 Casino-Integrated Resorts Driving Non-gaming Revenue Diversification in North America
- 4.2.4 Government Urban-Revitalization Programs Spurring Cultural Attractions in Europe
- 4.2.5 Sports-Tourism Campaigns Ahead of 2028 Los Angeles and 2032 Brisbane Olympics
- 4.2.6 Rapid Adoption of AR/VR Attractions to Boost Per-capita Spend in GCC
- 4.3 Market Restraints
- 4.3.1 High Up-front CAPEX for Large-scale Experiential Venues (>US $500 mn)
- 4.3.2 Rising Liability-insurance Premiums for High-thrill Attractions
- 4.3.3 Talent Shortages in Specialised Live-event Operations Post-COVID
- 4.3.4 Intensifying ESG Scrutiny on Animal-based Entertainment
- 4.4 Porter's Five Forces Analysis
- 4.4.1 Threat of New Entrants
- 4.4.2 Bargaining Power of Buyers
- 4.4.3 Bargaining Power of Suppliers
- 4.4.4 Threat of Substitutes
- 4.4.5 Intensity of Competitive Rivalry
- 4.5 Investment Analysis
5 MARKET SIZE AND GROWTH FORECASTS (VALUE)
- 5.1 By Type
- 5.1.1 Amusements
- 5.1.1.1 Theme and Water Parks
- 5.1.1.2 Gambling and Casinos
- 5.1.1.3 Cultural and Heritage Attractions (Museums, Galleries, Zoos)
- 5.1.1.4 Sports Facilities and Events
- 5.1.1 Amusements
- 5.2 By Revenue Stream
- 5.2.1 Admission / Ticket Sales
- 5.2.2 Food and Beverage
- 5.2.3 Merchandise and Licensing
- 5.2.4 Sponsorship and Advertising
- 5.3 By Age Group
- 5.3.1 <18 Years
- 5.3.2 18-35 Years
- 5.3.3 36-55 Years
- 5.3.4 55+ Years
- 5.4 By Mode
- 5.4.1 On-site / Physical
- 5.4.2 Online and Virtual Experiences
- 5.5 By Geography
- 5.5.1 North America
- 5.5.1.1 United States
- 5.5.1.2 Canada
- 5.5.2 Latin America
- 5.5.2.1 Brazil
- 5.5.2.2 Argentina
- 5.5.2.3 Mexico
- 5.5.2.4 Rest of Latin America
- 5.5.3 Europe
- 5.5.3.1 Germany
- 5.5.3.2 United Kingdom
- 5.5.3.3 France
- 5.5.3.4 Italy
- 5.5.3.5 Spain
- 5.5.3.6 Rest of Europe
- 5.5.4 Asia-Pacific
- 5.5.4.1 China
- 5.5.4.2 Japan
- 5.5.4.3 South Korea
- 5.5.4.4 India
- 5.5.4.5 Australia
- 5.5.4.6 New Zealand
- 5.5.4.7 Rest of Asia-Pacific
- 5.5.5 Middle East and Africa
- 5.5.5.1 United Arab Emirates
- 5.5.5.2 Saudi Arabia
- 5.5.5.3 South Africa
- 5.5.5.4 Rest of Middle East and Africa
- 5.5.1 North America
6 COMPETITIVE LANDSCAPE
- 6.1 Strategic Developments
- 6.2 Vendor Positioning Analysis
- 6.3 Company Profiles (includes Global level Overview, Market level overview, Core Segments, Financials as available, Strategic Information, Products and Services, and Recent Developments)
- 6.3.1 The Walt Disney Company
- 6.3.2 Universal Destinations & Experiences (Comcast)
- 6.3.3 Merlin Entertainments Group
- 6.3.4 SeaWorld Entertainment Inc.
- 6.3.5 Six Flags Entertainment Corp.
- 6.3.6 Cedar Fair L.P.
- 6.3.7 Las Vegas Sands Corp.
- 6.3.8 MGM Resorts International
- 6.3.9 Galaxy Entertainment Group
- 6.3.10 Wynn Resorts Ltd.
- 6.3.11 Live Nation Entertainment Inc.
- 6.3.12 Madison Square Garden Entertainment Corp.
- 6.3.13 Bourne Leisure Holdings Ltd.
- 6.3.14 Palace Entertainment (Parques Reunidos)
- 6.3.15 Parques Reunidos Servicios Centrales, S.A.
- 6.3.16 Chimelong Group
- 6.3.17 Carnival Corporation & plc
- 6.3.18 SeaWorld Parks & Entertainment
- 6.3.19 Merlin Entertainments Group
- 6.3.20 Parques Reunidos
7 MARKET OPPORTUNITIES AND FUTURE OUTLOOK
- 7.1 White-space and Unmet-need Assessment

