
Need help finding what you are looking for?
Contact Us
PUBLISHER: Mordor Intelligence | PRODUCT CODE: 1687304

PUBLISHER: Mordor Intelligence | PRODUCT CODE: 1687304
Fresh Apple - Market Share Analysis, Industry Trends & Statistics, Growth Forecasts (2025 - 2030)
PUBLISHED:
PAGES: 143 Pages
DELIVERY TIME: 2-3 business days
SELECT AN OPTION
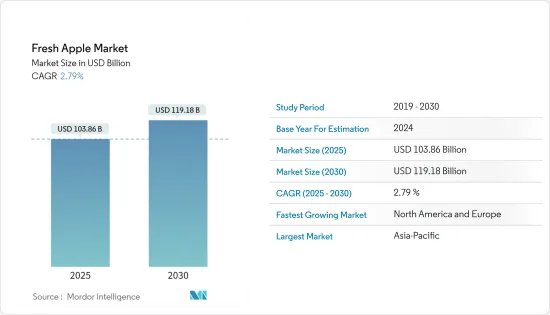
The Fresh Apple Market size is estimated at USD 103.86 billion in 2025, and is expected to reach USD 119.18 billion by 2030, at a CAGR of 2.79% during the forecast period (2025-2030).
Key Highlights
- Apples, a globally cultivated edible fruit, are packed with fiber, Vitamin C, and antioxidants, all while being low in calories. Their low calorie and fat content aids in weight management and overall health, making them a favorite among consumers and a staple recommendation from health professionals.
- In recent years, the fresh apple market has seen significant growth, driven by a rising demand for fresh produce in emerging and developing nations. Factors such as heightened awareness of health benefits, the introduction of new hybrid varieties, and an uptick in contract farming have all contributed to this global market expansion. The United States Department of Agriculture reports the production of apples at 83.7 million metric tons, which has increased by 1% as compared to the previous year, largely due to a production surge in the U.S. and China. Notably, these two nations have compensated for production shortfalls in the European Union and Turkey.
- The Asia-Pacific region leads the world in fresh apple production and consumption and is poised to maintain its dominance. This is driven by rising production and consumption levels, bolstered by robust distribution channels. Some of the key markets of apples in the region include China, India, South Korea, Japan, Australia, New Zealand, etc, amongst others. China stands as the dominant player in the global fresh apple in terms of consumption. Factors fueling China's fresh apple consumption include rising incomes, heightened health awareness, evolving dietary preferences, innovative marketing strategies, and advancements in cold-chain logistics. Moreover, the rise of e-commerce, and chain fruit stores, has streamlined fruit purchasing, boosting consumption in China's third and fourth-tier cities.
Fresh Apple Market Trends
Increasing Demand for Organic Apples
- Across North America, consumers increasingly gravitate towards organic apples, driven by heightened health and wellness concerns. For example, the United States Department of Agriculture (USDA) reported that in 2022, the annual per capita consumption of fresh apples in the U.S. stood at 7.15 Kg. Furthermore, USDA data reveals that organic apples make up 16% of the nation's total apple consumption and occupy 30% of the land dedicated to apple cultivation. Apart from the United States, Canada as well has been witnessing a surge in demand for organic apples. Organic apples, when compared to their conventionally grown counterparts and other fruits, boast naturally lower sugar content and higher fiber levels. This distinction has fueled a significant demand for organic apples in Canada. Data from the ITC Trade Map indicates that in 2023, Canada imported organic apples valued at over USD 28 million, predominantly featuring varieties like Gala, Granny Smith, and Honey Crisp.
- In Europe, higher-income groups are increasingly willing to pay a premium for organic apples, viewing it as an investment in their health. Despite a recent decline in apple acreage and production across Europe, the demand for organic apples has surged, leading to a burgeoning organic apple sector. Currently, statistics from independent research show that Italy's organic apple market represents 5-10% of the nation's total apple production. While this share has remained stable over time, the area dedicated to organic production is on the rise. The Benelux market, a focus of the It's Bio project, is witnessing robust demand for organic apples. Projections from IFOAM Organics Europe suggest Benelux market will expand at a compound annual growth rate (CAGR) of over 10% by 2027. Although conventional apple yields surpass those of organic varieties, organic apples consistently fetch a price premium throughout the supply chain, from farm-gate to wholesale and retail.
Asia-Pacific Leads Apple Consumption
- Within Asia-Pacific, China stands out as the globe's top apple producer. Apples reign as the most favored fruit in China. In 2023, China produced 49.6 million metric tons of apples, marking a 4% increase from the previous year, as reported by the National Bureau of Statistics of China. The surge in private sector investments has paved the way for the rapid emergence of corporate and specialized farms in apple cultivation. These operations are increasingly adopting modern production models and technologies to boost both productivity and quality.
- New Zealand ranks among the world's top ten largest apple exporters, with export value reaching USD 533 million in 2023, according to ITC Trademap data. The United States Department of Agriculture forecasts an increase in apple production in the country to 560,000 metric tons for 2024. Key growing regions such as Hawke's Bay, Tasman, and Central Otago provide optimal conditions for apple cultivation, including adequate winter chilling, warm springs, extended summer sunshine hours, and dry growing areas. Consequently, both production and exports are expected to rise in the coming years.
- Data from ITC Trademap reveals that India's fresh apple imports reached 469 thousand metric tons in 2023, marking a 77 thousand metric tons increase from 2022. As India's population grows, so does its appetite for healthier foods, driving a continuous rise in apple consumption. The United States Department of Agriculture (USDA) forecasts a 6 percent boost in India's domestic apple production for the marketing year 2024, attributing this to favorable weather in key apple-growing areas. Furthermore, USDA anticipates a 10 percent surge in apple imports for 2024, underscoring the expanding market driven by a demand for premium-quality apples.
Additional Benefits:
- The market estimate (ME) sheet in Excel format
- 3 months of analyst support
Product Code: 60940
TABLE OF CONTENTS
1 INTRODUCTION
- 1.1 Study Assumptions and Market Definition
- 1.2 Scope of the Study
2 RESEARCH METHODOLOGY
3 EXECUTIVE SUMMARY
4 MARKET DYNAMICS
- 4.1 Market Overview
- 4.2 Market Drivers
- 4.2.1 Development of Newer Varieties
- 4.2.2 Rising Demand for Organic Apples
- 4.2.3 Demand for Food Processing Industry
- 4.3 Market Restraints
- 4.3.1 Production Fluctuations Due To Climatic Adversities
- 4.3.2 Pest and Disease Outbreaks
- 4.4 Value Chain Analysis
5 MARKET SEGMENTATION
- 5.1 Geography
- 5.1.1 North America
- 5.1.1.1 United States
- 5.1.1.1.1 Production Analysis by Volume
- 5.1.1.1.2 Consumption Analysis by Value and Volume
- 5.1.1.1.3 Import Analysis by Value and Volume
- 5.1.1.1.4 Export Analysis by Value and Volume
- 5.1.1.1.5 Wholesale Price Trend Analysis
- 5.1.1.2 Canada
- 5.1.1.2.1 Production Analysis by Volume
- 5.1.1.2.2 Consumption Analysis by Value and Volume
- 5.1.1.2.3 Import Analysis by Value and Volume
- 5.1.1.2.4 Export Analysis by Value and Volume
- 5.1.1.2.5 Wholesale Price Trend Analysis
- 5.1.1.3 Mexico
- 5.1.1.3.1 Production Analysis by Volume
- 5.1.1.3.2 Consumption Analysis by Value and Volume
- 5.1.1.3.3 Import Analysis by Value and Volume
- 5.1.1.3.4 Export Analysis by Value and Volume
- 5.1.1.3.5 Wholesale Price Trend Analysis
- 5.1.2 Europe
- 5.1.2.1 Germany
- 5.1.2.1.1 Production Analysis by Volume
- 5.1.2.1.2 Consumption Analysis by Value and Volume
- 5.1.2.1.3 Import Analysis by Value and Volume
- 5.1.2.1.4 Export Analysis by Value and Volume
- 5.1.2.1.5 Wholesale Price Trend Analysis
- 5.1.2.2 United Kingdom
- 5.1.2.2.1 Production Analysis by Volume
- 5.1.2.2.2 Consumption Analysis by Value and Volume
- 5.1.2.2.3 Import Analysis by Value and Volume
- 5.1.2.2.4 Export Analysis by Value and Volume
- 5.1.2.2.5 Wholesale Price Trend Analysis
- 5.1.2.3 Poland
- 5.1.2.3.1 Production Analysis by Volume
- 5.1.2.3.2 Consumption Analysis by Value and Volume
- 5.1.2.3.3 Import Analysis by Value and Volume
- 5.1.2.3.4 Export Analysis by Value and Volume
- 5.1.2.3.5 Wholesale Price Trend Analysis
- 5.1.2.4 Italy
- 5.1.2.4.1 Production Analysis by Volume
- 5.1.2.4.2 Consumption Analysis by Value and Volume
- 5.1.2.4.3 Import Analysis by Value and Volume
- 5.1.2.4.4 Export Analysis by Value and Volume
- 5.1.2.4.5 Wholesale Price Trend Analysis
- 5.1.2.5 France
- 5.1.2.5.1 Production Analysis by Volume
- 5.1.2.5.2 Consumption Analysis by Value and Volume
- 5.1.2.5.3 Import Analysis by Value and Volume
- 5.1.2.5.4 Export Analysis by Value and Volume
- 5.1.2.5.5 Wholesale Price Trend Analysis
- 5.1.2.6 Turkey
- 5.1.2.6.1 Production Analysis by Volume
- 5.1.2.6.2 Consumption Analysis by Value and Volume
- 5.1.2.6.3 Import Analysis by Value and Volume
- 5.1.2.6.4 Export Analysis by Value and Volume
- 5.1.2.6.5 Wholesale Price Trend Analysis
- 5.1.3 Asia-Pacific
- 5.1.3.1 China
- 5.1.3.1.1 Production Analysis by Volume
- 5.1.3.1.2 Consumption Analysis by Value and Volume
- 5.1.3.1.3 Import Analysis by Value and Volume
- 5.1.3.1.4 Export Analysis by Value and Volume
- 5.1.3.1.5 Wholesale Price Trend Analysis
- 5.1.3.2 New Zealand
- 5.1.3.2.1 Production Analysis by Volume
- 5.1.3.2.2 Consumption Analysis by Value and Volume
- 5.1.3.2.3 Import Analysis by Value and Volume
- 5.1.3.2.4 Export Analysis by Value and Volume
- 5.1.3.2.5 Wholesale Price Trend Analysis
- 5.1.3.3 Japan
- 5.1.3.3.1 Production Analysis by Volume
- 5.1.3.3.2 Consumption Analysis by Value and Volume
- 5.1.3.3.3 Import Analysis by Value and Volume
- 5.1.3.3.4 Export Analysis by Value and Volume
- 5.1.3.3.5 Wholesale Price Trend Analysis
- 5.1.3.4 India
- 5.1.3.4.1 Production Analysis by Volume
- 5.1.3.4.2 Consumption Analysis by Value and Volume
- 5.1.3.4.3 Import Analysis by Value and Volume
- 5.1.3.4.4 Export Analysis by Value and Volume
- 5.1.3.4.5 Wholesale Price Trend Analysis
- 5.1.4 South America
- 5.1.4.1 Brazil
- 5.1.4.1.1 Production Analysis by Volume
- 5.1.4.1.2 Consumption Analysis by Value and Volume
- 5.1.4.1.3 Import Analysis by Value and Volume
- 5.1.4.1.4 Export Analysis by Value and Volume
- 5.1.4.1.5 Wholesale Price Trend Analysis
- 5.1.4.2 Argentina
- 5.1.4.2.1 Production Analysis by Volume
- 5.1.4.2.2 Consumption Analysis by Value and Volume
- 5.1.4.2.3 Import Analysis by Value and Volume
- 5.1.4.2.4 Export Analysis by Value and Volume
- 5.1.4.2.5 Wholesale Price Trend Analysis
- 5.1.4.3 Chile
- 5.1.4.3.1 Production Analysis by Volume
- 5.1.4.3.2 Consumption Analysis by Value and Volume
- 5.1.4.3.3 Import Analysis by Value and Volume
- 5.1.4.3.4 Export Analysis by Value and Volume
- 5.1.4.3.5 Wholesale Price Trend Analysis
- 5.1.5 Middle East and Africa
- 5.1.5.1 South Africa
- 5.1.5.1.1 Production Analysis by Volume
- 5.1.5.1.2 Consumption Analysis by Value and Volume
- 5.1.5.1.3 Import Analysis by Value and Volume
- 5.1.5.1.4 Export Analysis by Value and Volume
- 5.1.5.1.5 Wholesale Price Trend Analysis
- 5.1.5.2 Egypt
- 5.1.5.2.1 Production Analysis by Volume
- 5.1.5.2.2 Consumption Analysis by Value and Volume
- 5.1.5.2.3 Import Analysis by Value and Volume
- 5.1.5.2.4 Export Analysis by Value and Volume
- 5.1.5.2.5 Wholesale Price Trend Analysis
- 5.1.1 North America
6 MARKET OPPORTUNITIES AND FUTURE TRENDS
Have a question?


SELECT AN OPTION
Have a question?
Questions? Please give us a call or visit the contact form.