
PUBLISHER: Mordor Intelligence | PRODUCT CODE: 1939026

PUBLISHER: Mordor Intelligence | PRODUCT CODE: 1939026
Shipping Containers - Market Share Analysis, Industry Trends & Statistics, Growth Forecasts (2026 - 2031)
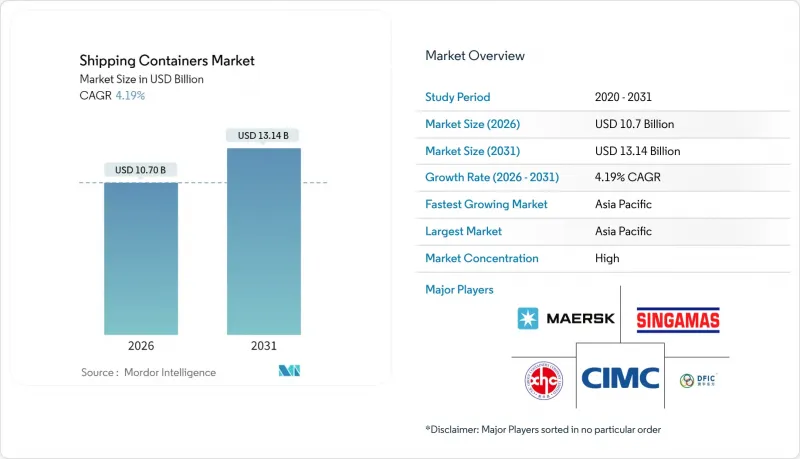
Shipping Containers market size in 2026 is estimated at USD 10.7 billion, growing from 2025 value of USD 10.27 billion with 2031 projections showing USD 13.14 billion, growing at 4.19% CAGR over 2026-2031.
E-commerce fulfillment, pharmaceutical cold-chain expansion, and rising intermodal efficiency provide stable, structural demand. Containerization's role in handling 90% of global trade underpins this growth, while digital tracking tools and smarter designs help operators shorten port stays and boost asset turnover. Sustainability targets are pushing material innovation toward lighter composites, and alliance restructuring among carriers is reshaping capacity deployment strategies in favor of larger, technology-enabled fleets. Geopolitical disruptions add short-term volatility but also reinforce the importance of diversified trade lanes and dynamic routing.
Global Shipping Containers Market Trends and Insights
Explosive Growth of Cross-Border E-Commerce Creating 24-Hour Turnaround Expectations
E-commerce expansion drives more frequent, smaller shipments, shifting focus from vessel capacity toward port velocity. Carriers commit additional equipment to high-frequency loops, while ports invest in automated cranes that clear vessels inside one shift. Smart tracking allows shippers to pre-clear customs and book rail slots before docking. These operational gains shorten inventory cycles and reinforce preference for standard dry boxes, keeping utilization high even when trade volumes fluctuate. As online marketplaces penetrate emerging economies, the shipping container market sees sustained baseline demand across diverse trade lanes.
Worldwide Cold-Chain Penetration Accelerates Advanced Reefer Orders
Pharmaceutical producers are migrating long-haul shipments from air to ocean to cut costs and emissions without compromising temperature control. Modern reefers maintain +-0.5 °C accuracy and integrate telemetry that flags deviations in real time, allowing corrective actions mid-voyage. Fresh grocery exporters adopt similar technology to reach distant consumers with minimal spoilage. Manufacturers offering dual-fuel refrigeration units reduce energy consumption and meet low-GWP regulations, enabling higher price realisation per box. As grocery e-commerce extends to new markets, advanced reefer demand continues to outpace general cargo growth.
Post-Pandemic Oversupply of Boxes Eroding Utilization Rates
Record new builds made during 2021-2023 create a temporary surplus, pushing lease rates down and prompting operators to delay fresh orders. Idle inventories accumulate in gateway ports when trade softens, forcing depots to lower storage fees to attract repositioning business. Manufacturers adapt by trimming production shifts and redirecting capacity toward specialized designs with steadier demand. The correction is expected to resolve once scrappage catches up with ageing fleets and trade normalizes.
Other drivers and restraints analyzed in the detailed report include:
- Direct-to-Consumer Brands Demanding Bespoke, Logo-Printed Containers
- Corporate ESG Mandates Pushing Reusable Container Adoption
- Volatility in Hot-Rolled Coil Steel Prices Creating Budget Uncertainty
For complete list of drivers and restraints, kindly check the Table Of Contents.
Segment Analysis
High-cube offerings are capturing incremental demand because their 13% extra headroom maximizes volumetric loads such as e-commerce parcels and lightweight consumer electronics. 40-ft formats generated 52.21% revenue in 2025, demonstrating entrenched popularity for ocean freight, whereas 40-ft high-cube units are forecast to grow at 5.43% CAGR to 2031. The shipping container market size for high-cube units reflects shipper preference for greater capacity without breaching weight restrictions.
Port infrastructure upgrades accommodate taller stacks, and terminal operators add reach-stackers with extended lifting heights to handle these units efficiently. Logistics integrators promote standardization on the 40-ft profile to streamline rail wagon allocation and depot interchange. Triton Containers markets high-cube leases with flexible pick-up options to reduce repositioning, reinforcing adoption. Overall, shipper focus on cubic efficiency and consolidation of packaging drives continued high-cube traction across primary trade corridors.
Dry storage boxes accounted for 72.32% of 2025 shipments, underscoring their status as the backbone of global commodity flows. In contrast, reefer units record a 6.18% CAGR to 2031 as fresh produce exporters and drug makers scale ocean routes. Refrigerated boxes currently represent the premium slice of the shipping container market, commanding rental rates two to three times higher than dry units.
Technology upgrades include variable-speed compressors and solar-assisted power modules that cut energy draw during idle periods. Pharmaceutical shippers require redundant temperature probes and door sensors that trigger alerts within seconds of deviation, driving differentiation among manufacturers. Reefers also benefit from decarbonization, as shifting temperature-sensitive goods from air to sea avoids up to 80% of related emissions.
The Shipping Container Market is Segmented by Size (20-Ft (TEU), 40-Ft (FEU) and More), by Container Type (Dry Storage (Standard), Refrigerated, and More), by Material (Corten Steel, Stainless Steel and More), End-Use Industry (Consumer Goods & Retail and More), by Mode of Transport (Maritime Deep-Sea and More), by Geography (North America, South America, and More). The Market Forecasts are Provided in Terms of Value (USD).
Geography Analysis
Asia-Pacific dominated the shipping containers market with 59.88% revenue in 2025 and is set to grow at a 5.46% CAGR to 2031. China retains manufacturing leadership, yet Southeast Asia captures incremental volumes as firms diversify sourcing. Malaysian and Indian mega-port projects add more than 25 million TEU of annual capacity, anchoring regional throughput and stimulating container demand across feeder networks. Currency stability and supportive trade agreements also encourage regional leasing pools to expand their fleets.
North America benefits from nearshoring that shifts electronics and automotive assembly closer to consumption markets. United States port authorities approve multi-billion-dollar dredging and berth electrification programs, enhancing competitiveness against Mexican and Canadian gateways. The rail intermodal build-out across the Midwest unlocks cost-effective land bridges that connect Atlantic and Pacific basins in under eight days, driving uptake of stack-train compatible container designs.
Europe records mixed growth shipping container market as geopolitical tensions divert Asia-Europe sailings around Africa, extending transit times but also directing additional calls to Mediterranean hubs. Investments in automation at London Gateway and Rotterdam Maasvlakte raise throughput per crane hour, cushioning cost-per-box metrics. Stringent environmental regulations accelerate the retirement of older, heavier boxes in favor of recycled-content steel units, supporting replacement demand despite subdued trade volume growth.
- China International Marine Containers (CIMC)
- Dong Fang International Containers
- CXIC Group (CSSC)
- Maersk Container Industry A/S
- Singamas Container Holdings
- W&K Container
- Sea Box Inc.
- TLS Offshore Containers
- Storstac Inc.
- CARU Containers B.V.
- China Eastern Containers
- Valisons & Co.
- YMC Container Solutions
- American Intermodal Container Manufacturing
- Triton International
- Textainer Group Holdings
- Florens Container Services
- CAI International
- Touax Group
- UES International
Additional Benefits:
- The market estimate (ME) sheet in Excel format
- 3 months of analyst support
TABLE OF CONTENTS
1 Introduction
- 1.1 Study Assumptions & Market Definition
- 1.2 Scope of the Study
2 Research Methodology
3 Executive Summary
4 Market Landscape
- 4.1 Market Overview
- 4.2 Market Drivers
- 4.2.1 Explosive growth of cross-border e-commerce creating 24-hour turnaround expectations for standard dry containers.
- 4.2.2 Worldwide cold-chain penetration of fresh grocery and meal-kit delivery accelerating orders for advanced reefer boxes.
- 4.2.3 Direct-to-consumer (D2C) brands demanding bespoke, logo-printed containers to double as mobile pop-up stores and fulfilment hubs.
- 4.2.4 Corporate ESG mandates pushing shippers toward reusable, multimodal containers over single-use pallet wrap, lifting replacement demand.
- 4.2.5 Adoption of IoT-enabled -smart- boxes providing real-time location & condition data, raising shipper's willingness to pay for premium units.
- 4.2.6 Subscription-based and modular housing concepts spurring second-life conversions of retired shipping containers.
- 4.3 Market Restraints
- 4.3.1 Post-pandemic oversupply of boxes eroding utilisation rates and discouraging new-build investment.
- 4.3.2 Volatility in hot-rolled coil steel prices creating budget uncertainty for container purchasers.
- 4.3.3 Stricter cradle-to-grave regulations and extended-producer-responsibility (EPR) rules inflating lifetime ownership costs.
- 4.3.4 Rapid emergence of foldable and collapsible container alternatives cannibalising demand for conventional rigid boxes.
- 4.4 Value / Supply-Chain Analysis
- 4.5 Regulatory & Technological Outlook
- 4.6 Porter's Five Forces
- 4.6.1 Threat of New Entrants
- 4.6.2 Bargaining Power of Buyers
- 4.6.3 Bargaining Power of Suppliers
- 4.6.4 Threat of Substitutes
- 4.6.5 Intensity of Competitive Rivalry
- 4.7 Pricing Analysis - Standard vs. Special Containers
- 4.8 Spotlight: Intermodal & Rail Uptake
- 4.9 Global Container Leasing Landscape
- 4.10 Impact of Geopolitical Events on the Market
5 Market Size & Growth Forecasts (Value, Volume)
- 5.1 By Size
- 5.1.1 20-ft (TEU)
- 5.1.2 40-ft (FEU)
- 5.1.3 40-ft High-Cube,
- 5.1.4 Others ( >45-ft, etc)
- 5.2 By Container Type
- 5.2.1 Dry Storage (Standard)
- 5.2.2 Refrigerated (Reefer)
- 5.2.3 Tank (ISO Tank, Cryogenic)
- 5.2.4 Flat-Rack & Open-Top
- 5.2.5 Special Purpose (Side-Door, Tunnel, Insulated, Collapsible)
- 5.3 By Material
- 5.3.1 Corten Steel
- 5.3.2 Stainless Steel
- 5.3.3 Aluminium Alloy
- 5.3.4 FRP & Composite
- 5.3.5 Others
- 5.4 By End-Use Industry
- 5.4.1 Consumer Goods & Retail
- 5.4.2 Food & Beverage
- 5.4.3 Industrial Machinery & Automotive
- 5.4.4 Chemicals & Petroleum
- 5.4.5 Pharmaceuticals & Healthcare
- 5.4.6 Others
- 5.5 By Mode of Transport
- 5.5.1 Maritime Deep-Sea
- 5.5.2 Short-Sea & Coastal
- 5.5.3 Rail Intermodal
- 5.5.4 Road Inland Haulage & Off-Site Storage
- 5.6 By Geography
- 5.6.1 North America
- 5.6.1.1 United States
- 5.6.1.2 Canada
- 5.6.1.3 Mexico
- 5.6.2 South America
- 5.6.2.1 Brazil
- 5.6.2.2 Peru
- 5.6.2.3 Chile
- 5.6.2.4 Argentina
- 5.6.2.5 Rest of South America
- 5.6.3 Asia-Pacific
- 5.6.3.1 China
- 5.6.3.2 India
- 5.6.3.3 Japan
- 5.6.3.4 Australia
- 5.6.3.5 South Korea
- 5.6.3.6 South East Asia (Singapore, Malaysia, Thailand, Indonesia, Vietnam, and Philippines)
- 5.6.3.7 Rest of Asia-Pacific
- 5.6.4 Europe
- 5.6.4.1 United Kingdom
- 5.6.4.2 Germany
- 5.6.4.3 France
- 5.6.4.4 Spain
- 5.6.4.5 Italy
- 5.6.4.6 BENELUX (Belgium, Netherlands, and Luxembourg)
- 5.6.4.7 NORDICS (Denmark, Finland, Iceland, Norway, and Sweden)
- 5.6.4.8 Rest of Europe
- 5.6.5 Middle East And Africa
- 5.6.5.1 United Arab Emirates
- 5.6.5.2 Saudi Arabia
- 5.6.5.3 South Africa
- 5.6.5.4 Nigeria
- 5.6.5.5 Rest of Middle East And Africa
- 5.6.1 North America
6 Competitive Landscape
- 6.1 Market Concentration
- 6.2 Strategic Moves (M&A, Capacity Expansion, Leasing Deals)
- 6.3 Market Share Analysis
- 6.4 Company Profiles (includes Global-level Overview, Market-level Overview, Core Segments, Financials, Strategic Information, Market Rank/Share, Products & Services, Recent Developments)
- 6.4.1 China International Marine Containers (CIMC)
- 6.4.2 Dong Fang International Containers
- 6.4.3 CXIC Group (CSSC)
- 6.4.4 Maersk Container Industry A/S
- 6.4.5 Singamas Container Holdings
- 6.4.6 W&K Container
- 6.4.7 Sea Box Inc.
- 6.4.8 TLS Offshore Containers
- 6.4.9 Storstac Inc.
- 6.4.10 CARU Containers B.V.
- 6.4.11 China Eastern Containers
- 6.4.12 Valisons & Co.
- 6.4.13 YMC Container Solutions
- 6.4.14 American Intermodal Container Manufacturing
- 6.4.15 Triton International
- 6.4.16 Textainer Group Holdings
- 6.4.17 Florens Container Services
- 6.4.18 CAI International
- 6.4.19 Touax Group
- 6.4.20 UES International
7 Market Opportunities & Future Outlook
- 7.1 White-Space & Unmet-Need Assessment

