
PUBLISHER: Mordor Intelligence | PRODUCT CODE: 1836498

PUBLISHER: Mordor Intelligence | PRODUCT CODE: 1836498
Traffic Signal Recognition - Market Share Analysis, Industry Trends & Statistics, Growth Forecasts (2025 - 2030)
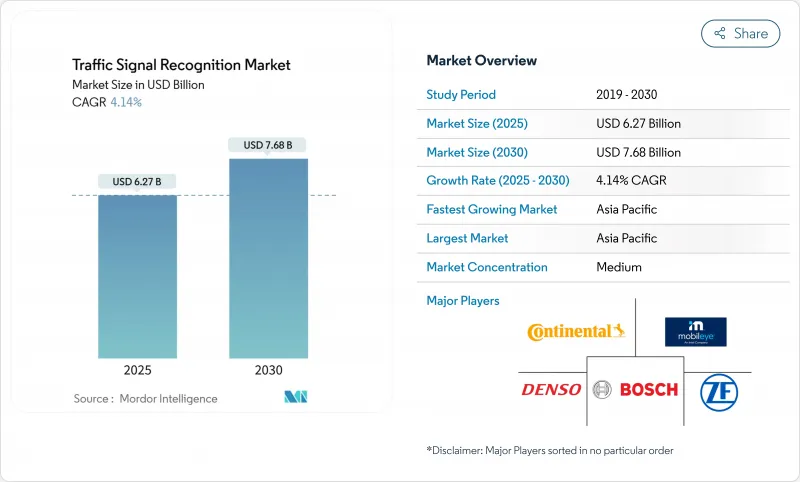
The Traffic Signal Recognition Market size is estimated at USD 6.27 billion in 2025, and is expected to reach USD 7.68 billion by 2030, at a CAGR of 4.14% during the forecast period (2025-2030).
Regulatory mandates, lower camera prices, and Level-2 Plus autonomy expand the addressable base beyond premium models. Original-equipment volumes now give sensor suppliers the economies of scale needed to hold camera costs below the pivotal USD 10 threshold. At the same time, software enhancements sharpen recognition accuracy that feeds insurance telematics scoring and future autonomous-vehicle certification.
Global Traffic Signal Recognition Market Trends and Insights
Regulation-Mandated ADAS Inclusion
Binding rules have turned traffic light detection from an optional extra into a required safety feature. The European Union's General Safety Regulation II, effective July 2024, obliges every new model to include intelligent speed assistance underpinned by traffic-signal inputs, while a parallel NHTSA rule on automatic emergency braking heightens demand for perception suites. OEMs now architect their electrical systems around scalable perception capacity that anticipates future rule-making, effectively locking in multi-year demand for the traffic signal recognition market.
Camera Cost Curve Drops Below USD 10/Unit
Imaging sensors finally cleared the cost hurdle that once kept advanced vision off mass-market vehicles. Sony's automotive CMOS roadmap and onsemi's 3 µm pixel process have driven unit prices beneath USD 10 while boosting HDR to 120 dB and cutting dark current by 28 times. Low prices let OEMs deploy eight or more cameras per vehicle, multiplying viewpoints that collectively raise recognition precision across glare, back-light, and LED-flicker scenarios.
Poor Recognition in Low-Visibility and Weather Eextremes
Snow, fog, and heavy rain still challenge cameras, creating service drops that undermine public trust. Laboratory gains such as Snow-CLOCs (86.61% detection accuracy in winter) have yet to translate into uniform street performance, pushing developers toward LiDAR-camera fusion and thermal overlays. Reliability gaps weigh on regulators who demand clearly defined performance envelopes before advancing hands-free legislation.
Other drivers and restraints analyzed in the detailed report include:
- Level-2 Plus Autonomy Proliferation
- V2I-Enabled Dynamic Sign Updates
- Country-Specific Dataset Validation Costs
For complete list of drivers and restraints, kindly check the Table Of Contents.
Segment Analysis
Color-based Detection held 46.18% of the traffic signal recognition market revenue in 2024, a testament to its long-standing use of RGB thresholds. Yet Deep-Learning Detection is rising at 4.71% CAGR to 2030 as convolutional and transformer networks prove superior under occlusion and variable lighting. The traffic signal recognition market size for Deep-Learning Detection is projected to grow exponentially by 2030, reflecting OEM preferences for software-upgradable accuracy gains.
YOLOv5 and attention-based networks now achieve more than 95% precision and over 98% recall while keeping inference below 45 ms, meeting real-time safety budgets. As over-the-air pipelines mature, automakers can retrain models on edge-case footage and push updates without hardware swaps. The traffic signal recognition market continues transitioning toward AI-centric stacks where differentiators sit in data curation, not circuit design.
In 2024, Camera Systems captured 63.21% of the traffic signal recognition market revenue, driven by declining BOM costs and the integration of advanced software tooling, which enhanced system efficiency and functionality. This dominance highlights the growing adoption of Camera Systems in traffic signal recognition applications. Despite a moderation in growth rates, the market size for Camera Systems in traffic signal recognition is projected to surge at a strong CAGR through 2030, supported by continuous technological advancements.
LiDAR-Camera Fusion is the fastest-advancing sub-segment at 4.34% CAGR as suppliers like Hesai plan 50% price cuts that place solid-state units within mainstream trims. SparseLIF and similar frameworks align point-cloud geometry with image texture, producing redundancy that sustains recognition when glare or precipitation blinds cameras. Radar-assisted options add speed vectors that predict phase changes, illustrating how multi-sensor blending reshapes the traffic signal recognition market.
The Traffic Signal Recognition Market Report is Segmented by Detection Method (Color-Based Detection, Shape-Based Detection, and Feature-Based Detection), Sensor Technology (Camera Systems, Radar-Assisted TSR, and More), Vehicle Type (Passenger Cars and More), Component (Hardware and Software), End-User (OEM and Aftermarket), and Geography. The Market Forecasts are Provided in Terms of Value (USD).
Geography Analysis
Asia-Pacific led with 38.75% of the traffic signal recognition market revenue share in 2024 and is expected to grow at a 4.21% CAGR through 2030. Domestic regulations, smart-city pilots, and vertical integration concentrate the traffic signal recognition market in China, Japan, and South Korea. Shenzhen's V2I corridors feed real-time phase maps to test fleets, while Tokyo's sensor industry supplies HDR imagers to global OEMs. Regional high-density traffic creates diverse datasets that sharpen deep-learning robustness and accelerate global validation cycles.
Europe follows, propelled by General Safety Regulation II. Continental's new Aumovio division and Bosch's sensor-fusion suites anchor supply, while stringent cybersecurity rules shape data-handling architectures. Insurance telematics in Germany and the United Kingdom reward verified compliance, channeling consumer demand into the traffic signal recognition market.
North America benefits from federal safety mandates and venture-backed autonomy pilots. California's edge-case legal scrutiny pushes suppliers to document fail-safe performance, while Canada's winter climate provides natural laboratories for adverse-weather testing. Together, these factors sustain a diversified yet interconnected geography where advances in one region ripple quickly to others through globally distributed OEM programs.
- Continental AG
- Robert Bosch GmbH
- DENSO Corporation
- Mobileye (Intel)
- ZF Friedrichshafen AG
- HELLA (FORVIA)
- Aptiv PLC
- Valeo SA
- Magna International Inc.
- Panasonic Holdings
- Hyundai Mobis
- Hitachi Astemo
- Veoneer / S-SW
- Ford Motor Company
- General Motors Company
- Tesla Inc.
- NVIDIA Corporation
Additional Benefits:
- The market estimate (ME) sheet in Excel format
- 3 months of analyst support
TABLE OF CONTENTS
1 Introduction
- 1.1 Study Assumptions & Market Definition
- 1.2 Scope of the Study
2 Research Methodology
3 Executive Summary
4 Market Landscape
- 4.1 Market Overview
- 4.2 Market Drivers
- 4.2.1 Regulation-mandated ADAS inclusion
- 4.2.2 Camera Cost Curve Drops Below USD10/unit
- 4.2.3 Level-2 Plus Autonomy Proliferation
- 4.2.4 V2I-Enabled Dynamic Sign Updates
- 4.2.5 HD-Map Digital-Twin Build-Outs
- 4.2.6 Insurance Telematics Rewarding TSR Accuracy
- 4.3 Market Restraints
- 4.3.1 Poor Recognition in Low-Visibility and Weather Extremes
- 4.3.2 Country-Specific Dataset Validation Costs
- 4.3.3 Cyber-Liability For Erroneous Sign Display
- 4.3.4 OEM Budget Shift to Competing Sensor Priorities
- 4.4 Value / Supply-Chain Analysis
- 4.5 Regulatory Landscape
- 4.6 Technological Outlook
- 4.7 Porter's Five Forces
- 4.7.1 Threat of New Entrants
- 4.7.2 Bargaining Power of Buyers/Consumers
- 4.7.3 Bargaining Power of Suppliers
- 4.7.4 Threat of Substitute Products
- 4.7.5 Intensity of Competitive Rivalry
5 Market Size & Growth Forecasts (Value (USD))
- 5.1 By Detection Method
- 5.1.1 Color-based Detection
- 5.1.2 Shape-based Detection
- 5.1.3 Feature / Deep-Learning Detection
- 5.2 By Sensor Technology
- 5.2.1 Camera Systems
- 5.2.2 Radar-Assisted TSR
- 5.2.3 LiDAR-Camera Fusion
- 5.2.4 Multi-modal
- 5.3 By Vehicle Type
- 5.3.1 Passenger Cars
- 5.3.2 Light Commercial Vehicles
- 5.3.3 Medium and Heavy Commercial Vehicles
- 5.3.4 Buses and Coaches
- 5.4 By Component
- 5.4.1 Hardware
- 5.4.2 Software
- 5.5 By End-User
- 5.5.1 OEM-installed
- 5.5.2 Aftermarket Retrofit
- 5.6 Geography
- 5.6.1 North America
- 5.6.1.1 United States
- 5.6.1.2 Canada
- 5.6.1.3 Rest of North America
- 5.6.2 South America
- 5.6.2.1 Brazil
- 5.6.2.2 Argentina
- 5.6.2.3 Rest of South America
- 5.6.3 Europe
- 5.6.3.1 Germany
- 5.6.3.2 United Kingdom
- 5.6.3.3 France
- 5.6.3.4 Spain
- 5.6.3.5 Italy
- 5.6.3.6 Rest of Europe
- 5.6.4 Asia-Pacific
- 5.6.4.1 China
- 5.6.4.2 Japan
- 5.6.4.3 South Korea
- 5.6.4.4 India
- 5.6.4.5 Rest of Asia-Pacific
- 5.6.5 Middle East and Africa
- 5.6.5.1 Saudi Arabia
- 5.6.5.2 United Arab Emirates
- 5.6.5.3 Egypt
- 5.6.5.4 South Africa
- 5.6.5.5 Rest of Middle East and Africa
- 5.6.1 North America
6 Competitive Landscape
- 6.1 Market Concentration
- 6.2 Strategic Moves
- 6.3 Market Share Analysis
- 6.4 Company Profiles (includes Global Level Overview, Market Level Overview, Core Segments, Financials as Available, Strategic Information, Market Rank/Share for Key Companies, Products and Services, SWOT Analysis, and Recent Developments)
- 6.4.1 Continental AG
- 6.4.2 Robert Bosch GmbH
- 6.4.3 DENSO Corporation
- 6.4.4 Mobileye (Intel)
- 6.4.5 ZF Friedrichshafen AG
- 6.4.6 HELLA (FORVIA)
- 6.4.7 Aptiv PLC
- 6.4.8 Valeo SA
- 6.4.9 Magna International Inc.
- 6.4.10 Panasonic Holdings
- 6.4.11 Hyundai Mobis
- 6.4.12 Hitachi Astemo
- 6.4.13 Veoneer / S-SW
- 6.4.14 Ford Motor Company
- 6.4.15 General Motors Company
- 6.4.16 Tesla Inc.
- 6.4.17 NVIDIA Corporation
7 Market Opportunities & Future Outlook
- 7.1 White-space & Unmet-need Assessment

