
PUBLISHER: Mordor Intelligence | PRODUCT CODE: 1836513

PUBLISHER: Mordor Intelligence | PRODUCT CODE: 1836513
Caustic Soda - Market Share Analysis, Industry Trends & Statistics, Growth Forecasts (2025 - 2030)
The membrane cell segment generated the bulk of 2024 output, commanding 85% of the caustic soda market share, and the diaphragm cell is expanding at a 5.12% CAGR to 2030.
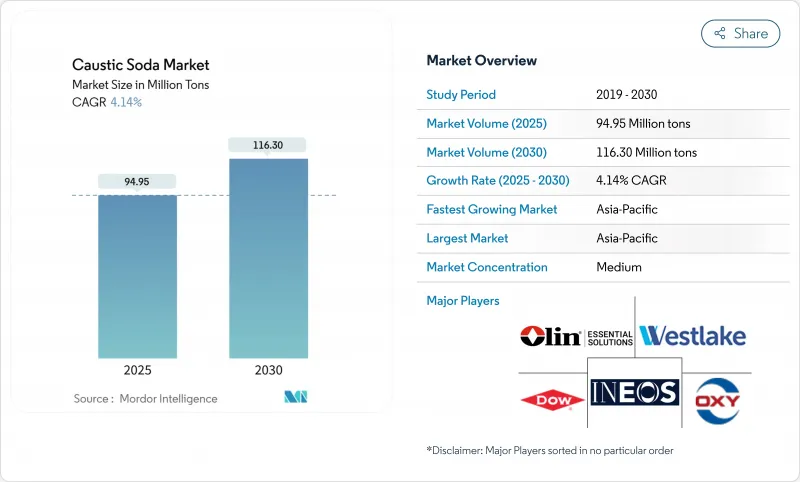
Global demand for caustic soda totals 94.95 million tons in 2025 and is forecast to climb to 116.30 million tons by 2030, reflecting a 4.14% CAGR over 2025-2030. Robust growth springs from the chemical's wide industrial reach, with alumina refining, organic chemical synthesis, pulp and paper, textiles, and water treatment each deepening their consumption. Membrane cell technology, already responsible for 85% of output, is expanding because it cuts electricity use by roughly 30% relative to legacy mercury cells and eliminates mercury emissions. Asia's dominance, at 64% of tonnage, rests on competitive power tariffs, rapid refinery build-outs, and aggressive viscose fiber investments. Liquid grades command 65% of deliveries, favored for pipeline transfer and bulk storage. Pricing spreads increasingly track regional energy costs, prompting producers to lock in low-carbon electricity contracts and locate new plants near gas-rich coastlines. Capacity additions announced in China, India, and the United States underscore a careful balance between energy security, carbon policy, and localized demand clusters, sustaining a moderately fragmented caustic soda market.
Global Caustic Soda Market Trends and Insights
Accelerated Alumina Refinery Expansions in Asia
Rising refinery capacity is lifting caustic soda offtake because 2-3 tons are dissolved for every ton of alumina extracted in the Bayer process, and Chinese aluminum producers alone consumed tens of millions of tons in 2024. New smelter complexes in Indonesia and India are contracting long-term supply to hedge price spikes, which can swing aluminum production costs by nearly 6% quarter-on-quarter. Plant operators also source higher-purity grades to reduce red-mud disposal volumes, translating into price premia for low-salt caustic soda. Several refinery owners now consider backward integration, sharpening competition for upstream licenses and power access. With each 1 million-ton alumina addition requiring roughly 2.5 million tons of caustic soda, green-field projects scheduled for 2025-2027 underpin structural demand growth for the caustic soda market.
Increasing Demand for Soap and Detergent
Hygiene-led urbanization across emerging economies is widening the soap and detergent aisle, where caustic soda forms the alkali backbone of saponification reactions. Volumes shipped to surfactant makers in Indonesia, Nigeria, and Vietnam rose in double digits in 2024, and premium food-grade caustic soda now secures a 12% pricing uplift over standard 50 wt% solutions. Specialty formulators request ultra-low iron and nickel specifications that cut discoloration in transparent soaps, nudging producers to invest in brine purification skids. The widening product mix-from anti-bacterial liquids to fabric-specific powders-keeps the caustic soda market diversified, cushioning cyclical downturns in heavy industry.
Volatile Electricity Prices in Europe
Electricity can represent 50% of cash costs for membrane electrolysis, and European day-ahead prices surged above EUR 90/MWh in early 2025, eroding margins Euro Chlor. Producers face indirect CO2 charges under the EU Emissions Trading Scheme, widening cost gaps versus Russian or Saudi exporters by up to USD 120 per ton. Compensation proposals under discussion could reimburse a share of these expenses, yet policy uncertainty curtails investment in new European capacity. Consequently, spot imports into north-west Europe rose 19% year-on-year in 2024, pressuring the regional caustic soda market.
Other drivers and restraints analyzed in the detailed report include:
- Surge in Viscose Staple Fiber Output in India
- Desalination Capacity Additions in the Middle East and Africa
- Energy-Intensive Production Process
For complete list of drivers and restraints, kindly check the Table Of Contents.
Segment Analysis
Its dominance stems from regulatory bans on mercury technology, notably the EU's final 2017 phase-out deadline, and from a 30% electricity-savings advantage relative to legacy cells. In addition, sodium chloride contamination can be held below 100 ppm, enabling high-purity grades for semiconductor production. Producers in China, the United States, and Germany are debottlenecking existing membrane lines by raising current density to 7 kA m-2, adding incremental tonnage without new brine circuits. A parallel investment wave is visible in Japan, where Asahi Kasei secured government backing in 2024 to expand membrane stack output for domestic chlor-alkali retrofits. Diaphragm and residual mercury capacity accounts for the balance of the caustic soda market.
Liquid caustic soda, typically shipped at 50 wt%, covered 65% of deliveries in 2024 while solid form is projected to rise at a 4.87% CAGR. Pipeline connectivity and bulk-truck handling make liquids the default for customers located within 300-500 km of a chlor-alkali plant, limiting freight costs to under USD 30 per ton. Liquid demand is particularly resilient among pulp and paper mills, oil refineries, and water utilities, where continuous dosing systems rely on standard 50 wt% feedstock. Solid forms-flakes, beads, and briquettes-meet long-haul, purity-critical, or small-batch needs. Although representing a smaller volume, solids fetch up to USD 120 per ton premiums owing to de-watering, prilling, and dust-suppression steps. Hydrite's 2025 launch of sealed-drum bead packaging cuts hygroscopic moisture pick-up and directly addresses end-user safety demands. Solid volumes grow mainly in electronics, pharmaceuticals, and textile dyeing, giving producers an avenue to lift margin in an otherwise commodity-like caustic soda market.
The Caustic Soda Market Report Segments the Industry by Production Process (Membrane Cell, Diaphragm Cell, and Other Processes), Form (Liquid and Solid), Concentration Grade (32 Wt%, 50 Wt%, and 73 Wt% and Higher), Applications (Pulp and Paper, Organic Chemicals, and More), and Geography (Asia-Pacific, North America, Europe, South America, and Middle East and Africa). The Market Forecasts are Provided in Terms of Volume (tons).
Geography Analysis
Asia-Pacific cemented its leadership with 64% of 2024 shipments. Chinese chlor-alkali plants recorded output near 41 million tons, even as exports dipped on softer European draws. Domestic consumption stayed buoyant thanks to aluminum and PVC expansions. India's caustic soda market gained momentum when Atul Products commissioned a 300 TPD facility in Valsad during 2024, complemented by captive 50 MW power that buffers electricity risk. Southeast Asian producers benefit from regional demand for soap, biodiesel, and battery precursors, building a springboard for cross-border pipeline projects that cut maritime freight exposure.
North America, holding a significant albeit smaller share, leverages shale-derived natural gas to enjoy one of the world's lowest electrolysis power costs, fostering competitive exports of both caustic soda and chlorine derivatives. OxyChem's 2024 restart of its 678 kt refrigeration-grade line in Texas bolsters domestic supply resilience. The region's forward pipeline includes PCC Group's planned 340 kt chlor-alkali unit at Chemours' DeLisle site, scheduled for commissioning in 2028. Such brownfield integrations anchor captive chlorine outlets while adding merchant caustic to a mature but technologically advanced caustic soda market.
Europe struggles under high and volatile energy prices. Despite hosting 76 manufacturing sites, capacity utilization dipped as spot electricity spikes pushed regional cash costs well above those in Russia or Saudi Arabia. Policymakers now debate indirect-cost compensation to avert carbon leakage and protect 35,000 direct jobs in the chlor-alkali chain. Nonetheless, European producers continue to court customers in electronics, pharmaceuticals, and food processing who insist on the continent's stringent quality protocols, preserving niche value despite broad cost pressures.
- AGC Inc.
- Atul Ltd
- BorsodChem (Wanhua Chemical Group)
- Covestro AG
- DCW Ltd.
- Dow
- Formosa Plastics Corporation
- GHCL Limited
- Grasim Industries Limited
- Gujarat Alkalies and Chemicals Limited
- Hanwha Solutions Corp.
- INEOS
- Nouryon
- Occidental Petroleum Corporation
- Olin Corporation
- SABIC
- Shin-Etsu Chemical Co. Ltd.
- Tata Chemicals Ltd.
- Tosoh Corporation
- Westlake Corporation
- Xinjiang Zhongtai Chemical Co. Ltd.
Additional Benefits:
- The market estimate (ME) sheet in Excel format
- 3 months of analyst support
TABLE OF CONTENTS
1 Introduction
- 1.1 Study Assumptions and Market Definition
- 1.2 Scope of the Study
2 Research Methodology
3 Executive Summary
4 Market Landscape
- 4.1 Market Overview
- 4.2 Market Drivers
- 4.2.1 Accelerated alumina refinery expansions in Asia boosting caustic demand
- 4.2.2 Increasing Demand for Soap and Detergent
- 4.2.3 Surge in viscose staple fiber output in India
- 4.2.4 Desalination capacity additions in the Middle East and Africa
- 4.2.5 EU-mandated switch to membrane cells driving upgrade projects
- 4.3 Market Restraints
- 4.3.1 Volatile electricity prices in Europe
- 4.3.2 Energy-intensive Production Process
- 4.3.3 Availability of substitutes in Various End User Industries
- 4.4 Value Chain Analysis
- 4.5 Technological Outlook
- 4.6 Price Overview
- 4.7 Trade Overview
- 4.8 Porter's Five Forces
- 4.8.1 Bargaining Power of Suppliers
- 4.8.2 Bargaining Power of Buyers
- 4.8.3 Threat of New Entrants
- 4.8.4 Threat of Substitutes
- 4.8.5 Degree of Competition
5 Market Size and Growth Forecasts ( Volume)
- 5.1 By Production Process
- 5.1.1 Membrane Cell
- 5.1.2 Diaphragm Cell
- 5.1.3 Other Processes
- 5.2 By Form
- 5.2.1 Liquid
- 5.2.2 Solid
- 5.3 By Concentration Grade
- 5.3.1 32 wt%
- 5.3.2 50 wt%
- 5.3.3 73 wt% and Higher
- 5.4 By Application
- 5.4.1 Pulp and Paper
- 5.4.2 Organic Chemicals
- 5.4.3 Inorganic Chemicals
- 5.4.4 Soap and Detergent
- 5.4.5 Alumina
- 5.4.6 Water Treatment
- 5.4.7 Textile (Viscose Fibre, Dyeing)
- 5.4.8 Others (Food and Pharmaceutical Processing, Mining and metallurgy)
- 5.5 By Geography
- 5.5.1 Asia-Pacific
- 5.5.1.1 China
- 5.5.1.2 India
- 5.5.1.3 Japan
- 5.5.1.4 South Korea
- 5.5.1.5 ASEAN
- 5.5.1.6 Rest of Asia-Pacific
- 5.5.2 North America
- 5.5.2.1 United States
- 5.5.2.2 Canada
- 5.5.2.3 Mexico
- 5.5.3 Europe
- 5.5.3.1 Germany
- 5.5.3.2 United Kingdom
- 5.5.3.3 Italy
- 5.5.3.4 France
- 5.5.3.5 Nordics
- 5.5.3.6 Rest of Europe
- 5.5.4 South America
- 5.5.4.1 Brazil
- 5.5.4.2 Argentina
- 5.5.4.3 Rest of South America
- 5.5.5 Middle East and Africa
- 5.5.5.1 Saudi Arabia
- 5.5.5.2 United Arab Emirates
- 5.5.5.3 Turkey
- 5.5.5.4 South Africa
- 5.5.5.5 Egypt
- 5.5.5.6 Rest of Middle East and Africa
- 5.5.1 Asia-Pacific
6 Competitive Landscape
- 6.1 Market Concentration
- 6.2 Strategic Moves
- 6.3 Market Share(%)/ Ranking Analysis
- 6.4 Company Profiles {(includes Global level Overview, Market level overview, Core Segments, Financials as available, Strategic Information, Market Rank/Share for key companies, Products and Services, and Recent Developments)}
- 6.4.1 AGC Inc.
- 6.4.2 Atul Ltd
- 6.4.3 BorsodChem (Wanhua Chemical Group)
- 6.4.4 Covestro AG
- 6.4.5 DCW Ltd.
- 6.4.6 Dow
- 6.4.7 Formosa Plastics Corporation
- 6.4.8 GHCL Limited
- 6.4.9 Grasim Industries Limited
- 6.4.10 Gujarat Alkalies and Chemicals Limited
- 6.4.11 Hanwha Solutions Corp.
- 6.4.12 INEOS
- 6.4.13 Nouryon
- 6.4.14 Occidental Petroleum Corporation
- 6.4.15 Olin Corporation
- 6.4.16 SABIC
- 6.4.17 Shin-Etsu Chemical Co. Ltd.
- 6.4.18 Tata Chemicals Ltd.
- 6.4.19 Tosoh Corporation
- 6.4.20 Westlake Corporation
- 6.4.21 Xinjiang Zhongtai Chemical Co. Ltd.
7 Market Opportunities and Future Outlook
- 7.1 Rising Demand for Sodium-Ion Batteries Sector
- 7.2 Increasing Demand for Energy-efficient Production Processes
- 7.3 White-space and Unmet-need Assessment

