
PUBLISHER: Mordor Intelligence | PRODUCT CODE: 1836663

PUBLISHER: Mordor Intelligence | PRODUCT CODE: 1836663
Advanced Visualization - Market Share Analysis, Industry Trends & Statistics, Growth Forecasts (2025 - 2030)
The advanced visualization market reached USD 4.20 billion in 2025 and is forecast to climb to USD 7.18 billion by 2030, reflecting an 11.3% CAGR.
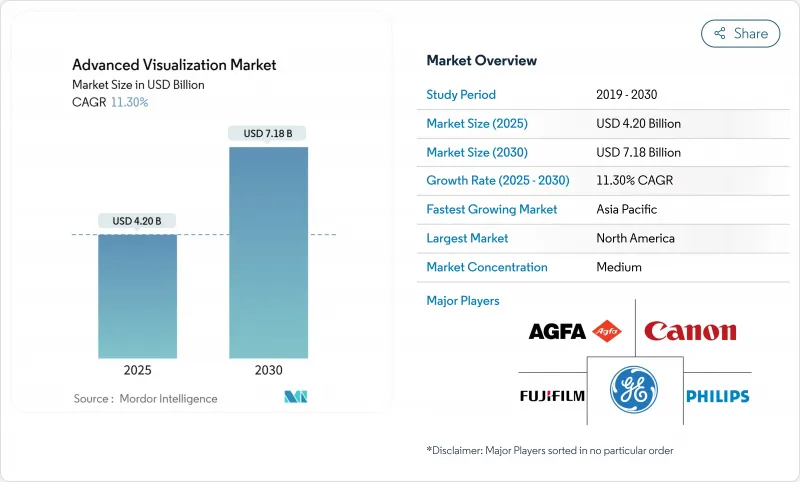
Strong demand for AI-powered imaging software, photon-counting CT scanners and cloud-enabled enterprise platforms continues to accelerate capital spending among hospitals and diagnostic centers. In clinical practice, AI auto-segmentation cuts radiology reading time by over 40%, photon-counting CT delivers sub-0.2 mm resolution at lower dose, and new CPT codes for quantitative brain and cardiovascular imaging are unlocking fresh reimbursement streams. Large-scale enterprise PACS/VNA rollouts are fostering multi-site collaboration, while secure-cloud deployments gain traction despite strict data-sovereignty rules in Europe. Competitive intensity is rising as device manufacturers pair with GPU vendors to embed real-time AI into scanners, and service contracts shift revenue away from one-off system sales toward recurring, subscription-based models.
Global Advanced Visualization Market Trends and Insights
AI-Powered Auto-Segmentation Transforms Diagnostic Efficiency
Federal clearance of more than 1,000 clinical AI applications-77% for radiology-has legitimized workflow automation, enabling platforms like Canon Medical INSTINX to remove 40% of cardiac-CT workflow clicks and Philips SmartSpeed Precise to finish MRI scans three-times faster with 80% sharper images. These productivity gains help offset a radiologist vacancy rate of 18.1% that professional bodies project will persist well beyond 2030. In interventional suites, real-time segmentation now guides carotid stenting with 94% recall accuracy, broadening AI value from diagnostics into therapy planning.
Enterprise PACS Integration Drives Operational Consolidation
Record order bookings above SEK 4 billion for Sectra's cloud enterprise imaging suite underscore health-system appetite for unified architectures that eradicate data silos and standardize workflow across radiology, cardiology and pathology departments. Cloud-native PACS rollouts such as PACSonWEB have lifted cross-hospital referrals by 10% within 12 months because physicians can view images anywhere, anytime. Subscription pricing is overtaking perpetual licenses, lowering capital outlays and aligning vendor incentives with uptime and cybersecurity performance guarantees.
Data-Privacy Regulations Create Cloud Barriers
GDPR clauses that tie encryption-key sovereignty to national boundaries force cloud PACS vendors to deploy elaborate key-management infrastructure, elevating deployment cost and lengthening sales cycles in Europe. Cyber incidents targeting radiology grew 67% in 2024, intensifying buyer scrutiny over public-cloud risk profiles and nudging hospitals toward hybrid architectures that keep patient identifiers on-premise while pushing de-identified images into the cloud for AI inference .
Other drivers and restraints analyzed in the detailed report include:
- Reimbursement Expansion Validates Quantitative Imaging Value
- Photon-Counting CT Enables Next-Generation Spectral Imaging
- Healthcare IT Staffing Shortages Constrain Adoption
For complete list of drivers and restraints, kindly check the Table Of Contents.
Segment Analysis
Software solutions contributed 45.67% to overall 2024 revenue, equivalent to roughly USD 1.9 billion of advanced visualization market size, due to accelerating adoption of AI analytics that automate segmentation, perfusion mapping and structured reporting. Subscription-based upgrades deliver continuous algorithm refreshes, cementing retention rates above 95%. Hardware revenues remain sizable because photon-counting CT and 3-Tesla MR systems require specialized GPUs and detector arrays, yet the value narrative is shifting toward software-defined imaging where clinical improvements come through code instead of tubes and gantries. Services out-paced every other category with a 13.12% growth outlook as providers outsource post-processing, cybersecurity and uptime guarantees to managed-service contracts.
The broader advanced visualization industry is embracing cloud orchestration that allows thin-client access across busy emergency departments, collapsing installation cycles from months to weeks. Vendor roadmaps now prioritize API-rich platforms so third-party AI developers can plug-in novel algorithms without disrupting workflow, enhancing return on earlier hardware purchases. As oncology and cardiology programs roll out dedicated AI bundles, software billing is moving to exam-based pricing that aligns vendor revenue with clinical volume.
Enterprise platforms captured 54.12% share in 2024 as health networks favor single worklist, single viewer implementations that cover radiology, cardiology and even digital pathology. These integrated hubs are poised to keep expanding because multi-hospital purchasing groups stipulate vendor-neutral archives and zero-footprint viewers to harmonize standards. Standalone AI applications nevertheless post a 12.30% CAGR by targeting unmet micro-workflows-such as spine fracture detection-that large suites integrate only slowly.
An enterprise sale often bundles photon-counting CT licenses, oncology auto-contouring and cloud disaster-recovery into a seven-year opex contract, increasing switching costs and entrenching brand loyalty. For niche developers, distribution through marketplace app-stores embedded in leading platforms offers reach without heavy field-sales overheads, broadening the advanced visualization market addressable by smaller firms.
The Advanced Visualization Market Report Segments the Industry Into by Product and Service (Hardware, and More), by Solution Type (Enterprise Platform, Standalone Tool), by Deployment Model (On-Premise, and More), Imaging Modality ((MRI), (CT), and More), by Clinical Application (Oncology, Cardiovascular, and More), End User (Hospitals, and More), and Geography. The Market Sizes and Forecasts are Provided in Terms of Value (USD).
Geography Analysis
North America commanded 43.14% revenue in 2024, underpinned by dense modality install bases, earliest AI 510(k) clearances and CMS payment reforms that now reimburse coronary CTA at USD 357.13 per exam. Academic-industry partnerships-exemplified by GE HealthCare and NVIDIA's work on autonomous scanning-continue to incubate algorithms later deployed worldwide. Ongoing staff shortages create tailwinds for productivity software as radiology groups seek to meet rising demand.
Asia-Pacific registers the steepest 13.54% CAGR as Japan, Australia and South Korea upgrade to photon-counting CT while populous countries such as India deploy affordable cloud PACS to extend tertiary-level diagnostics into tier-II cities. GE HealthCare's acquisition of Nihon Medi-Physics underscores regional interest in molecular imaging supply chains that complement visualization platforms. National AI governance frameworks in Singapore and South Korea streamline regulatory paths, encouraging local startups to integrate into international device ecosystems.
Europe posts moderate gains amid complex GDPR compliance. Vendors able to guarantee encryption-key residency within EU borders gain competitive advantage. Philips' rollout of HealthSuite Imaging on sovereign-cloud instances demonstrates how regulatory adherence and innovation can coexist. Furthermore, heightened cybersecurity vigilance spurs replacement of legacy PACS with zero-trust, vendor-neutral archives-driving incremental advanced visualization market revenues.
- Agfa-Gevaert
- Canon Inc. (Canon Medical Systems)
- Carestream Health
- FUJIFILM
- GE HealthCare Technologies Inc.
- Koninklijke Philips
- Siemens Healthineers
- Sectra
- Pro Medicus Ltd (Visage Imaging)
- Terarecon
- Intelerad Medical Systems
- Vital Images (Canon Group)
- Merative (ex-IBM Watson Health)
- Rad AI
- Blackford Analysis
- Circle Cardiovascular Imaging
- Coreline Soft
- VoxelCloud
Additional Benefits:
- The market estimate (ME) sheet in Excel format
- 3 months of analyst support
TABLE OF CONTENTS
1 Introduction
- 1.1 Study Assumptions & Market Definition
- 1.2 Scope of the Study
2 Research Methodology
3 Executive Summary
4 Market Landscape
- 4.1 Market Overview
- 4.2 Market Drivers
- 4.2.1 AI-powered auto-segmentation cuts reading time by >40%
- 4.2.2 Integration of AV into enterprise PACS/VNA ecosystems
- 4.2.3 Reimbursement expansion for quantitative imaging CPT codes
- 4.2.4 Vendor-neutral cloud platforms enable multi-site collaboration (under-radar)
- 4.2.5 Photon-counting CT & spectral MRI drive 4-D visualisation demand (under-radar)
- 4.2.6 In-scanner decision-support for interventional suites (under-radar)
- 4.3 Market Restraints
- 4.3.1 Patchy reimbursement outside US & Japan
- 4.3.2 Data-privacy rules slowing cloud roll-outs in EU
- 4.3.3 Ongoing shortage of imaging IT staff at hospitals (under-radar)
- 4.3.4 GPU supply-chain volatility raises TCO for vendors (under-radar)
- 4.4 Value / Supply-Chain Analysis
- 4.5 Regulatory Landscape
- 4.6 Technological Outlook
- 4.7 Porter's Five Forces Analysis
- 4.7.1 Threat of New Entrants
- 4.7.2 Bargaining Power of Buyers
- 4.7.3 Bargaining Power of Suppliers
- 4.7.4 Threat of Substitutes
- 4.7.5 Intensity of Competitive Rivalry
5 Market Size & Growth Forecasts (Value - USD)
- 5.1 By Product & Service
- 5.1.1 Hardware
- 5.1.2 Software
- 5.1.3 Services
- 5.2 By Solution Type
- 5.2.1 Enterprise Platform
- 5.2.2 Standalone Tool
- 5.3 By Deployment Model
- 5.3.1 On-premise
- 5.3.2 Cloud-based
- 5.3.3 Hybrid
- 5.4 By Imaging Modality
- 5.4.1 Magnetic Resonance Imaging (MRI)
- 5.4.2 Computed Tomography (CT)
- 5.4.3 Ultrasound
- 5.4.4 Nuclear Medicine (PET/SPECT)
- 5.4.5 Emerging Modalities (Photon-Counting CT, Photoacoustic)
- 5.5 By Clinical Application
- 5.5.1 Oncology
- 5.5.2 Cardiovascular
- 5.5.3 Neurology
- 5.5.4 Orthopedics & Musculoskeletal
- 5.5.5 Gastro-Hepatology
- 5.6 By End User
- 5.6.1 Hospitals
- 5.6.2 Diagnostic Imaging Centers
- 5.6.3 Others
- 5.7 By Geography
- 5.7.1 North America
- 5.7.1.1 United States
- 5.7.1.2 Canada
- 5.7.1.3 Mexico
- 5.7.2 Europe
- 5.7.2.1 Germany
- 5.7.2.2 United Kingdom
- 5.7.2.3 France
- 5.7.2.4 Italy
- 5.7.2.5 Spain
- 5.7.2.6 Rest of Europe
- 5.7.3 Asia-Pacific
- 5.7.3.1 China
- 5.7.3.2 Japan
- 5.7.3.3 India
- 5.7.3.4 Australia
- 5.7.3.5 South Korea
- 5.7.3.6 Rest of Asia-Pacific
- 5.7.4 Middle East & Africa
- 5.7.4.1 GCC
- 5.7.4.2 South Africa
- 5.7.4.3 Rest of Middle East & Africa
- 5.7.5 South America
- 5.7.5.1 Brazil
- 5.7.5.2 Argentina
- 5.7.5.3 Rest of South America
- 5.7.1 North America
6 Competitive Landscape
- 6.1 Market Concentration
- 6.2 Market Share Analysis
- 6.3 Company Profiles (includes Global level Overview, Market level overview, Core Segments, Financials as available, Strategic Information, Market Rank/Share for key companies, Products & Services, and Recent Developments)
- 6.3.1 Agfa-Gevaert Group
- 6.3.2 Canon Inc. (Canon Medical Systems)
- 6.3.3 Carestream Health
- 6.3.4 Fujifilm Holdings Corporation
- 6.3.5 GE HealthCare Technologies Inc.
- 6.3.6 Koninklijke Philips N.V.
- 6.3.7 Siemens Healthineers AG
- 6.3.8 Sectra AB
- 6.3.9 Pro Medicus Ltd (Visage Imaging)
- 6.3.10 Terarecon Inc.
- 6.3.11 Intelerad Medical Systems
- 6.3.12 Vital Images (Canon Group)
- 6.3.13 Merative (ex-IBM Watson Health)
- 6.3.14 Rad AI
- 6.3.15 Blackford Analysis
- 6.3.16 Circle Cardiovascular Imaging
- 6.3.17 Coreline Soft
- 6.3.18 VoxelCloud
7 Market Opportunities & Future Outlook
- 7.1 White-space & Unmet-need Assessment

