
PUBLISHER: Mordor Intelligence | PRODUCT CODE: 1836720

PUBLISHER: Mordor Intelligence | PRODUCT CODE: 1836720
Transparent Electronics - Market Share Analysis, Industry Trends & Statistics, Growth Forecasts (2025 - 2030)
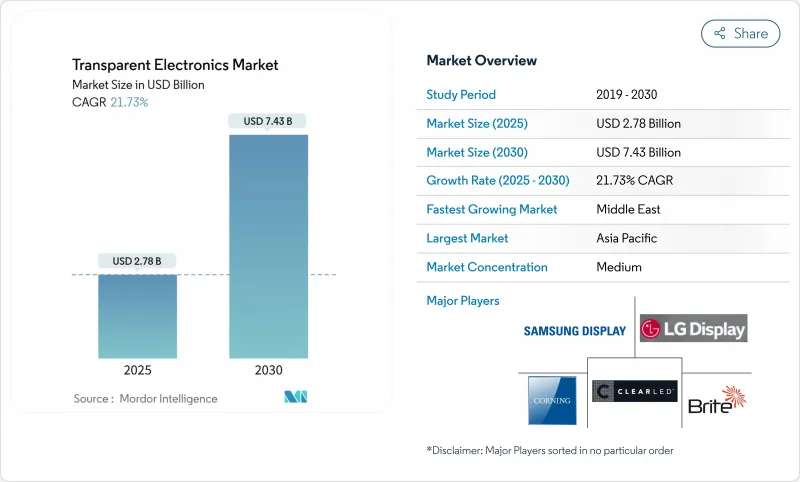
The transparent electronics market size reached USD 2.78 billion in 2025 and is forecast to expand to USD 7.43 billion by 2030, registering a 21.73% CAGR.
Product innovation that merges optical clarity with electronic functionality is shifting the technology from niche display uses toward mainstream roles in energy-smart buildings, advanced vehicle cockpits, and immersive retail. Regulatory pressure for net-zero construction, the electrification of transport, and rising demand for interactive commercial spaces are accelerating capital flows into transparent photovoltaic, micro-LED, and electrochromic platforms. Competitive advantage is increasingly determined by access to flexible materials and high-yield deposition processes rather than panel size alone. Manufacturers that diversify beyond indium tin oxide (ITO) and align with building-integrated photovoltaics (BIPV) or autonomous-vehicle electronics are positioned to capture the next wave of growth.
Global Transparent Electronics Market Trends and Insights
Net-zero building codes driving smart-window integration
European legislation that mandates nearly zero-energy performance for all new structures by 2030 is pushing architects toward electrochromic glazing that dynamically modulates solar gain. Pilot installations across Germany and Scandinavia have shown cooling-energy cuts exceeding 20%, and newer liquid-flow electrochromic designs added the ability to shift interior temperatures 5 °C seasonally. Integration with building-automation systems is becoming standard, opening revenue streams for sensor and controls suppliers alongside panel manufacturers. Medium-term growth prospects are reinforced by funding under national renovation programs, which reserve dedicated budgets for envelope upgrades that include smart windows.
Autonomous vehicles accelerating transparent display adoption
Automakers are turning to large-format transparent head-up displays (HUDs) that project navigation, driver-assist, and infotainment data directly onto windshields. Recent micro-LED prototypes have achieved 85% transparency while retaining 1,000-nit brightness, overcoming prior glare limitations in variable daylight. This capability satisfies stringent driver-distraction and safety norms in the United States, Japan, and the EU, triggering design wins in mid-segment electric vehicles slated for 2026 release. Short-term demand is amplified by the transition to autonomous Level 3 functions, which require larger visual fields for system-status information.
Indium supply vulnerabilities threatening production stability
ITO remains the workhorse transparent conductor, yet more than half of refined indium originates from a single country, exposing panel producers to sudden spot-price swings above 30% per annum. These spikes compress display-maker margins and delay capacity-expansion decisions. Materials firms are responding with silver-nanowire alternatives that exhibit sub-30 Ω/sq resistance at 90% transmittance while tolerating 1,000 bending cycles. The transition, however, requires new curing temperatures and patterning chemistries, prolonging qualification cycles for high-volume production.
Other drivers and restraints analyzed in the detailed report include:
- Retail transformation through transparent digital signage
- Building-integrated photovoltaics expanding transparent solar innovation
For complete list of drivers and restraints, kindly check the Table Of Contents.
Segment Analysis
Transparent displays generated the largest revenue share in 2024 at 43.1%, yet transparent solar panels are projected to grow at a 25.5% CAGR to 2030, propelled by building codes that reward on-site generation. A Swiss venture introduced a 400 W glass-like BIPV module that blends into standard facades without altering exterior aesthetics. The transparent electronics market size for solar panels is forecast to reach USD 1.9 billion by 2030, reflecting their dual role as power generators and daylighting surfaces. Product diversification now extends to transparent conductive films that underpin touch sensors and heaters, as well as rugged transparent ceramics for aerospace shielding. Smart-window units equipped with dynamic tinting continue to gain traction in commercial real estate, aided by operating-cost reductions that shorten payback periods to under five years in warm climates.
The transparent electronics market increasingly values interoperability between product categories. Emerging tandem solar cells share deposition tools with micro-LED backplanes, enabling multi-purpose manufacturing lines. Transparent sensors embedded in vehicle windshields are beginning to feed occupancy and environment data into advanced driver-assistance systems, illustrating how value migrates from stand-alone components to integrated functions.
Indium tin oxide accounted for 52.1% of transparent electronics market share in 2024, underscoring its entrenched position across LCD/TFT and touch-panel supply chains. Nevertheless, silver-nanowire composites and metal meshes are expected to erode this lead, climbing at 22.3% CAGR through 2030. Lab devices have demonstrated 26 Ω/sq sheet resistance at 90% transmittance, with only 10% resistance drift under 120% strain, making them viable for foldable phones and e-skin patches. Application-specific optimisation guides material choice. Conductive polymers such as PEDOT:PSS now coat injection-moulded plastic substrates for low-cost, flexible displays, while graphene manages heat and signal-uniformity challenges in wearable biosensors. Transparent ceramics secure niche demand in harsh-environment optics, and carbon-nanotube hybrids are emerging in electromagnetic-shielding layers where optical transparency is non-negotiable.
The Transparent Electronics Market Report is Segmented by Product (Transparent Displays, Transparent Solar Panels, Smart, and More), Material Type (Indium Tin Oxide (ITO), Alternative TCOs (AZO, FTO), and More), Technology (LCD/TFT, and More), End-User Application (Consumer Electronics, Automotive and Transportation, Aerospace and Defense, and More), and Geography. The Market Forecasts are Provided in Terms of Value (USD).
Geography Analysis
Asia Pacific commanded 43.1% of 2024 revenue, anchored by high-volume fabs for displays and the world's largest BIPV programme in China. Government incentives that link urban air-quality targets to renewable-energy capacity fuel adoption of transparent solar facades in megacities such as Shanghai and Shenzhen. Japanese and South Korean firms dominate OLED research, regularly showcasing prototypes that set new benchmarks in transmittance and pixel density.
North America leverages its leadership in autonomous-vehicle software to accelerate demand for transparent HUDs and sensor-rich windshields. Building-energy rules vary by state, yet collectively favour electrochromic adoption in commercial retrofits. Europe's strict 2030 climate agenda places smart glass and BIPV at the centre of renovation funding, driving a surge of cross-border partnerships between facade contractors and materials specialists.
The Middle East and Africa is forecast to grow at 22.6% CAGR from 2025 to 2030 as smart-city investments integrate digital signage, adaptive shading and solar glass in landmark projects. Saudi Arabia's Vision 2030 allocates multi-billion-dollar budgets to immersive heritage sites that blend transparent display walls with interactive content. Latin America represents an untapped frontier where abundant solar irradiance aligns with transparent PV adoption in urban high-rise developments, although supply-chain hurdles and financing costs temper near-term uptake.
- BOE Technology Group Co., Ltd.
- LG Display Co., Ltd.
- Samsung Display Co., Ltd.
- Corning Incorporated
- AGC Inc.
- NSG Group (Pilkington)
- Saint-Gobain SA
- Ubiquitous Energy Inc.
- Brite Solar Inc.
- ClearLED Ltd.
- Panasonic Holdings Corp.
- Cambrios Technology Corp.
- Surmet Corporation
- 3M Company
- DuPont de Nemours Inc.
- PPG Industries Inc.
- Guardian Industries Holdings
- Shenzhen Nexnovo Technology Co., Ltd.
- Shenzhen AuroLED Technology Co., Ltd.
- Street Communication Inc.
- Apple Inc. (Transparent AR Glass R&D)
- JX Nippon Mining and Metals Corp.
- Heraeus Holding GmbH
- American Elements Corp.
Additional Benefits:
- The market estimate (ME) sheet in Excel format
- 3 months of analyst support
TABLE OF CONTENTS
1 INTRODUCTION
- 1.1 Study Assumptions and Market Definition
- 1.2 Scope of the Study
2 RESEARCH METHODOLOGY
3 EXECUTIVE SUMMARY
4 MARKET LANDSCAPE
- 4.1 Market Overview
- 4.2 Market Drivers
- 4.2.1 Net-Zero Building Codes Accelerating Smart-Window Adoption in EU
- 4.2.2 Rapid Uptake of Head-Up Displays in Autonomous and EV Cockpits (North America)
- 4.2.3 AR-Enabled Transparent Retail Signage Surge in Asia's Tier-1 Cities
- 4.2.4 Building-Integrated PV Mandates Spurring Transparent Solar Panels in China
- 4.2.5 Wearable Medical Sensors Requiring Flexible Transparent Conductors
- 4.3 Market Restraints
- 4.3.1 Indium Price Volatility and Supply Concentration
- 4.3.2 Low Yield Scaling Large-Area Transparent OLED Panels
- 4.3.3 E-waste Rules on Heavy-Metal Oxide Films in Europe
- 4.3.4 High CapEx for Magnetron Sputtering and ALD Equipment
- 4.4 Industry Ecosystem Analysis
- 4.5 Technological Outlook
- 4.6 Porter's Five Forces Analysis
- 4.6.1 Threat of New Entrants
- 4.6.2 Bargaining Power of Buyers/Consumers
- 4.6.3 Bargaining Power of Suppliers
- 4.6.4 Threat of Substitute Products
- 4.6.5 Intensity of Competitive Rivalry
5 MARKET SIZE AND GROWTH FORECASTS (VALUES)
- 5.1 By Product
- 5.1.1 Transparent Displays
- 5.1.2 Transparent Solar Panels
- 5.1.3 Smart Windows/Smart Glass
- 5.1.4 Transparent Conductive Films
- 5.1.5 Transparent Ceramics and Aluminum
- 5.1.6 Transparent Sensors and Others
- 5.2 By Material Type
- 5.2.1 Indium Tin Oxide (ITO)
- 5.2.2 Alternative TCOs (AZO, FTO)
- 5.2.3 Silver Nanowire and Metal Mesh
- 5.2.4 Carbon-Based Nanomaterials (Graphene, CNT)
- 5.2.5 Conductive Polymers (PEDOT:PSS)
- 5.3 By Technology
- 5.3.1 LCD/TFT
- 5.3.2 OLED and micro-OLED
- 5.3.3 Quantum-Dot and micro-LED
- 5.3.4 Thin-Film Photovoltaic (CIGS, Perovskite)
- 5.3.5 Electrochromic and SPD
- 5.4 By End-user Application
- 5.4.1 Consumer Electronics
- 5.4.2 Automotive and Transportation
- 5.4.3 Building and Infrastructure
- 5.4.4 Energy and Utilities (BIPV, Agrivoltaics)
- 5.4.5 Aerospace and Defense
- 5.4.6 Healthcare and Wearables
- 5.4.7 Retail and Digital Signage
- 5.5 By Geography
- 5.5.1 North America
- 5.5.1.1 United States
- 5.5.1.2 Canada
- 5.5.1.3 Mexico
- 5.5.2 Europe
- 5.5.2.1 Germany
- 5.5.2.2 United Kingdom
- 5.5.2.3 France
- 5.5.2.4 Italy
- 5.5.2.5 Spain
- 5.5.2.6 Nordics (Denmark, Sweden, Norway, Finland)
- 5.5.2.7 Rest of Europe
- 5.5.3 Asia-Pacific
- 5.5.3.1 China
- 5.5.3.2 Japan
- 5.5.3.3 South Korea
- 5.5.3.4 India
- 5.5.3.5 Southeast Asia
- 5.5.3.6 Australia
- 5.5.3.7 Rest of Asia-Pacific
- 5.5.4 South America
- 5.5.4.1 Brazil
- 5.5.4.2 Argentina
- 5.5.4.3 Rest of South America
- 5.5.5 Middle East
- 5.5.5.1 Gulf Cooperation Council Countries
- 5.5.5.2 Turkey
- 5.5.5.3 Rest of Middle East
- 5.5.6 Africa
- 5.5.6.1 South Africa
- 5.5.6.2 Nigeria
- 5.5.6.3 Rest of Africa
- 5.5.1 North America
6 COMPETITIVE LANDSCAPE
- 6.1 Market Concentration
- 6.2 Strategic Moves
- 6.3 Market Share Analysis
- 6.4 Company Profiles (includes Global level Overview, Market level overview, Core Segments, Financials as available, Strategic Information, Market Rank/Share for key companies, Products and Services, and Recent Developments)
- 6.4.1 BOE Technology Group Co., Ltd.
- 6.4.2 LG Display Co., Ltd.
- 6.4.3 Samsung Display Co., Ltd.
- 6.4.4 Corning Incorporated
- 6.4.5 AGC Inc.
- 6.4.6 NSG Group (Pilkington)
- 6.4.7 Saint-Gobain SA
- 6.4.8 Ubiquitous Energy Inc.
- 6.4.9 Brite Solar Inc.
- 6.4.10 ClearLED Ltd.
- 6.4.11 Panasonic Holdings Corp.
- 6.4.12 Cambrios Technology Corp.
- 6.4.13 Surmet Corporation
- 6.4.14 3M Company
- 6.4.15 DuPont de Nemours Inc.
- 6.4.16 PPG Industries Inc.
- 6.4.17 Guardian Industries Holdings
- 6.4.18 Shenzhen Nexnovo Technology Co., Ltd.
- 6.4.19 Shenzhen AuroLED Technology Co., Ltd.
- 6.4.20 Street Communication Inc.
- 6.4.21 Apple Inc. (Transparent AR Glass R&D)
- 6.4.22 JX Nippon Mining and Metals Corp.
- 6.4.23 Heraeus Holding GmbH
- 6.4.24 American Elements Corp.
7 MARKET OPPORTUNITIES AND FUTURE OUTLOOK
- 7.1 White-space and Unmet-Need Assessment

