
PUBLISHER: Mordor Intelligence | PRODUCT CODE: 1842427

PUBLISHER: Mordor Intelligence | PRODUCT CODE: 1842427
Level Sensor - Market Share Analysis, Industry Trends & Statistics, Growth Forecasts (2025 - 2030)
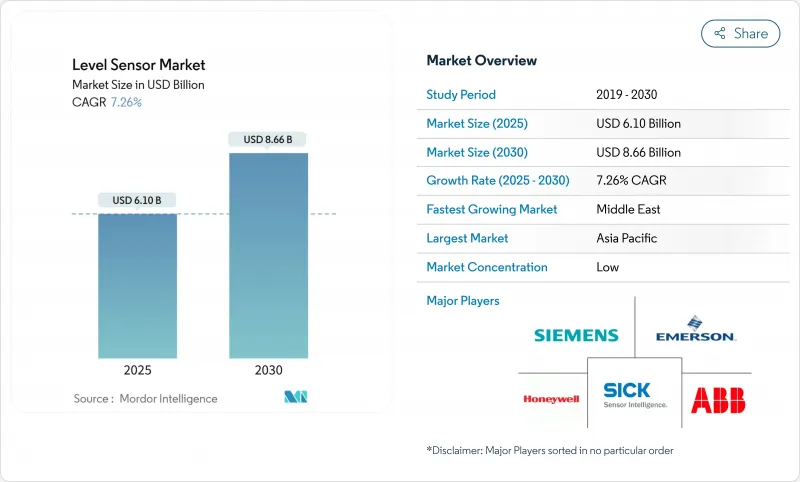
The level sensors market size is valued at USD 6.1 billion in 2025 and is forecast to reach USD 8.66 billion by 2030, advancing at a 7.26% CAGR.
Growth is propelled by industrial digitization programs, stringent global safety mandates, and the rapid shift to high-frequency 80 GHz radar platforms in demanding applications. Strong public-sector spending on desalination and wastewater megaprojects across Asia-Pacific is accelerating unit demand, while custody-transfer upgrades in North America reinforce premium pricing for ultra-high-accuracy radar designs. Manufacturers are also widening their product mix with IoT-ready transmitters and embedded self-diagnostics to align with predictive-maintenance strategies. Competitive intensity is rising as global leaders strengthen portfolios through acquisitions and alliances that combine complementary sensing, communications, and analytics capabilities.
Global Level Sensor Market Trends and Insights
Digitization-driven tank-farm automation surge in GCC
Aggressive digital-economy spending in Saudi Arabia and the UAE is modernizing terminal operations, elevating demand for networked level transmitters that feed real-time inventory dashboards and predictive-maintenance models. Vision 2030 programs funnel AI and 5G budgets toward industrial IoT, allowing level data to integrate seamlessly with ERP and emissions-monitoring systems. Suppliers with localized service hubs are seeing above-average order volumes as operators migrate from legacy float gauges to SIL-certified radar platforms.
Rapid build-out of desalination & wastewater megaprojects
Asia-Pacific capital plans for membrane desalination lines and advanced biological wastewater treatment require precise, corrosion-resistant level sensing to manage chemical dosing and sludge processes. Plants now embed AI modules that leverage continuous level data for energy optimization, lifting adoption of radar and ultrasonic instruments rated for high-salinity media. Parallel investments in the Middle East's 46% share of global desalination capacity reinforce long-term unit demand.
EMI-induced accuracy drift in steel mills
High electromagnetic fields near induction furnaces distort electronic level signals, driving costly recalibration cycles and limiting uptake of radar sensors in India's rapidly growing steel sector. Vendors are testing multilayer shielding and digital filtering, yet price-sensitive operators defer upgrades until robust, affordable solutions emerge.
Other drivers and restraints analyzed in the detailed report include:
- Mandatory SIL-3 safety audits in European chemical parks
- LNG FSRU orders accelerating point-level demand
- Low acceptance of guided-wave radar in hygienic applications
For complete list of drivers and restraints, kindly check the Table Of Contents.
Segment Analysis
Point devices dominated 2024 with a 58% level sensors market share, favored for binary control in overfill and dry-run safeguards. Continuous measurement products, though smaller in shipment volume, are growing 8% annually as operators pursue real-time inventory tracking to cut working capital and energy use. The level sensors market size for continuous platforms is projected to exceed USD 3 billion by 2030, alongside the adoption of analytics-ready transmitters. Hybrid instruments that fuse switching and continuous functions in a single housing are winning conversions in space-constrained skids, widening supplier differentiation.
The migration to 80 GHz radar is powering continuous segment uptake in water, chemical, and food plants that battle foam, vapor, and dust. Integrated diagnostics now flag buildup, offering predictive-cleaning prompts and elevating uptime. Suppliers that combine IO-Link or wireless protocols into continuous gauges capture OEM design wins as machine builders standardize on smart-sensor architectures.
Contact technologies retained 64% of 2024 revenue, anchored by hydrostatic and magnetostrictive probes valued for mechanical simplicity. Yet non-contact devices are expanding 8.2% each year, riding demand for contamination-free measurement in foods, pharmaceuticals, and corrosive liquids. Radar and ultrasonic models avoid downtime tied to wetted parts, and Bluetooth-enabled units ease commissioning via mobile apps. Non-contact platforms now represent nearly one-third of level sensors market size and are forecast to surpass contact shipments in high-value chemical and energy projects by 2029.
Radar progress is most visible: FMCW architectures leverage 80 GHz frequencies for narrow beams that navigate internal structures. Suppliers also push firmware advances that remove false echoes in agitator-equipped tanks. Ultrasonic retains traction where cost sensitivity tops performance, especially in municipal water projects, but its share edges lower as radar pricing falls.
Level Sensor Market is Segmented by Monitoring Type (Point Level Sensors and Continuous Level Sensors), Technology (Contant Sensors and Non-Contact Sensors), Sensor Technology (Capacitive, Conductive, Optical/Photoelectric and More), Component, Detection Medium, End-User Industry (Oil & Gas, Power Generation and More), Geography. The Market Forecasts are Provided in Terms of Value (USD).
Geography Analysis
Asia-Pacific led the level sensors market with 45% revenue in 2024, underpinned by extensive industrial automation in China and accelerating capital investment in India and Southeast Asia. Battery-electric vehicle value-chains alone require thousands of chemically resistant radar gauges for electrolyte, slurry, and solvent tanks. Regional wastewater infrastructure, buoyed by urbanization, fuels orders for continuous sensors tied to AI-driven control loops. Suppliers investing in localized manufacturing and aftersales networks deepen share across tier-2 and tier-3 cities.
The Middle East registers the fastest regional CAGR at 9% from 2025-2030. Tank-farm automation programs linked to Vision 2030 and ADNOC downstream projects, plus record desalination capacity additions, sustain multi-year demand for SIL-rated radar and smart point switches. Logistics corridors such as the India-Middle East-Europe Economic Corridor amplify sensor orders as new terminals and pipelines require inventory monitoring.
North America continues to modernize custody-transfer tanks with 80 GHz radar for revenue-critical volume calculations, while shale-related water-handling operations adopt ultrasonic and radar devices resistant to sediment and hydrocarbons. European chemical parks prioritize SIL-3 upgrades and sustainability metrics, boosting demand for certified radar units and cloud-enabled diagnostics. South American mining and pulp operations expand gradually, though local OEMs face cost hurdles meeting international SIL standards, moderating near-term penetration.
- ABB Ltd
- Emerson Electric Co.
- Honeywell International Inc.
- Siemens AG
- Endress + Hauser AG
- Sick AG
- VEGA Grieshaber KG
- KROHNE Group
- Baumer Group
- TE Connectivity Ltd
- First Sensor AG
- BinMaster Inc.
- AMETEK Inc.
- Pepperl + Fuchs SE
- Anton Paar GmbH
- Omega Engineering Inc.
- ifm electronic GmbH
- Yokogawa Electric Corp.
- Omron Corporation
- Rockwell Automation Inc.
- KOBOLD Messring GmbH
Additional Benefits:
- The market estimate (ME) sheet in Excel format
- 3 months of analyst support
TABLE OF CONTENTS
1 INTRODUCTION
- 1.1 Study Deliverables
- 1.2 Study Assumptions and Market Definition
- 1.3 Scope of the Study
2 RESEARCH METHODOLOGY
3 EXECUTIVE SUMMARY
4 MARKET LANDSCAPE
- 4.1 Market Overview
- 4.2 Market Drivers
- 4.2.1 Digitisation-driven Tank-Farm Automation Surge in Gulf Cooperation Council (GCC)
- 4.2.2 Rapid Build-out of Desalination and Waste-water Megaprojects Across Asia-Pacific
- 4.2.3 Mandatory SIL-3 Safety Audits in European Chemical Parks Boosting Radar Installations
- 4.2.4 Transition to 80 GHz FMCW Radar in North-American Custody-Transfer Systems
- 4.2.5 Battery-Electric Vehicle (BEV) Electrolyte Production Capacity Investments in China
- 4.2.6 LNG Floating Storage and Regasification (FSRU) Orders Accelerating Point-Level Demand
- 4.3 Market Restraints
- 4.3.1 EMI-Induced Accuracy Drift in Steel Mills Limiting Adoption in India
- 4.3.2 Low Acceptance of Guided-Wave Radar in Hygienic Pharma Lines (US and EU GMP)
- 4.3.3 Shortage of 8-inch GaAs MMIC Foundry Capacity for 80 GHz Front-ends
- 4.3.4 Complex SIL Certification Cost for Small OEMs in South America
- 4.4 Value / Supply-Chain Analysis
- 4.5 Regulatory Outlook
- 4.5.1 ATEX and IECEx Hazard-Zone Updates
- 4.6 Technological Outlook
- 4.6.1 AI-Enabled Self-Calibrating Level Sensors
- 4.7 Porter's Five Forces Analysis
- 4.7.1 Threat of New Entrants
- 4.7.2 Threat of Substitutes
- 4.7.3 Bargaining Power of Suppliers
- 4.7.4 Bargaining Power of Buyers
- 4.7.5 Competitive Rivalry
5 MARKET SIZE AND GROWTH FORECASTS (VALUE)
- 5.1 By Monitoring Type
- 5.1.1 Point Level Sensors
- 5.1.1.1 Mechanical and Magnetic Float
- 5.1.1.2 Capacitance
- 5.1.1.3 Vibratory Probe
- 5.1.1.4 Conductivity
- 5.1.1.5 Other Point Sensors
- 5.1.2 Continuous Level Sensors
- 5.1.2.1 Laser
- 5.1.2.2 Ultrasonic
- 5.1.2.3 Magnetostrictive
- 5.1.2.4 Radar
- 5.1.2.5 Other Continuous Sensors
- 5.1.1 Point Level Sensors
- 5.2 By Technology (Device Type)
- 5.2.1 Contact Sensors
- 5.2.1.1 Hydrostatic
- 5.2.1.2 Magnetostrictive
- 5.2.1.3 Guided-Wave Radar
- 5.2.2 Non-Contact Sensors
- 5.2.2.1 Ultrasonic
- 5.2.2.2 24 GHz Radar
- 5.2.2.3 80 GHz Radar
- 5.2.2.4 Optical/IR
- 5.2.1 Contact Sensors
- 5.3 By Sensor Technology
- 5.3.1 Capacitive
- 5.3.2 Conductive
- 5.3.3 Optical/Photoelectric
- 5.3.4 Microwave/Radar
- 5.3.5 Ultrasonic
- 5.3.6 Vibratory Fork
- 5.4 By Component
- 5.4.1 Sensing Element and Probe
- 5.4.2 Transmitter/Converter
- 5.4.3 Display and Controller
- 5.5 By Detection Medium
- 5.5.1 Liquids
- 5.5.2 Solids (Bulk)
- 5.5.3 Interface (Oil-Water, etc.)
- 5.6 By End-user Industry
- 5.6.1 Oil and Gas
- 5.6.1.1 Upstream
- 5.6.1.2 Mid/Downstream
- 5.6.2 Power Generation
- 5.6.2.1 Thermal
- 5.6.2.2 Nuclear
- 5.6.3 Mining and Metal Processing
- 5.6.4 Chemical
- 5.6.4.1 Basic Chemicals
- 5.6.4.2 Specialty and Fine Chemicals
- 5.6.5 Food and Beverage
- 5.6.5.1 Dairy
- 5.6.5.2 Brewery
- 5.6.5.3 Desalination
- 5.6.6 Water and Waste-water Management
- 5.6.7 Pharmaceuticals and Bioprocessing
- 5.6.8 Cement and Pulp and Paper
- 5.6.1 Oil and Gas
- 5.7 By Geography
- 5.7.1 North America
- 5.7.1.1 United States
- 5.7.1.2 Canada
- 5.7.1.3 Mexico
- 5.7.2 Europe
- 5.7.2.1 Germany
- 5.7.2.2 United Kingdom
- 5.7.2.3 France
- 5.7.2.4 Rest of Europe
- 5.7.3 Asia-Pacific
- 5.7.3.1 China
- 5.7.3.2 India
- 5.7.3.3 Japan
- 5.7.3.4 Rest of Asia-Pacific
- 5.7.4 South America
- 5.7.4.1 Brazil
- 5.7.4.2 Argentina
- 5.7.4.3 Rest of South America
- 5.7.5 Middle East
- 5.7.5.1 GCC Countries
- 5.7.5.2 Turkey
- 5.7.5.3 Rest of Middle East
- 5.7.6 Africa
- 5.7.6.1 South Africa
- 5.7.6.2 Nigeria
- 5.7.6.3 Rest of Africa
- 5.7.1 North America
6 COMPETITIVE LANDSCAPE
- 6.1 Market Concentration
- 6.2 Strategic Moves
- 6.3 Market Share Analysis
- 6.4 Company Profiles (includes Global level Overview, Market level overview, Core Segments, Financials as available, Strategic Information, Market Rank/Share, Products and Services, and Recent Developments)
- 6.4.1 ABB Ltd
- 6.4.2 Emerson Electric Co.
- 6.4.3 Honeywell International Inc.
- 6.4.4 Siemens AG
- 6.4.5 Endress + Hauser AG
- 6.4.6 Sick AG
- 6.4.7 VEGA Grieshaber KG
- 6.4.8 KROHNE Group
- 6.4.9 Baumer Group
- 6.4.10 TE Connectivity Ltd
- 6.4.11 First Sensor AG
- 6.4.12 BinMaster Inc.
- 6.4.13 AMETEK Inc.
- 6.4.14 Pepperl + Fuchs SE
- 6.4.15 Anton Paar GmbH
- 6.4.16 Omega Engineering Inc.
- 6.4.17 ifm electronic GmbH
- 6.4.18 Yokogawa Electric Corp.
- 6.4.19 Omron Corporation
- 6.4.20 Rockwell Automation Inc.
- 6.4.21 KOBOLD Messring GmbH
7 MARKET OPPORTUNITIES AND FUTURE OUTLOOK
- 7.1 White-Space and Unmet-Need Assessment

