
PUBLISHER: Mordor Intelligence | PRODUCT CODE: 1842436

PUBLISHER: Mordor Intelligence | PRODUCT CODE: 1842436
Printed Sensor - Market Share Analysis, Industry Trends & Statistics, Growth Forecasts (2025 - 2030)
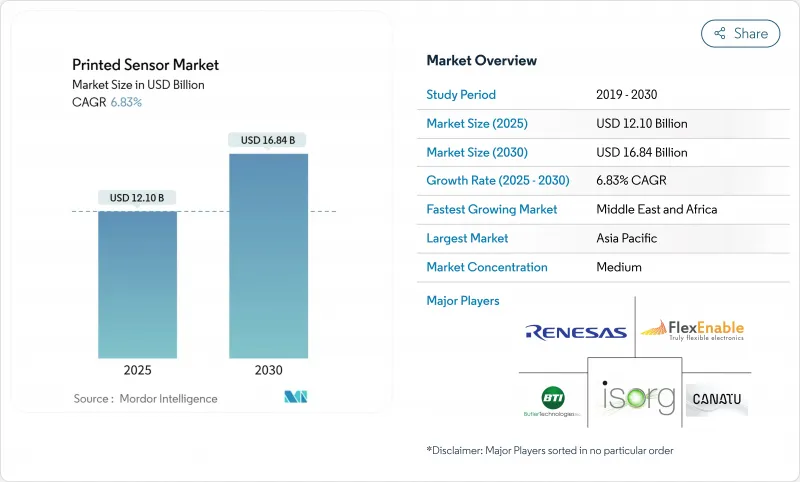
The printed sensor market size stands at USD 12.1 billion in 2025 and is on track to reach USD 16.84 billion by 2030, advancing at a 6.83% CAGR.
The shift from rigid micro-electromechanical sensors toward flexible, lightweight designs is the core growth engine, helped by roll-to-roll manufacturing that cuts material waste by up to 90% and slashes unit costs. High-volume consumer IoT curved automotive dashboards, and wearable health devices all depend on these cost reductions. Government stimulus programs in North America and Europe are lowering the capital barrier for new pilot lines, while Asia-Pacific suppliers leverage long production runs to keep average selling prices competitive. Progress in conductive inks, mesh electrodes, and hybrid substrates is widening the performance gap versus conventional MEMS, positioning printed arrays as the default choice wherever low-profile, conformable sensors add value.
Global Printed Sensor Market Trends and Insights
Rapid Adoption of Flexible & Wearable Medical Devices
Asia-Pacific healthcare systems are scaling remote monitoring programs, elevating demand for biosensors that wrap comfortably around skin and textiles. Sweat-based platforms now profile inflammation markers, hydration, and glucose without puncturing the body. Flexible hybrid electronics integrate printed arrays with silicon logic, forming patches that relay real-time vitals over Bluetooth to hospital dashboards, a capability forecast to lift the FHE market past USD 67 billion by 2030. Hospital networks use these continuous data streams to shorten inpatient stays and flag complications early. With unit prices falling under USD 3, even mid-income providers can equip postoperative patients at discharge, accelerating regional adoption. Regulatory bodies in Japan, Korea, and China are formalizing fast-track approvals for wearable diagnostics, further supporting volume growth.
Automotive Shift to Curved HMI Dashboards
Global automakers are replacing mechanical knobs with sweeping touch surfaces that follow interior contours. PolyTC(R) metal-mesh capacitive layers from KURZ are deposited on PET using roll-to-roll lines and still register touch through 2.5 mm of decorative plastic, satisfying OEM styling goals. These sensors survive the 85 °C heat and 40 °C cold of qualification cycles, preserving responsiveness over vehicle life. Tier-1s are also embedding printed arrays into steering wheels and armrests to detect driver engagement and adjust airbags or alerts accordingly. Software-defined cockpit platforms capitalize on the uniform sensor grid, allowing over-the-air upgrades that refresh control layouts without hardware swaps. Europe and North America lead deployments today, but Chinese EV brands are close behind with fully moulded capacitive panels slated for 2026 launches.
Lack of Standardized Test Protocols
Stretchable biosensors bend, twist, and compress with the body, behaviours not covered by legacy IEC 60601 shock or vibration tests. Brands must invent in-house regimes for elongation, wash durability, and skin-contact biocompatibility, slowing design cycles. UL Solutions summarises the maze of CE, FDA, and IEC requirements that differ by product class and geography. Industry groups are drafting common load-case matrices, yet consensus remains elusive because gait monitors, neonatal patches, and smart jerseys all experience unique strain patterns. Qualification delays raise working capital needs and dissuade smaller entrants, capping near-term market penetration.
Other drivers and restraints analyzed in the detailed report include:
- Transition to Solid-State Gas Detection
- Roll-to-Roll Cost Advantage in IoT Applications
- Limited Stability Under Thermal Cycling
For complete list of drivers and restraints, kindly check the Table Of Contents.
Segment Analysis
Touch/Capacitive units led the printed sensor market with 31.5% share in 2024, a dominance tied to their ubiquity across phones, laptops, and infotainment displays. Biosensors, though smaller today, are growing at an 11.8% CAGR as hospitals shift to continuous assessment outside clinical walls. This wave is anchored by nanozyme chemistry that enables non-invasive detection of lactate, glucose, and infection markers. Regulatory green lights for remote patient monitoring refund schemes in Canada and Germany widen the addressable base. Gas/Chemical, Temperature, Pressure/Force, and Piezo/Strain categories fill niche roles in safety, battery packs, and structural health, with breakthroughs such as 122 ppb ammonia detection enabling new compliance solutions. Integrated multi-modal stacks combine touch, pressure, and biometrics in a single laminate without enlarging the footprint, winning space-constrained designs in smart rings and earbuds.
Second paragraph: Biosensor patches priced under USD 10 encourage mass screening programs across Southeast-Asian clinics, improving chronic disease tracking. Pressure arrays printed on TPU film feed force data to AI gait engines that flag fall risk in elder-care homes. Gas sensors embedded inside lithium-ion modules offer early venting alerts, helping pack makers comply with UN 38.3 safety rules. Piezo threads woven into factory belts decode strain, letting predictive maintenance software schedule downtimes before catastrophic tears. This functional diversity keeps suppliers agile; custom ink chemistries, substrate picks, and electrode geometries shift from project to project, forcing a modular production toolkit.
Screen printing captured 42% of revenue in 2024, thanks to proven throughput, thick-film build-up, and equipment amortized over decades in ceramics and PCBs. Typical line widths around 100 µm satisfy most capacitive and resistive formats, while recent mesh upgrades push resolution nearer 50 µm. Inkjet retains relevance for short runs where designs evolve weekly; brands can pivot without fabricating new screens. Aerosol-Jet, electrohydrodynamic jets, and MEMS micro-nozzle arrays post the fastest 13.6% CAGR by depositing sub-10 µm tracks on 3D contours, perfect for antennas snaking around housings or fine-pitch temperature grids inside batteries.
Second paragraph: Flexographic presses win when length hits hundreds of meters and colour registration is forgiving. Gravure excels at uniform nano-thick coatings where optical clarity matters, such as transparent heaters on HUD windshields. Hybrid lines mix methods: inkjet prints seed layers, laser sintering fuses copper, and screen coating applies protective dielectric topcoats. The choice shapes cost, feature density, and reliability, so tier-1s increasingly co-locate multiple machines. Emerging AI vision systems adjust squeegee angle and jet dwell time in real time to hold tolerance, lifting yield beyond 98%.
Printed Sensors Market Segmented by Sensor Type (Touch / Capacitive, Temperature, and More), Printing Technology (Screen, Inkjet and More), Substrate (Plastic Films (PET, PEN), Paper and Paperboard and More), End-User (Consumer Electronics, Healthcare and Medical Devices and More). The Market Forecasts are Provided in Terms of Value (USD).
Geography Analysis
Asia-Pacific commanded 39.2% of the printed sensor market in 2024, backed by China's large-scale production capacity, Japan's material science depth, and South Korea's display majors. Local R&D consortia turn lab breakthroughs into pilot lines fast, shortening the cycle from concept to export. Government grants offset depreciation on new gravure presses that print OLED touch matrices, while universities spin off start-ups targeting hospital wearables. The regional pipeline includes textile-integrated respiration sensors and foldable touch foils for e-paper readers, diversifying revenue beyond phones.
North America leverages the CHIPS & Science Act, which earmarked funds for printed electronics testbeds, helping fabs overcome high capex. Partnerships between material suppliers and aerospace primes produce pressure arrays as thin as 25 µm to measure wing flex without aerodynamic penalty. The healthcare ecosystem anchors adoption: clinics run at-home monitoring pilots reimbursed by Medicare, validating business cases for biosensor patches. Research centers in Boston and Silicon Valley iterate ink formulations that sinter at 70 °C, compatible with heat-sensitive thermoplastics.
The Middle East posts the swiftest 9.3% CAGR through 2030 as Gulf states channel oil revenue into smart city blueprints. Dubai's Route 2020 Metro deploys printed strain gauges on tracks for predictive maintenance, while Riyadh's giga projects embed air-quality arrays across construction sites to meet new environmental codes. Foreign joint ventures set up roll-to-roll lines near Jebel Ali, exploiting duty-free zones to serve Europe and Africa. Europe retains a strong foothold, notably Germany where Tier-1s refine curved HMI panels. The EU's Chips for Europe Initiative adds EUR 7.9 billion to semiconductor capacity including flexible hybrids, anchoring long-term competitiveness.
- FlexEnable Ltd.
- ISORG SA
- Plastic Logic HK Ltd.
- Renesas Electronics Corp.
- Butler Technologies Inc.
- Canatu Oy
- SPEC Sensors LLC
- Peratech Holdco Ltd.
- Pressure Profile Systems Inc.
- Tekscan Inc.
- Thin Film Electronics ASA
- Molex LLC
- Interlink Electronics Inc.
- Fujifilm Dimatix Inc.
- Heraeus Noblelight GmbH
- Nissha Co. Ltd.
- T+Ink Inc.
- GSI Technologies LLC
- Brewer Science Inc.
- Henkel AG and Co. KGaA
Additional Benefits:
- The market estimate (ME) sheet in Excel format
- 3 months of analyst support
TABLE OF CONTENTS
1 INTRODUCTION
- 1.1 Study Assumptions and Market Definition
- 1.2 Scope of the Study
2 RESEARCH METHODOLOGY
3 EXECUTIVE SUMMARY
4 MARKET LANDSCAPE
- 4.1 Market Drivers
- 4.1.1 Rapid adoption of flexible and wearable medical devices across Asia-Pacific
- 4.1.2 Automotive shift to curved HMI dashboards requiring large-area capacitive printed sensors
- 4.1.3 Transition from mechanical to solid-state gas detection in smart factories (Europe-led)
- 4.1.4 Roll-to-roll cost advantage versus MEMS in high-volume consumer IoT nodes
- 4.2 Market Restraints
- 4.2.1 Limited long-term stability of conductive inks under automotive thermal cycling
- 4.2.2 Lack of standardized test protocols for stretchable biosensors slows OEM qualification
- 4.2.3 Capital intensity of converting existing PCB lines to roll-to-roll hybrid lines
- 4.2.4 Intellectual-property fragmentation around PEDOT:PSS formulations driving royalty costs
- 4.3 Value / Supply-Chain Analysis
- 4.4 Regulatory Outlook
- 4.5 Technological Outlook
- 4.6 Porter's Five Forces Analysis
- 4.6.1 Threat of New Entrants
- 4.6.2 Bargaining Power of Buyers
- 4.6.3 Bargaining Power of Suppliers
- 4.6.4 Threat of Substitutes
- 4.6.5 Intensity of Rivalry
- 4.7 Technology Snapshot
- 4.7.1 Inkjet Printing
- 4.7.2 Screen Printing
- 4.7.3 Flexographic Printing
- 4.7.4 Gravure Printing
- 4.7.5 Aerosol-Jet and Other Emerging Methods
- 4.8 Investment Analysis
- 4.8.1 VC Funding Trends
- 4.8.2 MandA Landscape
5 MARKET SIZE AND GROWTH FORECASTS (VALUE)
- 5.1 By Sensor Type
- 5.1.1 Touch/Capacitive
- 5.1.2 Pressure / Force
- 5.1.3 Biosensors
- 5.1.4 Gas/Chemical
- 5.1.5 Piezo/Strain
- 5.1.6 Temperature
- 5.2 By Printing Technology
- 5.2.1 Screen
- 5.2.2 Inkjet
- 5.2.3 Flexographic
- 5.2.4 Gravure
- 5.2.5 Aerosol-Jet and Others
- 5.3 By Substrate
- 5.3.1 Plastic Films (PET, PEN)
- 5.3.2 Paper and Paperboard
- 5.3.3 Glass
- 5.3.4 Textiles and Elastomers
- 5.4 By End-User
- 5.4.1 Consumer Electronics
- 5.4.2 Healthcare and Medical Devices
- 5.4.3 Industrial and Manufacturing
- 5.4.4 Automotive and Transportation
- 5.4.5 Aerospace and Defense
- 5.4.6 Others (Smart Packaging, Agriculture)
- 5.5 By Geography
- 5.5.1 North America
- 5.5.1.1 United States
- 5.5.1.2 Canada
- 5.5.2 Europe
- 5.5.2.1 Germany
- 5.5.2.2 France
- 5.5.2.3 United Kingdom
- 5.5.2.4 Italy
- 5.5.2.5 Rest of Europe
- 5.5.3 Asia-Pacific
- 5.5.3.1 China
- 5.5.3.2 Japan
- 5.5.3.3 South Korea
- 5.5.3.4 India
- 5.5.3.5 Rest of Asia-Pacific
- 5.5.4 South America
- 5.5.4.1 Brazil
- 5.5.4.2 Rest of South America
- 5.5.5 Middle East
- 5.5.5.1 GCC
- 5.5.5.2 Turkey
- 5.5.5.3 Rest of Middle East
- 5.5.6 Africa
- 5.5.6.1 South Africa
- 5.5.6.2 Rest of Africa
- 5.5.1 North America
6 COMPETITIVE LANDSCAPE
- 6.1 Strategic Moves
- 6.1.1 Partnerships and Licensing
- 6.1.2 Capacity Expansions
- 6.2 Market Share Analysis
- 6.3 Company Profiles (includes Global level Overview, Market level overview, Core Segments, Financials as available, Strategic Information, Market Rank/Share for key companies, Products and Services, and Recent Developments)
- 6.3.1 FlexEnable Ltd.
- 6.3.2 ISORG SA
- 6.3.3 Plastic Logic HK Ltd.
- 6.3.4 Renesas Electronics Corp.
- 6.3.5 Butler Technologies Inc.
- 6.3.6 Canatu Oy
- 6.3.7 SPEC Sensors LLC
- 6.3.8 Peratech Holdco Ltd.
- 6.3.9 Pressure Profile Systems Inc.
- 6.3.10 Tekscan Inc.
- 6.3.11 Thin Film Electronics ASA
- 6.3.12 Molex LLC
- 6.3.13 Interlink Electronics Inc.
- 6.3.14 Fujifilm Dimatix Inc.
- 6.3.15 Heraeus Noblelight GmbH
- 6.3.16 Nissha Co. Ltd.
- 6.3.17 T+Ink Inc.
- 6.3.18 GSI Technologies LLC
- 6.3.19 Brewer Science Inc.
- 6.3.20 Henkel AG and Co. KGaA
7 MARKET OPPORTUNITIES AND FUTURE OUTLOOK
- 7.1 White-space and Unmet Need Analysis

