
PUBLISHER: Mordor Intelligence | PRODUCT CODE: 1842458

PUBLISHER: Mordor Intelligence | PRODUCT CODE: 1842458
Radiation Dose Management - Market Share Analysis, Industry Trends & Statistics, Growth Forecasts (2025 - 2030)
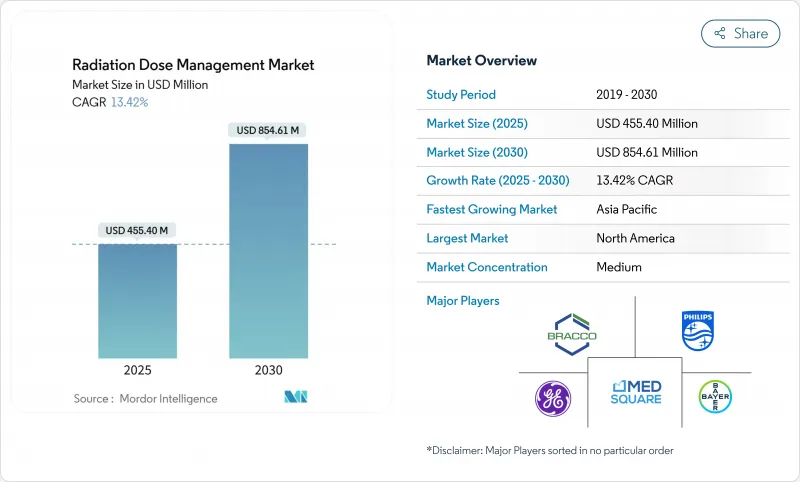
The radiation dose management market reached USD 455.40 million in 2025 and is on track to generate USD 854.61 million by 2030, advancing at a strong 13.42% CAGR.
Growth rests on tighter radiation-safety regulations, the rapid shift to precision imaging in oncology, and the maturing of AI-based dose-optimization tools. Hospitals now treat compliance as a board-level priority because new diagnostic reference level mandates carry financial penalties, while CT and hybrid-imaging volumes keep rising in cancer care. Cloud analytics lower ownership costs for resource-constrained facilities, and integrated platforms replace point solutions as health systems seek seamless workflows. Competition intensifies as imaging OEMs bundle dose-tracking into existing equipment and pure-play vendors highlight AI capabilities, creating a landscape in which interoperability and real-time analytics sway purchasing decisions.
Global Radiation Dose Management Market Trends and Insights
Stringent DRL mandates for radiology
Regulators have moved from voluntary guidance to mandatory dose ceilings, forcing every imaging provider to embed tracking at the scanner level. The FDA now requires CT systems to display cumulative dose and maintain automated logs, a shift that steers procurement toward scanners with built-in monitoring. The Joint Commission followed with 2024 accreditation clauses that oblige hospitals to audit radiation safety programs annually, spurring demand for reporting software. Europe mirrors this stance through the Medical Device Regulation, which ties market access to evidence of dose optimization. In the United States, CMS quality measures link reimbursement to compliance, so executives view dose management as revenue protection rather than an optional upgrade. Collectively, these rules turn the radiation dose management market into a must-have layer across all imaging modalities.
Rising CT and hybrid-imaging volumes in oncology workflows
Cancer care now relies on serial CT, PET-CT and SPECT-CT to monitor therapy response, raising cumulative patient exposure and intensifying oversight. A single PET-CT can exceed 20 mSv, edging close to annual occupational limits for staff, and patients typically undergo several scans per treatment cycle. Total-body PET systems mitigate exposure yet remain limited to specialized centers, keeping dose concerns high. Pediatric and young-adult oncology heightens the urgency because lifetime risk models penalize excess radiation. AI-driven protocol personalization enters here, refining settings per patient history and thus lowering total dose without compromising image quality. This workflow dependence on advanced monitoring cements oncology as the anchor segment for the radiation dose management market.
Budget constraints in community hospitals and LMICs
Facilities operating on slim margins weigh dose-tracking purchases against immediate patient-care needs. A full platform can cost USD 50,000-200,000, a figure difficult to justify without direct reimbursement incentives. Many low-to-middle-income nations still focus on expanding basic imaging capacity, so sophisticated monitoring remains secondary. While vendors offer leasing and SaaS terms, capital scarcity keeps uptake uneven and sustains a two-tier structure within the radiation dose management market.
Other drivers and restraints analyzed in the detailed report include:
- Cloud-based analytics lowering total cost of ownership
- AI-powered real-time dose-alerting gaining regulatory clearances
- Integration hurdles with legacy PACS/RIS ecosystems
For complete list of drivers and restraints, kindly check the Table Of Contents.
Segment Analysis
Integrated platforms accounted for 45.23% of the radiation dose management market in 2024 and are growing at 17.12% CAGR. This dominance stems from unified dashboards that track exposure, optimize protocols and auto-generate regulatory reports in one workflow. Health systems prefer fewer vendors, lower training overhead and single-sign-on usability. Standalone trackers retain niches-for example, nuclear-medicine dosimetry-yet face margin pressure because platform providers bundle equivalent modules at attractive prices. Managed services post the fastest gains as hospitals outsource medical-physics tasks. Vendors with deep clinical support therefore secure long-term contracts, reinforcing platform stickiness within the radiation dose management market.
Professional services also rise as institutions seek help interpreting benchmarks and closing compliance gaps. Advisory revenue complements software subscriptions, enlarging total customer lifetime value. Overall, the integrated-approach narrative reinforces a migration away from siloed applications toward ecosystems that scale across modalities, keeping integrated suites at the center of the radiation dose management market strategy.
On-premise installations still hold 59.45% share, a testament to privacy rules and ingrained risk aversion, yet cloud solutions are climbing at 16.78% CAGR. Larger enterprises often adopt hybrid models that analyze data in the cloud while retaining images locally. This strategy respects residency laws while unlocking AI and advanced benchmarking. For community hospitals, pay-as-you-go pricing eliminates large capital outlays, widening access to the radiation dose management industry's newest tools.
Total cost of ownership tilts further toward the cloud when GPU-intensive AI inference and continuous software updates enter the equation. Vendors showcase encrypted overlays and region-specific storage zones to soothe regulators. Although the debate on sovereignty persists, the performance and economic benefits keep migration steady. As a result, cloud architectures are projected to command a far larger slice of the radiation dose management market by 2030, especially in systems modernizing multiple sites simultaneously.
The Radiation Dose Management Market Report is Segmented by Products & Services (Stand-Alone Dose-Tracking Software, Integrated Dose-Management Platforms, and More), Deployment Mode (OnPremise and Cloud), Modality (CT, Nuclear Medicine, and More), Application (Oncology, Cardiology and More), End User (Hospital, Ambulatory & Imaging Centers and More), and Geography. The Market Forecasts are Provided in Terms of Value (USD).
Geography Analysis
North America owned 33.23% of the radiation dose management market in 2024 on the strength of the Joint Commission's enforcement and CMS linking optimization to reimbursements. Early FDA clearances for AI tools give U.S. health systems first mover advantage, and Canada follows with its own dose-reporting standards. Mexico shows rising traction in private hospital chains, though adoption still lags the United States. Legacy PACS saturation occasionally slows rollouts, yet widespread EHR connectivity supports enterprise-wide benchmarking, keeping the region firmly ahead in absolute spending.
Asia-Pacific is the fastest-growing arena, posting a 15.03% CAGR through 2030. India's expansive hospital-building program and China's digital-health investments lead volumes, while Japan confronts aging demographics that drive imaging intensity. Australia and South Korea mirror developed-market patterns with hybrid deployment preferences and quick uptake of AI modules. Southeast Asian countries prioritize scanner procurement first but increasingly bundle dose management to satisfy new national guidelines. This broad spectrum of maturity turns APAC into a patchwork where vendors must adapt pricing and deployment models locally, yet the aggregated opportunity remains the most dynamic segment of the radiation dose management market.
Europe grows steadily as MDR harmonization simplifies vendor certification across member states. Germany, France and the United Kingdom spearhead installations, with Nordic nations achieving near-universal compliance due to integrated care systems. Southern Europe catches up as fiscal constraints ease and digital health funding rises. Data-sovereignty considerations encourage hybrid solutions that couple local storage with cloud analytics, a configuration vendors now bake into proposals by default. Brexit's regulatory divergence adds paperwork but has not curtailed demand in the UK, where NHS modernization plans include dose safety metrics. Collectively, European procurement maintains a disciplined, safety-first posture that sustains predictable expansion of the radiation dose management market.
- Agfa-Gevaert
- Bayer
- Bracco Imaging S.p.A
- Canon Medical Informatics
- FUJIFILM
- GE HealthCare Technologies Inc.
- Guerbet SA
- Koninklijke Philips
- INFINITT Healthcare
- Landauer, Inc.
- Medsquare
- Mirion Technologies
- Novarad
- PACSHealth, LLC
- Qaelum
- Sectra
- Siemens Healthineers
- Sun Nuclear (Mirion)
- Thermo Fisher Scientific
- Volpara Health
Additional Benefits:
- The market estimate (ME) sheet in Excel format
- 3 months of analyst support
TABLE OF CONTENTS
1 Introduction
- 1.1 Study Assumptions and Market Definition
- 1.2 Scope of the Study
2 Research Methodology
3 Executive Summary
4 Market Landscape
- 4.1 Market Overview
- 4.2 Market Drivers
- 4.2.1 Stringent DRL Mandates for Radiology
- 4.2.2 Rising CT & Hybrid-Imaging Procedure Volumes In Oncology Workflows
- 4.2.3 Cloud-Based Analytics Lowering Total Cost Of Ownership
- 4.2.4 AI-Powered Real-Time Dose-Alerting Gaining Regulatory Clearances
- 4.2.5 Shift To Photon-Counting CT Enabling Ultra-Low-Dose Protocols (UID)
- 4.2.6 Upcoming G7 Carbon-Reduction Targets Driving Energy-Efficient Imaging Suites
- 4.3 Market Restraints
- 4.3.1 Budget Constraints In Community Hospitals & LMICs
- 4.3.2 Integration Hurdles With Legacy PACS/RIS Ecosystems
- 4.3.3 Radiologist Shortages Slowing Protocol Optimisation Adoption
- 4.3.4 Data-Sovereignty Concerns Limiting Cloud Deployment
- 4.4 Value / Supply-Chain Analysis
- 4.5 Regulatory Landscape
- 4.6 Technology Outlook
- 4.7 Porter's Five Forces Analysis
- 4.7.1 Bargaining Power of Suppliers
- 4.7.2 Bargaining Power of Buyers
- 4.7.3 Threat of New Entrants
- 4.7.4 Threat of Substitutes
- 4.7.5 Intensity of Competitive Rivalry
5 Market Size and Growth Forecasts (Value-USD)
- 5.1 By Products & Services
- 5.1.1 Stand-alone Dose-Tracking Software
- 5.1.2 Integrated Dose-Management Platforms
- 5.1.3 Professional & Managed Services
- 5.2 By Deployment Mode
- 5.2.1 On-premise
- 5.2.2 Cloud / Web-hosted
- 5.3 By Modality
- 5.3.1 Computed Tomography (CT)
- 5.3.2 Fluoroscopy & Interventional X-ray
- 5.3.3 Nuclear Medicine / PET-CT
- 5.3.4 Radiography & Mammography
- 5.4 By Application
- 5.4.1 Oncology
- 5.4.2 Cardiology
- 5.4.3 Orthopaedics & Trauma
- 5.5 By End User
- 5.5.1 Hospitals (>300 beds)
- 5.5.2 Ambulatory & Imaging Centres
- 5.5.3 Others (Academic, CRO, Government)
- 5.6 By Geography
- 5.6.1 North America
- 5.6.1.1 United States
- 5.6.1.2 Canada
- 5.6.1.3 Mexico
- 5.6.2 Europe
- 5.6.2.1 Germany
- 5.6.2.2 United Kingdom
- 5.6.2.3 France
- 5.6.2.4 Italy
- 5.6.2.5 Spain
- 5.6.2.6 Rest of Europe
- 5.6.3 Asia-Pacific
- 5.6.3.1 China
- 5.6.3.2 Japan
- 5.6.3.3 India
- 5.6.3.4 Australia
- 5.6.3.5 South Korea
- 5.6.3.6 Rest of Asia-Pacific
- 5.6.4 Middle East and Africa
- 5.6.4.1 GCC
- 5.6.4.2 South Africa
- 5.6.4.3 Rest of Middle East and Africa
- 5.6.5 South America
- 5.6.5.1 Brazil
- 5.6.5.2 Argentina
- 5.6.5.3 Rest of South America
- 5.6.1 North America
6 Competitive Landscape
- 6.1 Market Concentration
- 6.2 Market Share Analysis
- 6.3 Company profiles (includes Global level Overview, Market level overview, Core Segments, Financials as available, Strategic Information, Market Rank/Share for key companies, Products and Services, and Recent Developments)
- 6.3.1 Agfa-Gevaert NV
- 6.3.2 Bayer AG
- 6.3.3 Bracco Imaging S.p.A
- 6.3.4 Canon Medical Informatics
- 6.3.5 FUJIFILM Holdings
- 6.3.6 GE HealthCare Technologies Inc.
- 6.3.7 Guerbet SA
- 6.3.8 Koninklijke Philips N.V
- 6.3.9 INFINITT Healthcare
- 6.3.10 Landauer, Inc.
- 6.3.11 Medsquare
- 6.3.12 Mirion Technologies
- 6.3.13 Novarad Corporation
- 6.3.14 PACSHealth, LLC
- 6.3.15 Qaelum NV
- 6.3.16 Sectra AB
- 6.3.17 Siemens Healthineers
- 6.3.18 Sun Nuclear (Mirion)
- 6.3.19 Thermo Fisher Scientific
- 6.3.20 Volpara Health
7 Market Opportunities and Future Outlook
- 7.1 White-Space and Unmet-Need Assessment

