
PUBLISHER: Mordor Intelligence | PRODUCT CODE: 1842514

PUBLISHER: Mordor Intelligence | PRODUCT CODE: 1842514
North America Online Travel - Market Share Analysis, Industry Trends & Statistics, Growth Forecasts (2025 - 2030)
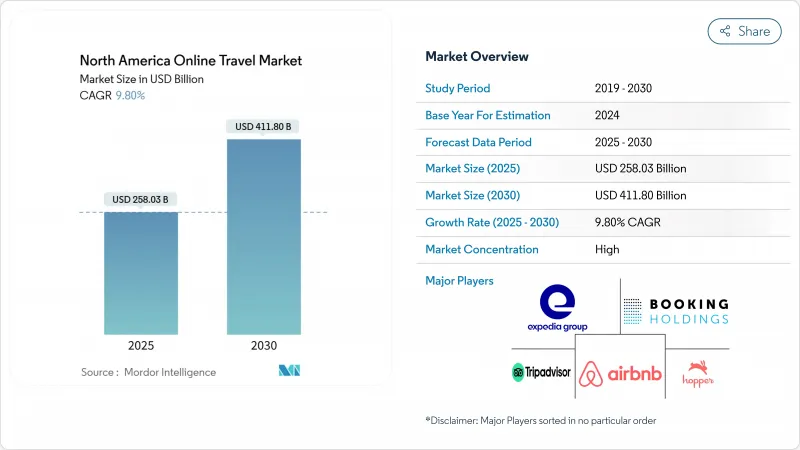
The North America online travel market currently stands at USD 258.03 billion in 2025 and is expected to climb to USD 411.80 billion by 2030, reflecting a 9.80% CAGR over the period.
Momentum comes from always-connected consumers, rapid mobile adoption, and new payment choices that shorten the path from inspiration to purchase. Mobile bookings already account for 57% of all online reservations, underscoring how smartphones have become the control center for trip planning. Airline New Distribution Capability (NDC), the spread of short-term rentals, and flexible "buy now, pay later" (BNPL) options are widening product choice and nudging transaction values upward. At the same time, state-level rules on home-sharing, stubbornly high merchant fees, and persistent cybersecurity risks work as brakes on what is otherwise a high-velocity expansion of the North America online travel market.
North America Online Travel Market Trends and Insights
Smartphone-Led Shift to In-App Bookings Across the United States
Mobile channels already capture 57% of transactions, and usage is climbing 12.2% each year. Younger cohorts drive the surge: Millennials hold a 45.11% share, and Generation Z bookings rise nearly 12% annually. Mobile interfaces support impulse reservations, location-based upselling, and richer ancillary sales that desktops rarely match. Strong 4G/5G coverage and 85% national mobile internet penetration provide the infrastructure base . As a result, the North America online travel market benefits from greater engagement, longer session times, and higher attach rates for excursions and insurance.
Airline NDC Adoption Enabling Personalized Offers
By deploying NDC, carriers push real-time, tailored bundles that lift ancillary revenue per passenger by 15% . Dynamic pricing widens fare classes while offering seat selection, lounge access, and carbon offsets inside one screen. OTAs and metasearch engines increasingly carry this enriched content, making NDC a network effect across the North America online travel market. Airlines able to combine loyalty data with NDC pipelines report sharper yield management and lower distribution costs, reinforcing competitive advantages that ripple through allied segments such as insurance and vacation packaging.
State-Level Restrictions on Short-Term Rentals in U.S. Cities
More than 70 metropolitan areas revised home-sharing laws between 2022 and 2024. Licensing caps and zoning bans thin inventory in top demand hubs, crimping the 44.10% accommodation segment. Hosts pivot to suburban zones, altering search patterns and length-of-stay norms inside the North America online travel market. Platforms divert marketing spend into compliant listings, slowing expansion and raising acquisition costs in regulated locales.
Other drivers and restraints analyzed in the detailed report include:
- BNPL Integration Boosting Conversion in Mexico
- AI-Powered Trip Planning Tools Elevating User Engagement
- High Merchant and Interchange Fees Raising Cost Pressures
For complete list of drivers and restraints, kindly check the Table Of Contents.
Segment Analysis
The travel accommodation segment commanded 44.1% of revenue in 2024, cementing its role as the anchor of the North America online travel market. Deep property inventory, from branded hotels to alternative rentals, keeps comparisons easy and prices transparent. At the same time, Vacation Packages are projected to advance 10.51% annually through 2030, outpacing every other service type. Personalized packaging engines blend flights, lodging, and on-ground activities, raising perceived value and pushing average order size higher. The "North America online travel market size" benefits as bundling drives cross-sell opportunities that lift overall spend per passenger.
Vacation packages also allow suppliers greater yield control by shifting inventory in shoulder seasons, smoothing revenue volatility that historically affected standalone hotel or air bookings. OTAs leverage machine-learning insights to tailor itineraries around traveler personas, shortening search time and lifting satisfaction scores. Transportation remains steady as multimodal search gains traction, with the U.S. Bureau of Transportation Statistics citing a 28% rise in online multimodal reservations in 2024. Ancillary categories-tours, insurance, experiences-embrace contextual selling; push notifications timed to weather or local events encourage incremental spend, adding depth to the North America online travel market.
Mobile accounted for 56.42% of all bookings in 2024, growing at a 11.92% CAGR into the next decade. That dominance shapes app interface priorities, from one-tap payment to biometric login. Gen Z contributes the fastest motor, boosting traffic and advocating social-media driven discovery that converts directly inside apps. The "North America online travel market size" sees incremental growth as richer in-app functionalities drive ancillary attachment rates and loyalty enrollments.
Desktops persist for multi-stop or high-value itineraries where larger screens aid comparison. Tablets play a research role, often seeding intent that later closes on smartphones. Suppliers experiment with QR code triggers at airports and attractions to capture real-time upsell moments. Continuous design optimization for smaller screens keeps bounce rates in check, preserving funnel efficiency across the North America online travel market.
The North America Online Travel Market Segments Into by Service Type (Transportation, Travel Accommodation, and More), Device Type (Desktop / Laptop, Mobile, and Tablet), Booking Mode (Online Travel Agencies, and Direct Supplier Websites / Apps), Purpose of Travel ( Leisure, and Business), Payment Method ( Credit / Debit Card, Digital Wallets, and More), Age Group (Generation Z (18-24), Millennials (25-40), and More), and Country.
List of Companies Covered in this Report:
- Expedia Group, Inc.
- Booking Holdings Inc.
- Airbnb, Inc.
- TripAdvisor LLC
- Hopper Inc.
- Marriott International, Inc.
- Hilton Worldwide Holdings Inc.
- Hyatt Hotels Corp.
- Choice Hotels International, Inc.
- Delta Air Lines, Inc.
- American Airlines Group Inc.
- United Airlines Holdings, Inc.
- Southwest Airlines Co.
- Carnival Corporation & plc
- Royal Caribbean Group
- Amtrak
- VRBO (Expedia)
- Trivago N.V.
- Kayak Software Corp.
- Google Travel (Alphabet Inc.)
Additional Benefits:
- The market estimate (ME) sheet in Excel format
- 3 months of analyst support
TABLE OF CONTENTS
1 Introduction
- 1.1 Study Assumptions & Market Definition
- 1.2 Scope of Study
2 Research Methodology
3 Executive Summary
4 Market Landscape
- 4.1 Market Drivers
- 4.1.1 Smartphone-Led Shift to In-App Bookings Across U.S.
- 4.1.2 Airline NDC Adoption Enabling Personalized Offers
- 4.1.3 Rising Popularity of Short-Term Rentals in Canada
- 4.1.4 Buy-Now-Pay-Later (BNPL) Integration Boosting Conversion in Mexico
- 4.1.5 AI-Powered Trip Planning Tools Elevating User Engagement
- 4.1.6 Government Easing of Border Restrictions & Canada eTA Uptake
- 4.2 Market Restraints
- 4.2.1 State-Level Restrictions on Short-Term Rentals in U.S. Cities
- 4.2.2 High Merchant & Interchange Fees Raising Cost Pressures
- 4.2.3 Cybersecurity & Data-Privacy Breaches Eroding Consumer Trust
- 4.2.4 Airline Capacity Constraints Driving Price Volatility
- 4.3 Value / Supply-Chain Analysis
- 4.4 Regulatory or Technological Outlook
- 4.5 Porter's Five Forces
- 4.5.1 Competitive Rivalry
- 4.5.2 Bargaining Power of Buyers
- 4.5.3 Bargaining Power of Suppliers
- 4.5.4 Threat of Substitutes
- 4.5.5 Threat of New Entrants
5 Market Size & Growth Forecasts (Value)
- 5.1 By Service Type
- 5.1.1 Transportation
- 5.1.1.1 Air Travel
- 5.1.1.2 Bus & Coach Travel
- 5.1.1.3 Rail Travel
- 5.1.1.4 Car Rental
- 5.1.1.5 Cruise
- 5.1.2 Travel Accommodation
- 5.1.2.1 Hotels & Resorts
- 5.1.2.2 Alternative Lodging / Rentals
- 5.1.3 Vacation Packages
- 5.1.4 Others (Activities, Travel Insurance, Ancillary)
- 5.1.1 Transportation
- 5.2 By Device Type
- 5.2.1 Desktop / Laptop
- 5.2.2 Mobile (Smartphone)
- 5.2.3 Tablet
- 5.3 By Booking Mode
- 5.3.1 Online Travel Agencies (OTAs)
- 5.3.2 Direct Supplier Websites / Apps
- 5.4 By Purpose of Travel
- 5.4.1 Leisure
- 5.4.2 Business
- 5.5 By Payment Method
- 5.5.1 Credit / Debit Card
- 5.5.2 Digital Wallets
- 5.5.3 BNPL & Installments
- 5.5.4 Other (Bank Transfer, Cash, Crypto)
- 5.6 By Age Group
- 5.6.1 Generation Z (18-24)
- 5.6.2 Millennials (25-40)
- 5.6.3 Generation X (41-56)
- 5.6.4 Baby Boomers (57-75)
- 5.7 By Country
- 5.7.1 United States
- 5.7.2 Canada
- 5.7.3 Mexico
6 Competitive Landscape
- 6.1 Strategic Moves
- 6.2 Market Share Analysis
- 6.3 Company Profiles (includes Global level Overview, Market level overview, Core Segments, Financials as available, Strategic Information, Market Rank/Share for key companies, Products & Services, and Recent Developments)
- 6.3.1 Expedia Group, Inc.
- 6.3.2 Booking Holdings Inc.
- 6.3.3 Airbnb, Inc.
- 6.3.4 TripAdvisor LLC
- 6.3.5 Hopper Inc.
- 6.3.6 Marriott International, Inc.
- 6.3.7 Hilton Worldwide Holdings Inc.
- 6.3.8 Hyatt Hotels Corp.
- 6.3.9 Choice Hotels International, Inc.
- 6.3.10 Delta Air Lines, Inc.
- 6.3.11 American Airlines Group Inc.
- 6.3.12 United Airlines Holdings, Inc.
- 6.3.13 Southwest Airlines Co.
- 6.3.14 Carnival Corporation & plc
- 6.3.15 Royal Caribbean Group
- 6.3.16 Amtrak
- 6.3.17 VRBO (Expedia)
- 6.3.18 Trivago N.V.
- 6.3.19 Kayak Software Corp.
- 6.3.20 Google Travel (Alphabet Inc.)
- 6.4 Market Opportunities & Future Outlook
- 6.4.1 White-Space & Unmet-Need Assessment

