
PUBLISHER: Mordor Intelligence | PRODUCT CODE: 1842540

PUBLISHER: Mordor Intelligence | PRODUCT CODE: 1842540
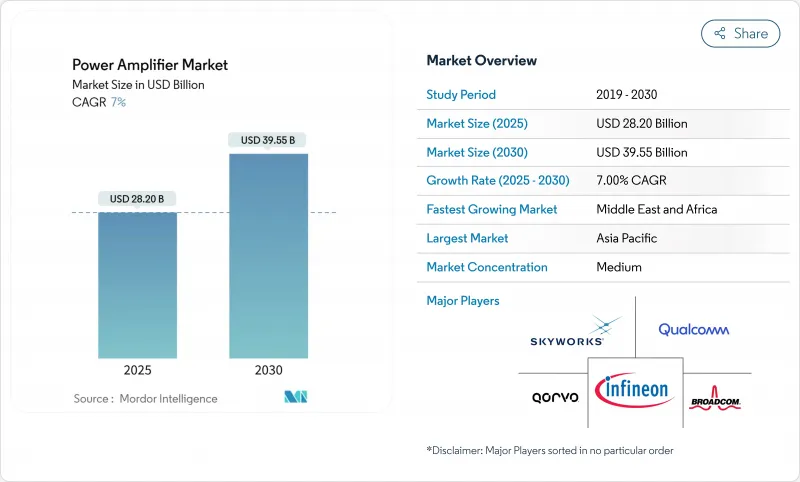
Power Amplifier - Market Share Analysis, Industry Trends & Statistics, Growth Forecasts (2025 - 2030)
The power amplifier market size was valued at USD 28.20 billion in 2025 and is forecast to reach USD 39.55 billion by 2030, reflecting a compound annual growth rate (CAGR) of 7.0%.
Rapid 5G roll-outs, expanding Wi-Fi 6/7 refresh cycles, and growing automotive demand for high-efficiency Class-D audio platforms have underpinned revenue expansion over the past year. GaN devices continued to displace legacy GaAs in macro-cell radios, offering higher power density and reduced energy consumption for operators. Meanwhile, Asia-Pacific kept its cost-leadership advantage in handset power-amplifier back-end assembly, enabling regional vendors to accelerate time-to-market for multi-band RF front ends. Mid-band spectrum (1-6 GHz) remained the performance-price sweet spot for both infrastructure and consumer electronics, yet mmWave amplifiers above 20 GHz recorded the fastest unit growth as satellite broadband and fixed-wireless access scaled in 2024 and early 2025.
Global Power Amplifier Market Trends and Insights
GaN PAs in 5G Massive-MIMO
reduce energy use per bit handled. Typical macro-cell radio units operating from 1.35 GHz to 7.6 GHz reported up to 38% drain efficiency in field deployments during 2024, cutting operating expenditure for carriers. The smaller footprint of GaN die enabled denser antenna panels and simplified thermal layouts, allowing 64-T/64-R arrays to ship in volume for urban densification projects. Regional operators in Japan and South Korea capitalized on the efficiency gains to comply with carbon-reduction roadmaps, reinforcing procurement of GaN front-end modules across 2025 bid cycles. As costs per watt continue to fall, GaN penetration in the power amplifier market should approach parity with GaAs in macro-cells before 2028.
Wi-Fi 6/7 Router Refresh
Home and enterprise access-point vendors accelerated second-generation Wi-Fi 6 and early Wi-Fi 7 launches in 2024, requiring mid-power linear PAs capable of sustaining multi-link operation across 5 GHz and 6 GHz. Solutions such as AsiaRF's AP7988-002 platform integrated a high-power front-end module that extended throughput to 19 Gbps, thereby lifting unit ASPs for RF front ends. In Q1 2025, HPE Aruba Networking released tri-band Wi-Fi 7 access points that improved aggregate capacity by 30%, intensifying demand for premium silicon with tighter EVM and adjacent-channel leakage specifications. This refresh cycle is set to keep the power amplifier market on a robust shipment trajectory through at least 2027.
GaAs Wafer Supply Constraints Elevating BOM Costs
Gallium availability tightened in late 2024 after export-control measures constrained Chinese refinery output, inflating GaAs epi-wafer pricing by up to 18%. Multilayer RF front-end modules, therefore, faced higher bill-of-materials outlays, pressuring handset OEM margins and encouraging an accelerated pivot toward GaN-on-silicon processes. Finwave Semiconductor signed a foundry pact with GlobalFoundries to commercialize enhancement-mode GaN-on-Si for sub-6 GHz phones, aiming to neutralize GaAs cost volatility. While long-term diversification will damp inflationary risk, short-run sourcing difficulties are trimming the headline CAGR of the power amplifier market by nearly one percentage point.
Other drivers and restraints analyzed in the detailed report include:
- EV Infotainment and ADAS Adoption of Class-D Audio PAs
- LEO Satellite Constellations Driving Ku/Ka-band SSPAs
- EU Eco-Design Idle-Power Caps on Audio PAs
For complete list of drivers and restraints, kindly check the Table Of Contents.
Segment Analysis
GaAs devices retained a 41.0% revenue position in 2024 on the strength of entrenched 1-6 GHz handset sockets, yet GaN shipments surged on macro-cell roll-outs and Ku-band gateways. GaN's 17.5% CAGR through 2030 is projected to lift its portion of the power amplifier market size for radio-access infrastructure to almost half by the end of the forecast window. Qorvo documented a 15 °C reduction in junction temperature at identical output power after migrating a 3.5 GHz Doherty stage to GaN-on-SiC, validating cost-of-ownership savings for operators.
Silicon-germanium remained integral to phased-array beamforming cores, whereas bulk CMOS stayed relevant in low-power Bluetooth and Wi-Fi IoT nodes. Research at IMEC on GaN MISHEMT bias stability removed gate-lag barriers that previously capped drain efficiency above 30 GHz, clearing a pathway for GaN proliferation in handset mmWave modules. Emerging GaN-on-diamond substrates promise further thermal headroom, a key enabler for subsequent 6G and X-band radar design-ins.
RF and microwave categories generated 57.3% of 2024 revenue, anchored by 5G macros, small cells, and satcom earth stations. Filtronic shipped Ku-band GaN MMICs rated at 80 W that outperformed preceding GaAs line-ups by 40% PAE, unlocking more compact array apertures. Audio power amplifiers contributed a smaller but fast-growing slice: proliferation of smart-speakers and multi-driver in-vehicle entertainment lifted shipments, and GaN FETs removed dead-time limitations that constrained silicon MOSFET fidelity in high-power class-D boards.
Industrial and scientific RF generators for plasma and heating also elevated SiC and GaN transistor demand. Texas Instruments expanded its wideband LDMOS pre-driver catalog to service industrial laser and MRI magnet power stages, reinforcing the RF product category's role as the revenue mainstay of the power amplifier market.
Power Amplifier Market is Segmented by Technology (Silicon, Gallium Arsenide, and More), by Product (Audio Power Amplifiers and RF/Microwave Power Amplifiers), by Frequency Band (< 1 GHz, 1 - 6 GHz, and More), by Class (Class A, Class B, Class AB, and More), by Industry Vertical (Consumer Electronics, Industrial, and More), and by Geography (North America, South America, Europe, Asia-Pacific, and Middle East and Africa).
Geography Analysis
Asia-Pacific generated 48.7% of global revenue in 2024, anchored by China's handset assembly corridors, which consumed more than half of the region's low-band GaAs die. Korean fabs leveraged vertical integration to ramp 5G RF front ends, while Japanese material suppliers expanded SiC wafer output to mitigate GaN substrate gaps. India's production-linked incentives for smartphone EMS houses widened domestic demand, creating a nascent yet vibrant cluster of RF test and packaging firms. Over the near term, Asia's policy emphasis on indigenous compound-semiconductor supply chains is positioned to strengthen regional control over the power amplifier market.
North America ranked second by value. Dominant players such as Qorvo, Broadcom, and Wolfspeed exploited patent portfolios in GaN power density and thermal packaging to capture new defense and 5G O-RAN awards. The Pentagon's radar-modernization programs adopted X-band GaN tiles, pushing device ASPs significantly above commercial grades. Telecom operators remained central buyers, upgrading mid-band carriers to 64T/64R arrays in dense urban clusters.
Europe's share centered on Germany and France, where automotive and aerospace manufacturers absorbed high-linearity PAs for in-cabin audio, ADAS, and multi-band sat-comms. The EU Eco-Design idle-power regulation prompted a swift transition toward Class-D, creating a temporary mismatch between legacy inventory and new-build specs. United Kingdom fabs explored GaN-on-diamond epitaxy through public-private consortia to retain competitiveness against Asian peers.
The Middle East and Africa region, though smaller, exhibited the fastest growth at an 11.4% CAGR, fueled by Ka-band teleport expansion and sovereign LEO connectivity programs. National operators in Saudi Arabia and Nigeria earmarked capex for gateways that integrate 40 W Ku-band SSPAs, broadening the addressable slice of the power amplifier market. South America followed with moderate uptake, led by Brazil's 5G mid-band auctions and state-backed rural broadband.
- Broadcom Inc.
- Qorvo Inc.
- Skyworks Solutions Inc.
- Qualcomm Technologies Inc.
- Infineon Technologies AG
- Texas Instruments Inc.
- Analog Devices Inc.
- NXP Semiconductors N.V.
- STMicroelectronics N.V.
- Renesas Electronics Corp.
- Wolfspeed Inc.
- MACOM Technology Solutions Inc.
- ON Semiconductor Corp.
- Microchip Technology Inc.
- Rohm Semiconductor
- Panasonic Corp.
- Murata Manufacturing Co. Ltd.
- Mini-Circuits
- CAES (Cobham Advanced Electronics)
- Sumitomo Electric Device Innovations
- Empower RF Systems
- Falcomm Inc.
- Finwave Semiconductor Inc.
Additional Benefits:
- The market estimate (ME) sheet in Excel format
- 3 months of analyst support
TABLE OF CONTENTS
1 INTRODUCTION
- 1.1 Study Assumptions and Market Definition
- 1.2 Scope of the Study
2 RESEARCH METHODOLOGY
3 EXECUTIVE SUMMARY
4 MARKET LANDSCAPE
- 4.1 Market Overview
- 4.2 Market Drivers
- 4.2.1 Integration of GaN PAs in 5G Massive-MIMO
- 4.2.2 Wi-Fi 6/7 Router Refresh Boosting Mid-Power PAs
- 4.2.3 EV Infotainment and ADAS Adoption of Class-D Audio PAs
- 4.2.4 LEO Satellite Constellations Driving Ku/Ka-band SSPAs
- 4.2.5 Smart-Factory RF-Heating Demand via Industry 4.0
- 4.2.6 O-RAN Disaggregation Creating Multi-Vendor PA Opportunities
- 4.3 Market Restraints
- 4.3.1 GaAs Wafer Supply Constraints Elevating BOM Costs
- 4.3.2 EU Eco-Design Idle-Power Caps on Audio PAs
- 4.3.3 Low-End CMOS PA Price Erosion from Chinese Fabless Entrants
- 4.3.4 Thermal-Management Limits on >28 GHz Silicon PAs in Handsets
- 4.4 Value Chain Analysis
- 4.5 Regulatory Outlook
- 4.6 Technological Outlook
- 4.7 Porter's Five Forces
- 4.7.1 Threat of New Entrants
- 4.7.2 Bargaining Power of Buyers
- 4.7.3 Bargaining Power of Suppliers
- 4.7.4 Threat of Substitutes
- 4.7.5 Intensity of Competitive Rivalry
- 4.8 Investment Analysis
- 4.9 Key Performance Indicators
- 4.10 Impact of Macroeconomic factors
5 MARKET SIZE AND GROWTH FORECASTS (VALUE)
- 5.1 By Technology
- 5.1.1 Silicon (Si)
- 5.1.2 Gallium Arsenide (GaAs)
- 5.1.3 Gallium Nitride (GaN)
- 5.1.4 Silicon Germanium (SiGe)
- 5.1.5 Complementary MOS (CMOS)
- 5.1.6 Other Technologies
- 5.2 By Product
- 5.2.1 Audio Power Amplifiers
- 5.2.2 RF / Microwave Power Amplifiers
- 5.3 By Frequency Band
- 5.3.1 < 1 GHz
- 5.3.2 1 - 6 GHz
- 5.3.3 6 - 20 GHz
- 5.3.4 > 20 GHz
- 5.4 By Class
- 5.4.1 Class A
- 5.4.2 Class B
- 5.4.3 Class AB
- 5.4.4 Class D
- 5.4.5 Class E/F and Others
- 5.5 By Industry Vertical
- 5.5.1 Consumer Electronics
- 5.5.2 Industrial
- 5.5.3 Telecommunications
- 5.5.4 Automotive
- 5.5.5 Other Industry Verticals
- 5.6 By Geography
- 5.6.1 North America
- 5.6.1.1 United States
- 5.6.1.2 Canada
- 5.6.2 South America
- 5.6.2.1 Brazil
- 5.6.2.2 Argentina
- 5.6.2.3 Rest of South America
- 5.6.3 Europe
- 5.6.3.1 Germany
- 5.6.3.2 United Kingdom
- 5.6.3.3 France
- 5.6.3.4 Italy
- 5.6.3.5 Sweden
- 5.6.3.6 Denmark
- 5.6.3.7 Rest of Europe
- 5.6.4 Asia-Pacific
- 5.6.4.1 China
- 5.6.4.2 Japan
- 5.6.4.3 South Korea
- 5.6.4.4 India
- 5.6.4.5 Rest of Asia-Pacific
- 5.6.5 Middle East and Africa
- 5.6.5.1 Middle East
- 5.6.5.1.1 Saudi Arabia
- 5.6.5.1.2 UAE
- 5.6.5.1.3 Turkey
- 5.6.5.1.4 Rest of Middle East
- 5.6.5.2 Africa
- 5.6.5.2.1 South Africa
- 5.6.5.2.2 Rest of Africa
- 5.6.1 North America
6 COMPETITIVE LANDSCAPE
- 6.1 Market Concentration
- 6.2 Strategic Moves
- 6.3 Market Share Analysis
- 6.4 Company Profiles (includes Global and Market Level Overview, Core Segments, Financials, Strategic Information, Market Rank/Share, Products and Services, Recent Developments)
- 6.4.1 Broadcom Inc.
- 6.4.2 Qorvo Inc.
- 6.4.3 Skyworks Solutions Inc.
- 6.4.4 Qualcomm Technologies Inc.
- 6.4.5 Infineon Technologies AG
- 6.4.6 Texas Instruments Inc.
- 6.4.7 Analog Devices Inc.
- 6.4.8 NXP Semiconductors N.V.
- 6.4.9 STMicroelectronics N.V.
- 6.4.10 Renesas Electronics Corp.
- 6.4.11 Wolfspeed Inc.
- 6.4.12 MACOM Technology Solutions Inc.
- 6.4.13 ON Semiconductor Corp.
- 6.4.14 Microchip Technology Inc.
- 6.4.15 Rohm Semiconductor
- 6.4.16 Panasonic Corp.
- 6.4.17 Murata Manufacturing Co. Ltd.
- 6.4.18 Mini-Circuits
- 6.4.19 CAES (Cobham Advanced Electronics)
- 6.4.20 Sumitomo Electric Device Innovations
- 6.4.21 Empower RF Systems
- 6.4.22 Falcomm Inc.
- 6.4.23 Finwave Semiconductor Inc.
7 MARKET OPPORTUNITIES AND FUTURE OUTLOOK
- 7.1 White-Space and Unmet-Need Assessment

