
PUBLISHER: Mordor Intelligence | PRODUCT CODE: 1842547

PUBLISHER: Mordor Intelligence | PRODUCT CODE: 1842547
Sarcoma Drugs - Market Share Analysis, Industry Trends & Statistics, Growth Forecasts (2025 - 2030)
The sarcoma therapeutics market is valued at USD 1.61 billion in 2025 and is forecast to reach USD 2.42 billion by 2030, advancing at an 8.61% CAGR.
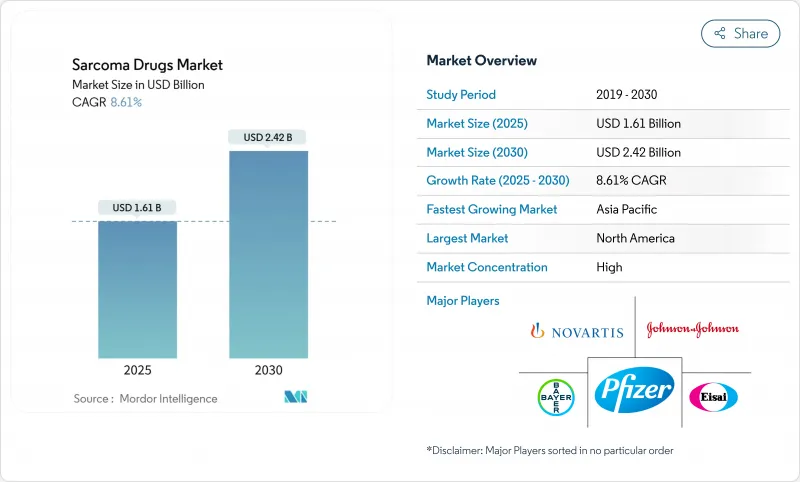
The current sarcoma therapeutics market growth stems from faster regulatory reviews, orphan-drug incentives and rising pharmaceutical investment in precision oncology. Breakthrough approvals-such as Tecelra for synovial sarcoma and Romvimza for tenosynovial giant cell tumor-validate the commercial potential of rare-tumor assets, while radioligand programs backed by large-scale isotope manufacturing move the modality toward mainstream use. Consolidation deals by Merck KGaA and ONO Pharmaceutical illustrate how multinationals are building scale in the sarcoma therapeutics market through targeted acquisitions. Regional dynamics add further momentum: North America benefits from robust reimbursement for orphan drugs, whereas Asia-Pacific gains from China's aggressive price negotiations paired with expanding diagnostic infrastructure.
Global Sarcoma Drugs Market Trends and Insights
Rising Incidence of Sarcoma Cases
Improved molecular profiling is uncovering new sarcoma subtypes and actionable mutations. FDA-cleared assays such as FoundationOne CDx and SeCore CDx HLA A now guide biomarker-driven prescribing, increasing the eligible pool for targeted regimens. Broader testing expands the sarcoma therapeutics market by bringing previously undiagnosed patients into treatment pathways. Oncology centers are standardizing next-generation sequencing, and payers increasingly reimburse comprehensive panels, reinforcing demand for companion diagnostics and matched therapies. Repotrectinib's 33% response in TKI-naive soft tissue sarcoma underscores the promise of mutation-directed care.
Accelerated Approvals & Orphan-Drug Incentives
The FDA's breakthrough designation for lete-cel in January 2025 trimmed review timelines and locked in seven-year exclusivity, mirroring Europe's orphan incentives. Smaller biotechs such as Thermosome leverage these pathways to compete with large companies, while tax credits offset clinical costs and attract venture funding. Fast-track decisions compress development by up to 18 months, a critical advantage in the sarcoma therapeutics market where each additional year of patent life can markedly raise lifetime revenue. Policy stability across the FDA and EMA sustains investor confidence in rare-tumor pipelines.
High Treatment Cost & Reimbursement Gaps
Single-patient CAR-T bills exceed USD 400,000 and pressure payer budgets. CMS has proposed a 17% reimbursement uplift for 2026 to ease hospital losses. Europe faces uneven orphan-drug funding; Germany and the UK approve most listings, whereas Bulgaria waits years for reimbursement. China negotiated 63% average oncology price cuts in 2024, signaling tighter value assessments. Variable coverage slows adoption and caps sarcoma therapeutics market penetration.
Other drivers and restraints analyzed in the detailed report include:
- Uptake of Precision & Immuno-Oncology Agents
- Radioligand Therapies for Micro-Metastatic Disease
- Limited Patient Pool for Late-Phase Trials
For complete list of drivers and restraints, kindly check the Table Of Contents.
Segment Analysis
Targeted therapy held a 46.45% sarcoma therapeutics market share in 2024, driven by kinase inhibitors and antibody-drug conjugates keyed to distinct sarcoma mutations. Vimseltinib's launch introduced a non-surgical option for TGCT, and precision diagnostics underpin payer acceptance. Immunotherapy surged at a 9.12% CAGR through 2030, with Tecelra validating engineered T-cell approaches and checkpoint-plus-chemotherapy regimens reducing relapse risk in soft tissue sarcoma.
Pipeline innovation reinforces both classes. Bispecific antibodies such as LM-299 target PD-1 and VEGF simultaneously, while ERK and MDM2 inhibitors secured by Mosaic aim to counter resistance. Hybrid modalities that combine cytotoxic payloads with immune activation blur class boundaries yet collectively expand the sarcoma therapeutics market.
Soft tissue sarcoma captured 51.23% of sarcoma therapeutics market size in 2024, supported by a broad drug armamentarium against NTRK, CDK4/6 and MDM2 alterations. The SU2C-SARC032 data showed a 43% relapse-risk drop when immunotherapy joined surgery and radiation, elevating immune-based combinations within treatment guidelines. Companion diagnostics focus spending on biomarker-positive patients, reinforcing payer confidence and fortifying soft tissue sarcoma's anchor role in the sarcoma therapeutics market.
Osteosarcoma is forecast to expand at a 9.48% CAGR, driven by renewed R&D targeting pediatric and young-adult need gaps. Adoptive-cell therapies and next-generation kinase inhibitors pursue chemoresistant clones, while global registries streamline trial enrollment. Smaller indications-GIST, Ewing sarcoma and liposarcoma-add incremental volume through tumor-agnostic approvals, but osteosarcoma provides the clearest upside for incremental sarcoma therapeutics market revenue despite its lower incidence.
The Sarcoma Drugs Market Report is Segmented by Type of Treatment (Chemotherapy, Targeted Therapy, Immuno Therapy, and More), by Indication (Soft Tissue Sarcoma, Osteosarcoma and More), by Therapy (First Line and Second Line), by Route of Administration (Oral and Injectables) and Geography (North America, Europe, Asia-Pacific, Middle East and Africa, and South America). The Market Forecasts are Provided in Terms of Value (USD).
Geography Analysis
North America held 40.23% sarcoma therapeutics market share in 2024, buoyed by swift FDA pathways, strong orphan-drug reimbursement and a concentration of specialty cancer centers. The United States drives volume through broad commercial coverage and rising CAR-T reimbursement ceilings, while Canada scales precision-oncology programs inside its single-payer model. Incremental uptake of radioligand therapy is anticipated as Novartis and partners commission new isotope plants, ensuring supply continuity. Growing advocacy networks also accelerate enrollment in post-approval studies that feed value-based contracts, further anchoring North America's role in the sarcoma therapeutics market.
Europe contributes a sizable portion of global demand yet exhibits heterogeneous access timelines. Germany and France reimburse most new orphan treatments within 12 months, but Central and Eastern Europe still wrestle with multi-year delays, muting pan-regional penetration. EMA-approved products benefit from 10-year exclusivity, fostering launch sequencing strategies that prioritize the largest five EU economies. Facility investments such as Orano Med's thorium-228 site in France will reduce isotope import dependence and may reposition Europe as a supply hub for radiopharmaceutical components, reinforcing the region's strategic weight in the sarcoma therapeutics market.
Asia-Pacific is projected to post a 10.67% CAGR, outpacing all other regions. China's 2024 formulary added 26 oncology drugs after average price cuts of 63%, offering larger patient pools at lower price points yet sharpening value expectations. Japan maintains mature orphan-drug incentives, and Australia leverages rapid-review pathways that attract early clinical trials. India expands molecular-testing coverage, though high out-of-pocket spending tempers uptake. Cross-border licensing deals between multinational innovators and local manufacturers facilitate distribution and technology transfer, underpinning sustained expansion of the sarcoma therapeutics market across Asia-Pacific.
- Novartis
- Pfizer
- Roche
- Eli Lilly and Company
- Bayer
- Daiichi Sankyo Company Ltd
- Eisai
- Johnson & Johnson
- Takeda Pharmaceuticals
- Abbvie
- Bristol-Myers Squibb
- Amgen
- Blueprint Medicines Corp.
- Deciphera Pharmaceuticals Inc.
- Ipsen
- Karyopharm Therapeutics
- Adaptimmune Therapeutics plc
- Incyte Corp.
- AstraZeneca
- Regeneron Pharmaceuticals
Additional Benefits:
- The market estimate (ME) sheet in Excel format
- 3 months of analyst support
TABLE OF CONTENTS
1 Introduction
- 1.1 Study Assumptions & Market Definition
- 1.2 Scope of the Study
2 Research Methodology
3 Executive Summary
4 Market Landscape
- 4.1 Market Overview
- 4.2 Market Drivers
- 4.2.1 Rising incidence of sarcoma cases
- 4.2.2 Accelerated approvals & orphan-drug incentives
- 4.2.3 Uptake of precision & immuno-oncology agents
- 4.2.4 Radioligand therapies for micro-metastatic disease
- 4.2.5 Crowdfunded early-access programs in major economies
- 4.3 Market Restraints
- 4.3.1 High treatment cost & reimbursement gaps
- 4.3.2 Limited patient pool for late-phase trials
- 4.3.3 Radio-isotope supply bottlenecks
- 4.4 Value / Supply-Chain Analysis
- 4.5 Regulatory Landscape
- 4.6 Technological Outlook
- 4.7 Porter's Five Forces
- 4.7.1 Threat of New Entrants
- 4.7.2 Bargaining Power of Suppliers
- 4.7.3 Bargaining Power of Buyers
- 4.7.4 Threat of Substitutes
- 4.7.5 Competitive Rivalry
5 Market Size & Growth Forecasts (Value)
- 5.1 By Drug Class
- 5.1.1 Cytotoxic Chemotherapy
- 5.1.2 Targeted Therapy
- 5.1.3 Immunotherapy (Checkpoint, Cytokine, Cell-based)
- 5.1.4 Radioligand & Other Novel Agents
- 5.2 By Indication
- 5.2.1 Soft Tissue Sarcoma
- 5.2.2 Osteosarcoma
- 5.2.3 Ewing Sarcoma
- 5.2.4 Gastro-intestinal Stromal Tumor (GIST)
- 5.2.5 Liposarcoma & Others
- 5.3 By Therapy Line
- 5.3.1 First-line
- 5.3.2 Second-line & Refractory
- 5.4 By Route of Administration
- 5.4.1 Injectable
- 5.4.2 Oral
- 5.5 By Region
- 5.5.1 North America
- 5.5.1.1 United States
- 5.5.1.2 Canada
- 5.5.1.3 Mexico
- 5.5.2 Europe
- 5.5.2.1 Germany
- 5.5.2.2 United Kingdom
- 5.5.2.3 France
- 5.5.2.4 Italy
- 5.5.2.5 Spain
- 5.5.2.6 Rest of Europe
- 5.5.3 Asia-Pacific
- 5.5.3.1 China
- 5.5.3.2 India
- 5.5.3.3 Japan
- 5.5.3.4 South Korea
- 5.5.3.5 Australia
- 5.5.3.6 Rest of Asia-Pacific
- 5.5.4 South America
- 5.5.4.1 Brazil
- 5.5.4.2 Argentina
- 5.5.4.3 Rest of South America
- 5.5.5 Middle East and Africa
- 5.5.5.1 GCC
- 5.5.5.2 South Africa
- 5.5.5.3 Rest of Middle East and Africa
- 5.5.1 North America
6 Competitive Landscape
- 6.1 Market Concentration
- 6.2 Market Share Analysis
- 6.3 Company Profiles (includes Global level Overview, Market level overview, Core Segments, Financials as available, Strategic Information, Market Rank/Share for key companies, Products & Services, and Recent Developments)
- 6.3.1 Novartis AG
- 6.3.2 Pfizer Inc.
- 6.3.3 F. Hoffmann-La Roche Ltd
- 6.3.4 Eli Lilly and Company
- 6.3.5 Bayer AG
- 6.3.6 Daiichi Sankyo Company Ltd
- 6.3.7 Eisai Co. Ltd
- 6.3.8 Johnson & Johnson (Janssen)
- 6.3.9 Takeda Pharmaceutical Company Ltd
- 6.3.10 AbbVie Inc.
- 6.3.11 Bristol Myers Squibb Co.
- 6.3.12 Amgen Inc.
- 6.3.13 Blueprint Medicines Corp.
- 6.3.14 Deciphera Pharmaceuticals Inc.
- 6.3.15 Ipsen SA
- 6.3.16 Karyopharm Therapeutics Inc.
- 6.3.17 Adaptimmune Therapeutics plc
- 6.3.18 Incyte Corp.
- 6.3.19 AstraZeneca plc
- 6.3.20 Regeneron Pharmaceuticals Inc.
7 Market Opportunities & Future Outlook
- 7.1 White-space & Unmet-need Assessment

