
PUBLISHER: Mordor Intelligence | PRODUCT CODE: 1842569

PUBLISHER: Mordor Intelligence | PRODUCT CODE: 1842569
Automotive Display - Market Share Analysis, Industry Trends & Statistics, Growth Forecasts (2025 - 2030)
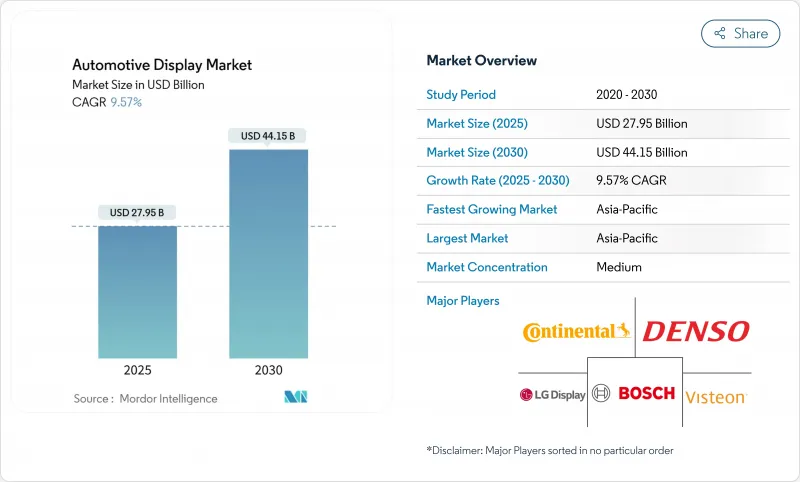
The automotive display market size is valued at USD 27.95 billion in 2025 and is forecast to reach USD 44.15 billion in 2030, advancing at a 9.57% CAGR during the period.
Expanding software-defined vehicle architectures, stronger demand for immersive infotainment, and rising levels of driving automation push displays from simple information read-outs to core human-machine-interface (HMI) assets. Automakers are integrating more screen real estate to support over-the-air (OTA) feature rollouts, remote diagnostics, and subscription-based content. High-brightness liquid-crystal-display (LCD) modules continue to dominate volume production thanks to mature supply chains, while organic-light-emitting-diode (OLED) and Mini LED alternatives concentrate on premium trims to justify higher unit pricing.
Global Automotive Display Market Trends and Insights
Rise of connected & electric vehicles needing richer HMI
EV powertrain complexity and cloud-linked vehicle-road-infrastructure connectivity demand graphical interfaces that surface battery health, route-based range estimates, and V2G (vehicle-to-grid) transactions. Hyundai reports strong buyer interest in charge-planning tools embedded within its central display, highlighting the link between intuitive graphics and reduced range anxiety.
Soaring demand for integrated digital cockpits
Unified cockpit platforms consolidate instrument clusters, infotainment, and climate controls onto shared operating systems. HARMAN's Linux- and Android-based cockpit suite streams content across domains, lowering electronics complexity and creating room for AI-driven personalization . Suppliers apply digital-twin modelling to cut physical prototyping time; Faurecia's model-based design shrinks development cycles, aligning with automakers' software time-to-market targets. OTA support within the cockpit enables post-sale feature unlocks, cementing recurring-revenue models.
Glass & semiconductor supply volatility
High-purity quartz and legacy-node semiconductors experienced intermittent shortages in 2024-2025, exposing the fragility of concentrated sourcing. Hurricane damage to key quartz facilities constrained glass substrate output, while geopolitical tensions around gallium and germanium sharpened risk profiles for display driver integrated circuits. Tier-1s now dual-source and regionalize inventory buffers to harden supply resilience.
Other drivers and restraints analyzed in the detailed report include:
- Software-defined vehicle OTA UX refresh cycles
- NCAP distraction-score rules accelerating HUD fitment
- Premium pricing of automotive-grade OLEDs
For complete list of drivers and restraints, kindly check the Table Of Contents.
Segment Analysis
Center-stack consoles held 39.61% of revenue in 2024, underlining their role as the vehicle's command center. The segment benefits from scalable screen sizes, touch-first interaction, and app-store compatibility that align with the automotive display market's shift to software monetization. HUD fitment is rising fastest at a 10.14% CAGR, buoyed by safety legislation and consumer demand for glance-free navigation cues. Combined, both product lines exemplify how the automotive display market supports tiered UX strategies-comprehensive control panels for deep interaction, and windshield projections for critical driver alerts.
Increasing domain-controller adoption allows content rebalancing between clusters, HUDs, and passenger screens. Visteon secured USD 2.6 billion in cockpit contracts during 2024, many bundling multiple display types into one hardware-software stack that simplifies validation and shortens launch timelines.
LCD modules captured 64.05% of shipments in 2024 thanks to long-established fabs, falling driver-IC pricing, and a growing slate of Mini LED enhancements that elevate contrast without premium pricing. Mass-market dashboards, digital clusters, and fleet displays continue to rely on LCD's predictable cost roadmap, ensuring the technology remains the backbone of automotive HMI for the forecast window.
OLED is the fastest-growing technology, projected to advance at a 10.42% CAGR by focusing on high-contrast curved clusters, flexible center stacks, and pillar-to-pillar treatments that command premium trim pricing. Samsung Display's Dolby Vision-certified panels now reach peaks above 1,500 nits, narrowing daytime-visibility gaps versus LCD and justifying OEM upgrades. MicroLED prototypes are also emerging, yet their commercial timeline extends past 2030, leaving LCD and OLED to define mainstream technology choice in the interim.
The Automotive Display Market Report is Segmented by Product Type (Center Stack Display, Instrument Cluster Display, and More), Display Technology (LCD, OLED, and More), Vehicle Type (Passenger Cars and Commercial Vehicles), Display Size (Less Than 5-Inch, 6 To 10 Inch, and More), and Geography (North America, South America, and More). The Market Forecasts are Provided in Terms of Value (USD).
Geography Analysis
Asia-Pacific remained the largest automotive display market, accounting for 45.85% of 2024 revenue and projected to grow at an 11.77% CAGR through 2030. China anchors the region's dominance; domestic brands install 12-inch or larger center screens as standard and benefit from integrated semiconductor, panel, and vehicle-assembly ecosystems that compress development cycles and lower cost. Local governments invest in vehicle-road-cloud infrastructure, enabling data-intensive cockpit functions without latency penalties.
North America follows as a technology-rich arena where high content per vehicle drives sizable revenue despite smaller unit totals. U.S. light-vehicle production reached 16.46 million units in 2024, and HUD penetration rose alongside Level-2+ driver-assistance packages. Silicon Valley software hubs shorten OTA update cycles and reinforce consumer expectations for mobile-app-like cockpit experiences.
Europe completes the top three with a regulatory push that prioritizes safety and sustainability. Euro NCAP's forthcoming distraction metrics and Euro 7 emissions limits accelerate electric-vehicle adoption and, by extension, demand for advanced displays that visualize energy usage and driver-monitor data. German premium marques lead in curved OLED clusters and dashboard-wide glass laminates, giving the region an outsized influence on next-generation cockpit styling.
- LG Display Co., Ltd.
- Samsung Display Co., Ltd.
- Robert Bosch GmbH
- Continental AG
- Denso Corporation
- Visteon Corporation
- Panasonic Holdings Corporation
- Nippon Seiki Co., Ltd.
- AUO Corporation
- Japan Display Inc.
- Sharp Corporation
- BOE Technology Group Co., Ltd.
- Hyundai Mobis Co., Ltd.
- Valeo SA
- Tianma Micro-electronics Co., Ltd.
Additional Benefits:
- The market estimate (ME) sheet in Excel format
- 3 months of analyst support
TABLE OF CONTENTS
1 Introduction
- 1.1 Study Assumptions & Market Definition
- 1.2 Scope of the Study
2 Research Methodology
3 Executive Summary
4 Market Landscape
- 4.1 Market Drivers
- 4.1.1 Soaring demand for integrated digital cockpits
- 4.1.2 Rapid cost-down of high-brightness automotive LCDs
- 4.1.3 OEM push for larger pillar-to-pillar screens
- 4.1.4 Rise of connected & electric vehicles needing richer HMI
- 4.1.5 NCAP distraction-score rules accelerating HUD fitment
- 4.1.6 Software-defined vehicle OTA UX refresh cycles
- 4.2 Market Restraints
- 4.2.1 Premium pricing of automotive-grade OLEDs
- 4.2.2 Glass & semiconductor supply volatility
- 4.2.3 Rising cyber-security compliance costs
- 4.2.4 Reliability issues with large flexible displays
- 4.3 Value/Supply-Chain Analysis
- 4.4 Regulatory Landscape
- 4.5 Technological Outlook
- 4.6 Porter's Five Forces
- 4.6.1 Threat of New Entrants
- 4.6.2 Bargaining Power of Buyers
- 4.6.3 Bargaining Power of Suppliers
- 4.6.4 Threat of Substitutes
- 4.6.5 Intensity of Competitive Rivalry
5 Market Size & Growth Forecasts (Value (USD))
- 5.1 By Product Type
- 5.1.1 Center Stack Display
- 5.1.2 Instrument Cluster Display
- 5.1.3 Head-Up Display
- 5.1.4 Rear-Seat Entertainment Display
- 5.2 By Display Technology
- 5.2.1 LCD
- 5.2.2 OLED
- 5.2.3 MiniLED / MicroLED
- 5.3 By Vehicle Type
- 5.3.1 Passenger Cars
- 5.3.2 Commercial Vehicles
- 5.4 By Display Size
- 5.4.1 Less than equal to 5-inch
- 5.4.2 6 to 10 inch
- 5.4.3 Above 10 inch
- 5.5 By Geography
- 5.5.1 North America
- 5.5.1.1 United States
- 5.5.1.2 Canada
- 5.5.1.3 Rest of North America
- 5.5.2 South America
- 5.5.2.1 Brazil
- 5.5.2.2 Argentina
- 5.5.2.3 Rest of South America
- 5.5.3 Europe
- 5.5.3.1 Germany
- 5.5.3.2 United Kingdom
- 5.5.3.3 France
- 5.5.3.4 Rest of Europe
- 5.5.4 Asia-Pacific
- 5.5.4.1 China
- 5.5.4.2 Japan
- 5.5.4.3 India
- 5.5.4.4 South Korea
- 5.5.4.5 Rest of Asia-Pacific
- 5.5.5 Middle East and Africa
- 5.5.5.1 United Arab Emirates
- 5.5.5.2 Saudi Arabia
- 5.5.5.3 Egypt
- 5.5.5.4 Turkey
- 5.5.5.5 South Africa
- 5.5.5.6 Rest of Middle East and Africa
- 5.5.1 North America
6 Competitive Landscape
- 6.1 Market Concentration
- 6.2 Strategic Moves
- 6.3 Market Share Analysis
- 6.4 Company Profiles (Includes Global Level Overview, Market Level Overview, Core Segments, Financials, Strategic Information, Market Rank/Share, Products & Services, Recent Developments)
- 6.4.1 LG Display Co., Ltd.
- 6.4.2 Samsung Display Co., Ltd.
- 6.4.3 Robert Bosch GmbH
- 6.4.4 Continental AG
- 6.4.5 Denso Corporation
- 6.4.6 Visteon Corporation
- 6.4.7 Panasonic Holdings Corporation
- 6.4.8 Nippon Seiki Co., Ltd.
- 6.4.9 AUO Corporation
- 6.4.10 Japan Display Inc.
- 6.4.11 Sharp Corporation
- 6.4.12 BOE Technology Group Co., Ltd.
- 6.4.13 Hyundai Mobis Co., Ltd.
- 6.4.14 Valeo SA
- 6.4.15 Tianma Micro-electronics Co., Ltd.
7 Market Opportunities & Future Outlook
- 7.1 Growing AR-HUD monetization potential
- 7.2 MicroLED roadmaps promise 30% power savings
- 7.3 Over-the-air subscription models for display-based features
- 7.4 China-centric cockpit-display supply chain localization
- 7.5 Aftermarket retrofit demand for Above 12-inch screens in developing markets

