
PUBLISHER: Mordor Intelligence | PRODUCT CODE: 1842578

PUBLISHER: Mordor Intelligence | PRODUCT CODE: 1842578
Robo Taxi - Market Share Analysis, Industry Trends & Statistics, Growth Forecasts (2025 - 2030)
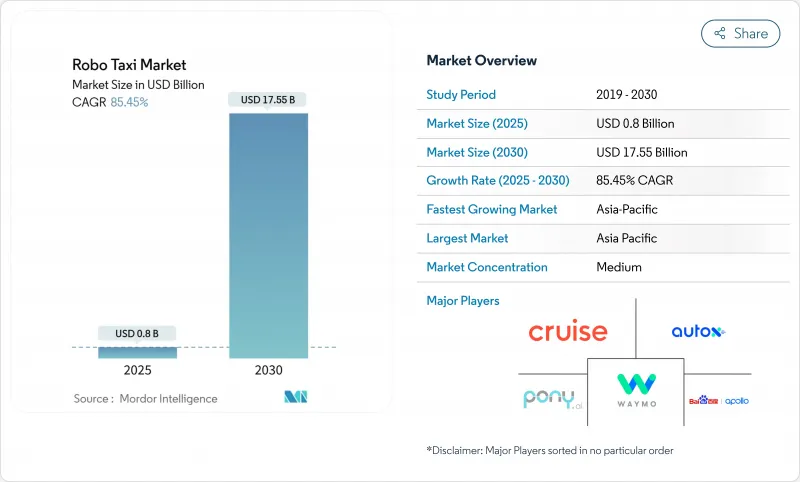
The Robo Taxi Market size is estimated at USD 0.8 billion in 2025, and is expected to reach USD 17.55 billion by 2030, at a CAGR of 85.45% during the forecast period (2025-2030).
Capital inflows from strategic and financial investors continue to reset competitive dynamics, while rapid hardware deflation-most visibly in LiDAR and high-performance compute-erases a chief economic barrier. Clearer regulatory frameworks, such as Dubai's dedicated autonomous-vehicle law and Germany's KIRA project, convert pilot schemes into scalable commercial operations.
Global Robo Taxi Market Trends and Insights
Declining AD-sensor & computing costs
Unit-price compression in LiDAR and on-board compute redefines fleet-level economics. Chinese suppliers forecast LiDAR modules below USD 1,000, against USD 75,000 less than a decade ago, while NVIDIA's DRIVE Hyperion platform reaches automotive-grade volume production. Hardware outlay per Level 4 vehicle fell from USD 250,000 to USD 150,000 in two model cycles. As bills of material move closer to parity with traditional vehicles, payback periods fall under three years for high-utilisation fleets. This cost trajectory improves the addressable opportunity for the robo taxi market across premium and mass-market urban zones.
Government AV pilots & regulatory sandboxes
Jurisdictions now issue commercial licences rather than test permits. Germany's KIRA fleet carries fare-paying passengers on arterial routes, France fast-tracks driverless statutes, and Dubai's Law No. 9 of 2023 explicitly authorises paid autonomous services. Each initiative compresses deployment lead times by clarifying liability, insurance, and data logging mandates. Predictable compliance requirements unlock long-dated capital and trigger multi-city ramp-ups, thereby expanding the immediately serviceable available market for robo taxi operators.
Persistent public-trust & safety-perception gap
J.D. Power's confidence index scores just 39/100 for fully automated vehicles despite Waymo recording 90% fewer insurance claims than human drivers. Consumers in the United States and Germany cite uncertainty over software reliability and liability coverage, with 71% rejecting per-ride insurance premiums. Regional asymmetry also appears: surveys in Shanghai show higher early-adopter intent, suggesting uptake will not be uniform. Closing this gap calls for transparent incident reporting, incremental rollouts, and visible safety disclaimers, all stretching marketing budgets and deployment timelines for the robo taxi market.
Other drivers and restraints analyzed in the detailed report include:
- Urban congestion pricing nudging shared autonomy
- MaaS platform integration unlocking fleet utilisation.
- V2X cybersecurity vulnerabilities
For complete list of drivers and restraints, kindly check the Table Of Contents.
Segment Analysis
Level 4 vehicles produced the bulk of paid rides in 2024, holding 61.73% of the Robo taxi market share. They run inside geofenced metropolitan zones where high-definition maps and remote assistance offset residual edge cases. The segment grows steadily yet cedes relative weight as Level 5 prototypes prove reliability in unstructured environments. At an 87.41% CAGR, Level 5 lifts the long-run ceiling of the Robo taxi industry. Over the forecast horizon, early adopters transition fleets incrementally, often operating Level 4 and Level 5 vehicles side-by-side to amortise sunk investments while preparing for driver-out operations in all weather and terrain.
Operator economics evolve in parallel. Level 5 hardware currently carries a 15% cost premium over Level 4 equivalents, yet eliminating tele-operations and remote supervisors offsets that delta once daily utilisation exceeds eight hours. Waymo's latest design-to-cost cycle already narrows the premium, signalling an inflection at which Level 5 becomes the default procurement choice for fleet expansions.
Battery-electric drivetrains held a 71.32% market share in 2024 and exhibit a 79.52% CAGR. Electric powertrains harmonise with autonomous-vehicle duty cycles: regenerative braking, low service intervals, and central depot charging align with high-mileage, round-the-clock operations. The Robo taxi market, therefore, favours electric fleets when evaluating total cost of ownership against internal combustion or hybrid alternatives. Inductive charging pads at curbside stands in Phoenix and Wuhan further truncate dwell time, helping fleets maintain ride availability targets above 90%.
Fuel-cell and hybrid alternatives retain relevance in long-range or temperature-extreme routes where battery performance degrades. However, new chemistries such as lithium-iron-phosphate reduce cost per kilowatt-hour by 30% relative to nickel cobalt manganese packs, extending electric competitiveness into regional shuttles. Automakers dedicate separate battery lines for autonomous-mobility clients, lowering variance and frontline downtime.
Car-based designs captured 67.34% of 2024 revenue due to legacy ride-hailing user expectations. Yet van and shuttle formats compound fastest at a 75.23% CAGR as operators pivot to multi-passenger or cargo-dense missions. Purpose-built shapes gain regulatory favour because their reduced front crumple zones free interior volume without compromising passive safety when no human driver is on board.
Product-development feedback loops tighten as digital twins simulate millions of kilometres before hardware freeze. Design for manufacturability disciplines drive part-count reductions near 18%, lowering bill-of-materials risk for low-volume skews. Consequently, the Robo taxi market moves from retrofit approaches, where sensor pods protrude from traditional sedans, to integrated exteriors that conceal perception arrays.
The Robo Taxi Market is Segmented by Level of Autonomy (Level 4, and Level 5), Propulsion (Battery-Electric Vehicles, and More), Vehicle Type (Car, and More), by Application (Passenger Transportation, and More), by Service Type (Rental-Based, and More), Business Modal (B2C, and More), Fleet Ownership, Operating Environment and Geography. The Market Forecasts are Provided in Terms of Value (USD) and Volume (Units).
Geography Analysis
Asia-Pacific anchors global upside, with a 45.13% share in 2024. China already licenses robotaxis in 16 cities, and policy goals envision 1,000 fully driverless vehicles in Wuhan by 2028. Government procurement incentives, free-trade-zone test beds, and 5G coverage create a virtuous infrastructure loop. As a result, the Robo taxi market in Asia-Pacific is compounding at an 85.23% CAGR. Multinational fleets leverage this regulatory tailwind to prototype features such as multilingual voice UX and integrated in-vehicle payments, which then migrate to export markets.
North America remains the operational benchmark owing to Waymo's 200,000 weekly rides across Phoenix, San Francisco, and Los Angeles. State-level autonomy statutes differ, but 27 states and Washington D.C. already authorise Level 4 or Level 5 rides, yielding the continent's most diverse route portfolios. In North America as capital inflows continue-Waymo alone secured USD 5.6 billion in 2024 funding rounds. Tesla prepares an Austin pilot to stress-test driverless rides on mixed-speed arterials, signaling that competitive intensity remains robust despite Cruise's recent retrenchment.
Europe is propelled by Germany's KIRA project and France's nationwide driverless roadmap. Dense medieval street grids and GDPR compliance obligations add operational complexity, yet cities such as Hamburg, Paris, and Barcelona pursue zero-emission corridors that explicitly accommodate autonomous shuttles. Strategic alliances like Wayve-Uber in London integrate British AI stacks with ride-hailing volume, providing a template for continent-wide scaling once harmonised EU regulation takes effect.
- Waymo LLC
- GM Cruise LLC
- Baidu Apollo
- AutoX Inc.
- Pony.ai
- Zoox Inc.
- Tesla Inc.
- DiDi Autonomous Driving
- Yandex Self-Driving Group
- EasyMile SAS
- Navya SA
- Nuro Inc.
- ZF Friedrichshafen AG
- AB Volvo - Volvo Autonomous Solutions
- Mobileye (Intel)
Additional Benefits:
- The market estimate (ME) sheet in Excel format
- 3 months of analyst support
TABLE OF CONTENTS
1 Introduction
- 1.1 Study Assumptions & Market Definition
- 1.2 Scope of the Study
2 Research Methodology
3 Executive Summary
4 Market Landscape
- 4.1 Market Overview
- 4.2 Market Drivers
- 4.2.1 Declining AD-sensor & computing costs
- 4.2.2 Government AV pilots & regulatory sandboxes
- 4.2.3 Urban congestion pricing nudging shared autonomy
- 4.2.4 MaaS platform integration unlocking fleet utilisation
- 4.2.5 Purpose-built autonomous van architectures for last-mile logistics
- 4.2.6 Record capital inflows into autonomous-mobility ventures
- 4.3 Market Restraints
- 4.3.1 Persistent public-trust & safety-perception gap
- 4.3.2 High upfront CAPEX & uncertain pay-back
- 4.3.3 Patchy global liability & safety certification regimes
- 4.3.4 V2X cyber-security vulnerabilities
- 4.4 Value/Supply-Chain Analysis
- 4.5 Regulatory Landscape
- 4.6 Technological Outlook
- 4.7 Porter's Five Forces
- 4.7.1 Threat of New Entrants
- 4.7.2 Bargaining Power of Buyers/Consumers
- 4.7.3 Bargaining Power of Suppliers
- 4.7.4 Threat of Substitute Products
- 4.7.5 Intensity of Competitive Rivalry
5 Market Size & Growth Forecasts (Value (USD) and Volume (Units))
- 5.1 By Level of Autonomy
- 5.1.1 Level 4
- 5.1.2 Level 5
- 5.2 By Propulsion
- 5.2.1 Battery-Electric Vehicles
- 5.2.2 Hybrid-Electric Vehicles
- 5.2.3 Fuel-Cell Electric Vehicles
- 5.3 By Vehicle Type
- 5.3.1 Car
- 5.3.2 Van / Shuttle
- 5.4 By Application
- 5.4.1 Passenger Transportation
- 5.4.2 Goods / Parcel Transportation
- 5.5 By Service Type
- 5.5.1 Rental-Based (free-floating)
- 5.5.2 Station-Based (hub-to-hub)
- 5.6 By Business Model
- 5.6.1 B2C (direct to riders)
- 5.6.2 B2B (corporate / logistics contracts)
- 5.6.3 Public-Transit Integration
- 5.7 By Fleet Ownership
- 5.7.1 OEM-Owned
- 5.7.2 Operator-Owned (TNCs & start-ups)
- 5.7.3 Public-Agency-Owned
- 5.8 By Operating Environment
- 5.8.1 Urban Core
- 5.8.2 Sub-Urban / Campus
- 5.8.3 Highway / Inter-city
- 5.8.4 Mixed-Use Zones
- 5.9 By Geography
- 5.9.1 North America
- 5.9.1.1 United States
- 5.9.1.2 Canada
- 5.9.1.3 Rest of North America
- 5.9.2 South America
- 5.9.2.1 Brazil
- 5.9.2.2 Argentina
- 5.9.2.3 Rest of South America
- 5.9.3 Europe
- 5.9.3.1 Germany
- 5.9.3.2 United Kingdom
- 5.9.3.3 France
- 5.9.3.4 Italy
- 5.9.3.5 Spain
- 5.9.3.6 Russia
- 5.9.3.7 Rest of Europe
- 5.9.4 Asia-Pacific
- 5.9.4.1 China
- 5.9.4.2 Japan
- 5.9.4.3 India
- 5.9.4.4 South Korea
- 5.9.4.5 Rest of Asia-Pacific
- 5.9.5 Middle East and Africa
- 5.9.5.1 Turkey
- 5.9.5.2 Saudi Arabia
- 5.9.5.3 United Arab Emirates
- 5.9.5.4 South Africa
- 5.9.5.5 Nigeria
- 5.9.5.6 Rest of Middle East and Africa
- 5.9.1 North America
6 Competitive Landscape
- 6.1 Market Concentration
- 6.2 Strategic Moves
- 6.3 Market Share Analysis
- 6.4 Company Profiles (Includes Global Level Overview, Market Level Overview, Core Segments, Financials as Available, Strategic Information, Market Rank/Share for Key Companies, Products & Services, and Recent Developments)
- 6.4.1 Waymo LLC
- 6.4.2 GM Cruise LLC
- 6.4.3 Baidu Apollo
- 6.4.4 AutoX Inc.
- 6.4.5 Pony.ai
- 6.4.6 Zoox Inc.
- 6.4.7 Tesla Inc.
- 6.4.8 DiDi Autonomous Driving
- 6.4.9 Yandex Self-Driving Group
- 6.4.10 EasyMile SAS
- 6.4.11 Navya SA
- 6.4.12 Nuro Inc.
- 6.4.13 ZF Friedrichshafen AG
- 6.4.14 AB Volvo - Volvo Autonomous Solutions
- 6.4.15 Mobileye (Intel)
7 Market Opportunities & Future Outlook
- 7.1 Autonomous ride-hailing integration into city MaaS platforms
- 7.2 Dedicated robo-van networks for last-mile parcel delivery
- 7.3 Subscription-based robo-taxi services for senior mobility
- 7.4 Cross-border robo-taxi corridors (e.g., EU Schengen pilot)
- 7.5 Carbon-credit monetisation for zero-emission robo-taxi fleets

