
PUBLISHER: Mordor Intelligence | PRODUCT CODE: 1842597

PUBLISHER: Mordor Intelligence | PRODUCT CODE: 1842597
Cone Beam Computed Tomography - Market Share Analysis, Industry Trends & Statistics, Growth Forecasts (2025 - 2030)
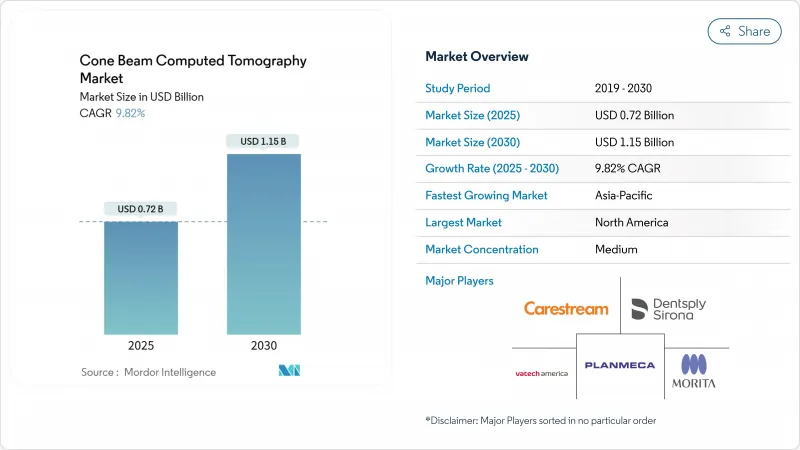
The cone beam computed tomography market stands at USD 0.72 billion in 2025 and is forecast to reach USD 1.15 billion by 2030, advancing at a 9.82% CAGR.
Rising orthodontic case volumes, broader ENT and sleep-disorder applications , and the steady integration of artificial intelligence into image-reconstruction workflows together underpin this forward momentum. Dental service organizations are rolling out multi-site equipment programs that standardize imaging protocols and accelerate system adoption, while lower-cost mini-field-of-view units have opened the technology to smaller practices. Cloud connectivity, remote consultation, and reimbursement expansion for 3-D airway assessment further widen the cone beam computed tomography market addressable base. Ongoing FDA clarifications on radiation-control regulations and recent 510(k) approvals create a supportive regulatory backdrop that speeds product launches and reduces compliance uncertainty.
Global Cone Beam Computed Tomography Market Trends and Insights
AI-enabled image-reconstruction cuts scan time and dose
Artificial-intelligence algorithms now reduce scan times by about 40% while preserving diagnostic quality through noise suppression and artifact correction. Deep-learning metal-artifact reduction has markedly improved image clarity around dental implants, enabling dependable assessments in complex orthodontic cases. The 2024 launch of the DEXIS digital ecosystem merged AI-powered analysis with treatment-planning software, giving providers end-to-end workflow support. Dose reductions resonate strongly in pediatric dentistry, where radiation limits are strict, and smaller practices benefit from the time savings that lift daily scan throughput. These gains collectively broaden the cone beam computed tomography market beyond high-volume clinics and into community settings.
Surging prevalence of orthodontic malocclusions among adults and teens
Adult orthodontic demand continues to rise as clear-aligner systems improve aesthetics and reduce treatment stigma. Malocclusion prevalence has climbed in both North America and Europe, prompting dentists and orthodontists to adopt 3-D imaging for precise root and bone assessments. CBCT provides full volumetric visualization, allowing clinicians to confirm cortical-bone thickness and tooth inclination prior to movement, which shortens chair time and curbs retreatment risk. This clinical edge pushes providers to upgrade from two-dimensional cephalometric tools, reinforcing equipment sales across mature markets.
High upfront capital cost and limited insurance coverage
System prices ranging from USD 80,000 to USD 500,000 remain a hurdle for single-chair practices, particularly in lower-income countries where procedure reimbursement is limited. Currency volatility and import taxes intensify the burden. Refurbished equipment and subscription models are emerging, but widespread coverage gaps still temper the cone beam computed tomography market expansion.
Other drivers and restraints analyzed in the detailed report include:
- Reimbursement expansion for 3-D airway assessment in sleep-disordered breathing
- Proliferation of dental service organizations accelerating CBCT roll-outs
- Flat-panel detector supply-chain constraints
For complete list of drivers and restraints, kindly check the Table Of Contents.
Segment Analysis
Dental imaging continued to hold 85.34% of the cone beam computed tomography market size in 2024, supported by routine orthodontic, endodontic, and implant protocols. Dental sub-segments now benefit from AI-guided root-canal navigation and metal-artifact reduction that deepen diagnostic certainty and support chairside decision-making . Orthodontics remains the largest contributor as adult alignment demand surges, while implantology grows on the back of precise 3-D bone mapping that safeguards critical anatomical structures. Pediatric dentists lean on ultra-low-dose presets to balance diagnostic gain with radiation safety.
Non-dental imaging is poised to disrupt long-standing dominance as ENT, sleep-medicine, and plastic-surgery teams integrate CBCT into their pre-operative workflows. ENT clinicians report clearer visualization of the osteomeatal complex and inner-ear pathways at radiation doses up to 10 times lower than multi-slice CT. Sleep physicians use volumetric airway reconstructions to plan mandibular advancement devices. Plastic surgeons value CBCT for nasal and mid-facial bone analysis, though adoption remains limited to high-volume centers due to equipment costs. Together, these use cases underpin a 10.56% CAGR for non-dental applications, progressively rebalancing the cone beam computed tomography market.
Standing/sitting systems retained 51.23% of the cone beam computed tomography market share in 2024, a legacy of early platform designs that prioritize speed and compact footprints. The familiar workflow reduces room-fit challenges and accommodates high patient throughput in bustling clinics. Motion-correction algorithms continue to improve image quality even with minor head shifts, preserving relevance for routine diagnostics.
Seated systems, meanwhile, are set to rise at a 10.45% CAGR as providers prioritize patient comfort in lengthy or pediatric scans. The seated position lessens movement artifacts and eases access for patients with limited mobility. Manufacturers are launching dual-mode platforms that switch between positions without extensive reconfiguration, spreading capital costs across wider patient segments. Supine designs remain the choice for hospitals where integration with other radiology suites dictates consistency, though space demands limit broader use. Over time, flexible ergonomics are expected to converge, allowing multi-position capability within a single architecture and reinforcing buyer preference for versatile models throughout the cone beam computed tomography market.
The Cone Beam Computed Tomography Market is Segmented by Applications (Dental Applications [Orthodontics, Endodontics, and More] and Non-Dental Applications), Patient Position (Standing/Sitting, Seated, and Supine), End User (Hospitals, Dental Clinics, and More), Mobility (Stand-Alone CBCT Systems and More), and Geography (North America and More). The Market and Forecasts are Provided in Terms of Value (USD).
Geography Analysis
North America secured 39.41% of global revenue in 2024 owing to early technology uptake, robust insurance frameworks, and high dental spending. The FDA's 2024 radiation-control guidance gives manufacturers clearer design pathways, which in turn speeds product approvals such as Epica's See Factor CT3 system. United States DSOs dominate procurement volume, and Canada's provincial plans now reimburse select CBCT indications, steadily lifting penetration in secondary cities. Mexico is witnessing private-clinic expansion, especially in tourism corridors, although equipment imports remain sensitive to peso fluctuations.
Asia-Pacific is forecast to expand at 10.87% CAGR, fueled by rising disposable income, government oral-health campaigns, and rapid clinic chain growth across China, India, and the Association of Southeast Asian Nations. South Korea and Japan maintain high per-capita unit densities, yet incremental gains persist through hardware replacements with AI-ready models. China's rare-earth export curbs underscore supply-chain dependency but simultaneously stimulate domestic detector innovation, which could localize component sourcing and reduce foreign exchange risk. India's private-insurance adoption is climbing, broadening patient affordability and raising clinician willingness to invest.
Europe delivers steady progress underpinned by universal coverage that reimburses radiation-dose optimized dental imaging. The region's regulators enforce stringent exposure limits, aligning well with CBCT's low-dose profile. Manufacturers such as Planmeca continue to refine ultra-low dose protocols that meet European safety thresholds while maintaining diagnostic clarity. Central and Eastern European markets expand as EU structural funds modernize dental clinics, yet growth still trails Western Europe due to lower per-capita expenditure. The Middle East and Africa offer high long-term potential, particularly in Gulf Cooperation Council states where private dental groups import premium devices amid growing medical-tourism flows, although broader adoption is constrained by capital cost barriers and limited trained personnel.
- Carestream Health
- Danaher
- Planmeca
- Dentsply Sirona
- Vatech Co., Ltd.
- Cefla S.C. (NewTom)
- Asahi Roentgen Ind. Co., Ltd.
- J. Morita Mfg.
- CurveBeam AI
- PreXion Corporation
- Align Technology
- Owandy Radiology
- GENDEX (KaVo Kerr)
- Imaging Sciences International (i-Cat)
- Trident
- Carestream Dental
- Acteon Group
- FONA Dental
- PointNix Co., Ltd.
- LargeV Instrument Corp.
Additional Benefits:
- The market estimate (ME) sheet in Excel format
- 3 months of analyst support
TABLE OF CONTENTS
1 Introduction
- 1.1 Study Assumptions & Market Definition
- 1.2 Scope of the Study
2 Research Methodology
3 Executive Summary
4 Market Landscape
- 4.1 Market Overview
- 4.2 Market Drivers
- 4.2.1 Surging prevalence of orthodontic malocclusions among adults & teens
- 4.2.2 Reimbursement expansion for 3D airway assessment in sleep-disordered breathing
- 4.2.3 AI-enabled image-reconstruction cuts scan time & dose, boosting adoption
- 4.2.4 Proliferation of dental service organizations (DSOs) accelerating CBCT roll-outs
- 4.2.5 Growing ENT & sinus surgery use-cases outside dentistry
- 4.2.6 Rapid price decline of entry-level "mini-FOV" units in emerging markets
- 4.3 Market Restraints
- 4.3.1 High upfront capital cost & limited insurance coverage in many countries
- 4.3.2 Radiation-dose regulations becoming stricter, curbing repeat scans
- 4.3.3 Shortage of CBCT-literate radiologists/dentists in developing regions
- 4.3.4 Flat-panel detector supply-chain constraints due to rare-earth sourcing
- 4.4 Technological Outlook
- 4.5 Regulatory Landscape
- 4.6 Porters Five Forces Analysis
- 4.6.1 Threat of New Entrants
- 4.6.2 Bargaining Power of Buyers
- 4.6.3 Bargaining Power of Suppliers
- 4.6.4 Threat of Substitutes
- 4.6.5 Intensity of Competitive Rivalry
5 Market Size & Growth Forecasts (Value, USD)
- 5.1 By Application
- 5.1.1 Dental Applications
- 5.1.1.1 Orthodontics
- 5.1.1.2 Endodontics
- 5.1.1.3 Periodontics
- 5.1.1.4 General Dentistry
- 5.1.1.5 Dental Implants
- 5.1.1.6 Others
- 5.1.2 Non-dental Applications
- 5.1.1 Dental Applications
- 5.2 By Patient Position
- 5.2.1 Standing/Sitting
- 5.2.2 Seated
- 5.2.3 Supine
- 5.3 By End User
- 5.3.1 Hospitals
- 5.3.2 Dental Clinics
- 5.3.3 Others
- 5.4 By Mobility
- 5.4.1 Stand-alone CBCT Systems
- 5.4.2 Mobile CBCT Systems
- 5.5 By Geography
- 5.5.1 North America
- 5.5.1.1 United States
- 5.5.1.2 Canada
- 5.5.1.3 Mexico
- 5.5.2 Europe
- 5.5.2.1 Germany
- 5.5.2.2 United Kingdom
- 5.5.2.3 France
- 5.5.2.4 Italy
- 5.5.2.5 Spain
- 5.5.2.6 Rest of Europe
- 5.5.3 Asia-Pacific
- 5.5.3.1 China
- 5.5.3.2 Japan
- 5.5.3.3 India
- 5.5.3.4 Australia
- 5.5.3.5 South Korea
- 5.5.3.6 Rest of Asia-Pacific
- 5.5.4 Middle East and Africa
- 5.5.4.1 GCC
- 5.5.4.2 South Africa
- 5.5.4.3 Rest of Middle East and Africa
- 5.5.5 South America
- 5.5.5.1 Brazil
- 5.5.5.2 Argentina
- 5.5.5.3 Rest of South America
- 5.5.1 North America
6 Competitive Landscape
- 6.1 Market Concentration
- 6.2 Market Share Analysis
- 6.3 Company Profiles (includes Global level Overview, Market level overview, Core Segments, Financials as available, Strategic Information, Market Rank/Share for key companies, Products & Services, and Recent Developments)
- 6.3.1 Carestream Health, Inc.
- 6.3.2 Danaher Corporation
- 6.3.3 Planmeca Group
- 6.3.4 Dentsply Sirona
- 6.3.5 Vatech Co., Ltd.
- 6.3.6 Cefla S.C. (NewTom)
- 6.3.7 Asahi Roentgen Ind. Co., Ltd.
- 6.3.8 J. Morita Mfg. Corp.
- 6.3.9 CurveBeam AI
- 6.3.10 PreXion Corporation
- 6.3.11 Align Technology, Inc.
- 6.3.12 Owandy Radiology
- 6.3.13 GENDEX (KaVo Kerr)
- 6.3.14 Imaging Sciences International (i-Cat)
- 6.3.15 Trident S.r.l.
- 6.3.16 Carestream Dental LLC
- 6.3.17 Acteon Group
- 6.3.18 FONA Dental
- 6.3.19 PointNix Co., Ltd.
- 6.3.20 LargeV Instrument Corp.
7 Market Opportunities & Future Outlook
- 7.1 White-space & Unmet-Need Assessment

