
PUBLISHER: Mordor Intelligence | PRODUCT CODE: 1842623

PUBLISHER: Mordor Intelligence | PRODUCT CODE: 1842623
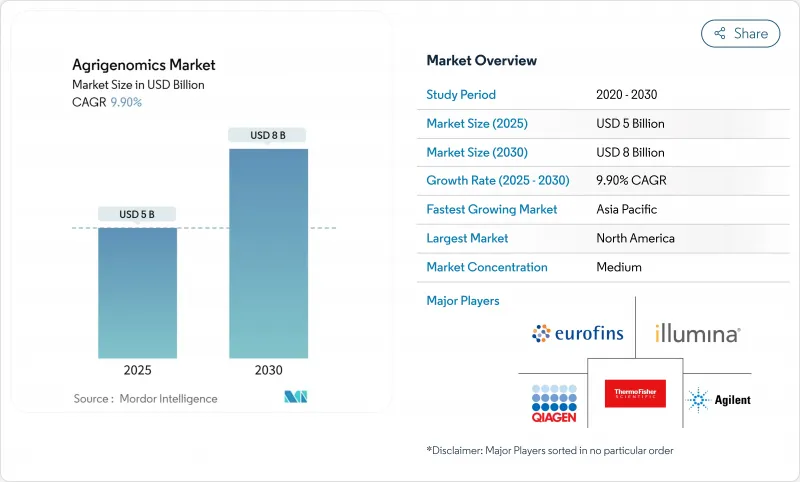
Agrigenomics - Market Share Analysis, Industry Trends & Statistics, Growth Forecasts (2025 - 2030)
The Agrigenomics Market size is estimated at USD 5.0 billion in 2025 and is projected to reach USD 8.0 billion by 2030, at a CAGR of 9.9% during the forecast period.
Cost compression in next-generation sequencing (NGS) has lowered whole-genome sequencing to under USD 600 per genome, opening population-scale projects once reserved for well-funded laboratories. Governments add momentum, like the USDA's AG2PI program alone has directed USD 220 million toward crop and livestock genomics, while China's 2024-2028 plan elevates gene editing for wheat, corn, and soybeans. Real-time PCR maintains broad adoption because of simplicity and cost, but NGS grows faster on the back of large data outputs, multi-omics integration, and AI-driven analytics. North America retains an innovation lead, yet Asia-Pacific now delivers the steepest growth curve as national food-security programs merge with private investment. The competitive intensity remains moderate. Illumina and Thermo Fisher expand coverage through acquisitions such as Thermo Fisher's USD 3.1 billion purchase of Olink to strengthen multi-omics capabilities.
Global Agrigenomics Market Trends and Insights
Falling NGS Costs and Throughput Expansion
Rapid cost declines remain the most powerful accelerant for the agrigenomics market. Whole-genome sequencing has dropped from millions of dollars to roughly USD 500-600 per genome, allowing routine use in crop variety characterization and herd management. Illumina's XLEAP-SBS chemistry boosts reads per flow cell, while Oxford Nanopore's T2T assemblies yield gap-free genomes suited to complex trait mapping. BGI's DNBSEQ-T7 raises daily throughput into the multi-terabase range and supports more than half of global sequencing projects. Capacity gains democratize access for mid-tier breeding programs that previously relied on outsourced genotyping, accelerating data generation and lowering per-sample turnaround time. As sequencing platforms bundle analytics and cloud pipelines, entry barriers continue to fall for cooperatives, universities, and small research stations.
Rising Demand for Climate-Resilient Seed and Livestock Lines
Escalating climate volatility places a premium value on drought, heat, and disease tolerance traits. USDA approval for HB4 drought-tolerant wheat underscores regulatory momentum toward resilient germplasm. India's ICAR introduced genome-edited rice that yields 25% more under stress, illustrating adoption in markets highly exposed to weather risk. Corteva invested USD 25 million in Pairwise to exploit CRISPR editing for abiotic stress traits. The agrigenomics market leverages this priority as seed companies align Research and Development pipelines with climate adaptation, bundling genomics with remote phenotyping to shorten selection cycles.
High Sequencing and Bioinformatics Capex
Even with falling variable costs, high upfront investment in sequencers, compute clusters, and talent slows uptake. Illumina's NovaSeq X requires significant capital outlays alongside recurring reagent commitments. Smaller cooperatives struggle to recruit bioinformaticians, prompting interest in low-pass sequencing strategies that deliver acceptable accuracy at sequencing depths as low as 0.05-fold. Cloud-based "sequencing-as-a-service" mitigates infrastructure costs yet still leaves data-analysis knowledge gaps. Without dedicated grants or public-private consortia, many smallholders postpone genomics investment, constraining agrigenomics market penetration in regions where productivity gains would be highest.
Other drivers and restraints analyzed in the detailed report include:
- Government Genomics Programs in Agri-Innovation Hubs
- AI-Driven Predictive Breeding Platforms
- Fragmented GMO and Gene-Edited Crop Regulations
For complete list of drivers and restraints, kindly check the Table Of Contents.
Segment Analysis
Real-time PCR delivered 38.5% of 2024 revenue and remains the default for targeted assays, yet the segment's share of the agrigenomics market is trending downward as breeders pursue richer variant catalogs. The agrigenomics market size tied to NGS platforms is projected to grow at a 12.4% CAGR, underpinned by investments in high-throughput sequencers, multiplexed barcoding, and single-tube library prep solutions. Constellation mapped-read workflows announced by Illumina promise structural-variant detection without traditional library construction. Oxford Nanopore's ultra-long reads resolve telomere-to-telomere cereal genomes, aiding sub-QTL definition for drought resilience. Microarrays and capillary electrophoresis continue in germplasm banks for identity preservation, but their aggregate demand plateaus as full-genome data become cost-competitive.
NGS adoption accelerates because it couples readily with AI pipelines that demand dense variant matrices. Multi-omics add-ons-proteomics via Olink, methylomes via nanopore direct reading-convert raw sequences into functional insights. Instruments marketed as "pay-per-flowcell" reduce cash burn for mid-volume labs, while reagent rental deals lower barriers for emerging programs. As a result, "sequencing first" becomes standard in new crop improvement programs, and service providers report backlog spillovers into 2026, reinforcing the agrigenomics market's shift from low-plex assays to comprehensive omics profiling.
Crops supplied 64.3% of revenue in 2024, reflecting decades of genomic selection in maize, soybean, and wheat. Still, livestock revenues are climbing at an 11.3% CAGR as producers capture measurable returns from genomic estimated breeding values. The agrigenomics market size for livestock is set to expand sharply once low-pass sequencing and imputation replace array-based genotyping across dairy, swine, and poultry herds. Approved PRRS-resistant pigs illustrate commercial value and regulatory feasibility in food animals.
Low-coverage WGS achieves perfect traceability sensitivity at just 5% genomic depth, making comprehensive variant discovery feasible for regional breeding centers. Long-read platforms uncover more than 10,000 structural variants in bovine genomes, enabling targeted edits that enhance feed efficiency without deleterious pleiotropy. Meanwhile, crop-focused pipelines integrate expression QTL and epigenomic marks to shorten selection cycles. Overall, livestock genomics is shifting from basic parentage testing to predictive selection for welfare, methane reduction, and disease elimination.
The Agrigenomics Market is Segmented by Technology (Real-Time PCR (qPCR), Microarrays, and More), by Sequencer Type (Illumina HiSeq and NovaSeq, and More), by Application (Crops and Livestocks), by Service Offerings (Genotyping, DNA Fingerprinting, Genetic Purity Assessment, and More), and by Geography (North America, Europe, Asia-Pacific, and More). The Market Forecasts are Provided in Terms of Value (USD).
Geography Analysis
North America controlled 42.1% of revenue in 2024, reflecting deep genomics infrastructure, large-scale federal funding, and a regulatory environment that largely aligns with technology deployment. The agrigenomics market benefits from integrated ecosystems connecting USDA labs, land-grant universities, and private breeders. The joint EPA-FDA-USDA framework drafted in 2024 clarified oversight boundaries and added transparency for developers, easing time-to-market. Meanwhile, voluntary carbon-credit protocols reward yield gains and methane reductions enabled by genomic interventions, creating secondary revenue channels.
Asia-Pacific represents the strongest growth engine at an 11.5% CAGR, supported by aggressive national roadmaps in China, India, and Australia. China's 2024-2028 biotech blueprint positions genome editing as a pillar for food security and aims to localize entire toolchains from CRISPR nucleases to high-throughput phenotyping. India's AgriSURE fund and digital crop survey rollout across 400 districts will push remote phenotyping and seed-tracking infrastructure to smallholders, feeding richer datasets into breeding programs. BGI's throughput surpasses 50% of global sequencing capacity, making Shenzhen a global hub for pan-genome consortia in rice, banana, and rapeseed. As regional regulators increasingly differentiate between edits and transgenes, approval pipelines compress, lowering market-entry friction.
Europe posts steady incremental gains despite the EU's stringent GMO regime. National divergence widens the UK's Precision Breeding Act, simplifies approval procedures, whereas continental Europe continues to treat edits as GMOs, prolonging commercialization. South America sees resilient uptake: Brazil's Bioinputs Law fosters biotech integration, and Argentina's early-stage exemption model accelerates product launches. Africa shows latent demand but contends with infrastructure deficits and a chronic bioinformatics talent gap. Multilateral donors and commercial seed firms are piloting cloud-based genomics hubs to bridge the divide, a development likely to pull new participants into the agrigenomics market over the long term.
- Illumina Inc.
- Thermo Fisher Scientific Inc.
- Eurofins Scientific SE
- Agilent Technologies Inc.
- BGI Genomics Co. Ltd.
- QIAGEN N.V.
- Pacific Biosciences of California Inc.
- Tecan Genomics Inc.
- Astorg and Cinven (LGC Limited)
- KeyGene N.V.
- Azenta Life Sciences (Genewiz)
- BASF SE (DNA LandMarks Inc.)
Additional Benefits:
- The market estimate (ME) sheet in Excel format
- 3 months of analyst support
TABLE OF CONTENTS
1 Introduction
- 1.1 Study Assumptions and Market Definition
- 1.2 Scope of the Study
2 Research Methodology
3 Executive Summary
4 Market Landscape
- 4.1 Market Overview
- 4.2 Market Drivers
- 4.2.1 Falling NGS costs and throughput expansion
- 4.2.2 Rising demand for climate-resilient seed and livestock lines
- 4.2.3 Government genomics programs in agri-innovation hubs
- 4.2.4 AI-driven predictive breeding platforms
- 4.2.5 Commercialization of low-pass WGS for livestock
- 4.2.6 Carbon-credit valuation of genomics-enabled yield gains
- 4.3 Market Restraints
- 4.3.1 High sequencing and bioinformatics capex
- 4.3.2 Fragmented GMO and gene-edited crop regulations
- 4.3.3 Bioinformatics skill shortages in emerging regions
- 4.3.4 Data-sovereignty limits on cross-border genomic datasets
- 4.4 Regulatory Landscape
- 4.5 Technological Outlook
- 4.6 Porters Five Forces Analysis
- 4.6.1 Bargaining Power of Suppliers
- 4.6.2 Bargaining Power of Buyers
- 4.6.3 Threat of Substitutes
- 4.6.4 Threat of New Entrants
- 4.6.5 Intensity of competitive rivalry
5 Market Size and Growth Forecasts (Value)
- 5.1 By Technology
- 5.1.1 Real-Time PCR (qPCR)
- 5.1.2 Microarrays
- 5.1.3 Next-Generation Sequencing (NGS)
- 5.1.4 Capillary Electrophoresis
- 5.1.5 Other Technologies (CRISPR-based assays, Digital PCR, etc.)
- 5.2 By Sequencer Type
- 5.2.1 Illumina HiSeq and NovaSeq
- 5.2.2 PacBio and Oxford Nanopore
- 5.2.3 Sanger Sequencers
- 5.2.4 SOLiD
- 5.2.5 Others (Ion Proton, GeneMind GenoLab M, etc.)
- 5.3 By Application
- 5.3.1 Crops
- 5.3.2 Livestock
- 5.4 By Service Offering
- 5.4.1 Genotyping
- 5.4.2 DNA Fingerprinting
- 5.4.3 Genetic Purity Assessment
- 5.4.4 Trait Purity Assessment
- 5.4.5 Gene Expression Analysis
- 5.5 By Geography
- 5.5.1 North America
- 5.5.1.1 United States
- 5.5.1.2 Canada
- 5.5.1.3 Mexico
- 5.5.1.4 Rest of North America
- 5.5.2 South America
- 5.5.2.1 Brazil
- 5.5.2.2 Argentina
- 5.5.2.3 Chile
- 5.5.2.4 Rest of South America
- 5.5.3 Europe
- 5.5.3.1 Germany
- 5.5.3.2 United Kingdom
- 5.5.3.3 France
- 5.5.3.4 Italy
- 5.5.3.5 Spain
- 5.5.3.6 Netherlands
- 5.5.3.7 Rest of Europe
- 5.5.4 Asia-Pacific
- 5.5.4.1 China
- 5.5.4.2 Japan
- 5.5.4.3 India
- 5.5.4.4 Australia
- 5.5.4.5 New Zealand
- 5.5.4.6 Rest of Asia-Pacific
- 5.5.5 Middle East
- 5.5.5.1 Turkey
- 5.5.5.2 Saudi Arabia
- 5.5.5.3 United Arab Emirates
- 5.5.5.4 Rest of Middle East
- 5.5.6 Africa
- 5.5.6.1 South Africa
- 5.5.6.2 Egypt
- 5.5.6.3 Kenya
- 5.5.6.4 Rest of Africa
- 5.5.1 North America
6 Competitive Landscape
- 6.1 Market Concentration
- 6.2 Strategic Moves
- 6.3 Market Share Analysis
- 6.4 Company Profiles (includes Global level Overview, Market level overview, Core Segments, Financials as available, Strategic Information, Market Rank/Share for key companies, Products and Services, and Recent Developments)
- 6.4.1 Illumina Inc.
- 6.4.2 Thermo Fisher Scientific Inc.
- 6.4.3 Eurofins Scientific SE
- 6.4.4 Agilent Technologies Inc.
- 6.4.5 BGI Genomics Co. Ltd.
- 6.4.6 QIAGEN N.V.
- 6.4.7 Pacific Biosciences of California Inc.
- 6.4.8 Tecan Genomics Inc.
- 6.4.9 Astorg and Cinven (LGC Limited)
- 6.4.10 KeyGene N.V.
- 6.4.11 Azenta Life Sciences (Genewiz)
- 6.4.12 BASF SE (DNA LandMarks Inc.)
7 Market Opportunities and Future Outlook

