
PUBLISHER: Mordor Intelligence | PRODUCT CODE: 1842631

PUBLISHER: Mordor Intelligence | PRODUCT CODE: 1842631
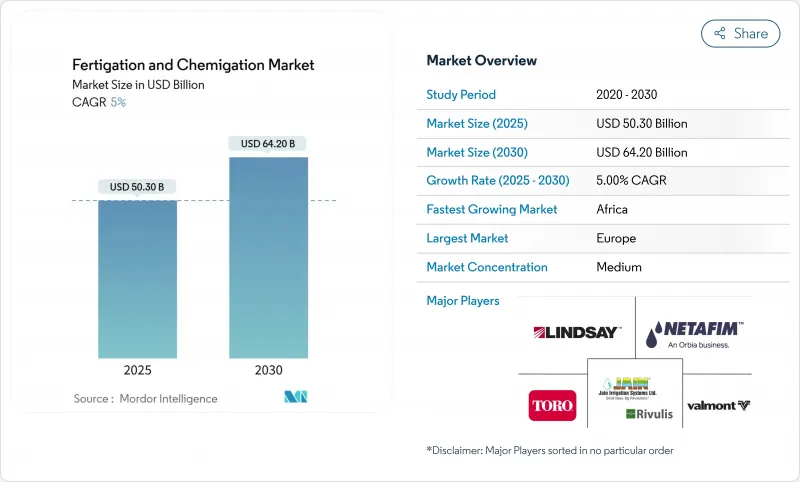
Fertigation And Chemigation - Market Share Analysis, Industry Trends & Statistics, Growth Forecasts (2025 - 2030)
The fertigation and chemigation market reached USD 50.3 billion in 2025 and is projected to grow at a CAGR of 5.0%, reaching USD 64.2 billion by 2030.
This growth is driven by increasing water scarcity concerns, rising fertilizer costs emphasizing efficiency needs, and the integration of IoT and AI technologies in nutrient delivery systems. These factors are transforming farm management practices, reducing operational waste, and improving adaptability to climate change. Companies are investing in research and development of water-soluble formulations, cloud-based control systems, and sensor technologies that monitor moisture, salinity, and nutrient levels in real-time. Governments across developed and developing nations are expanding micro-irrigation subsidies, facilitating equipment upgrades, and supporting domestic innovation. Input manufacturers are integrating software solutions, agronomic services, and maintenance support to enhance customer retention and value.
Global Fertigation And Chemigation Market Trends and Insights
Rising Demand for Food Security and Yield Maximization
The global demand for calories is increasing faster than the availability of arable land, requiring farmers to maximize output per unit of water, nutrients, and labor. Fertigation, which delivers nutrients directly to plant root zones, increases crop yields by 15-35% in high-value crops by synchronizing nitrogen, phosphorus, and potassium delivery with plant developmental stages. Commercial orchards and vegetable farms report up to 30% improvement in fertilizer use efficiency, reducing costs during periods of volatile input prices while decreasing nutrient run-off. Fertigation, when integrated with climate-smart farming practices, enables farms to implement data-driven, continuous nutrition programs instead of periodic bulk fertilizer applications.
Government Subsidies and Micro-Irrigation Incentives
Government policies support agricultural technology adoption through grants, tax credits, and subsidized loans. The USDA's 2025 budget allocates USD 10.5 billion to the Natural Resources Conservation Service, focusing on precision water management systems.Similar programs in India and China provide reimbursements of up to 55% for low-pressure drip irrigation equipment, encouraging adoption among small and medium-scale farmers. These initiatives have fostered the development of supporting services, including agronomic consulting, sensor production, and software-based irrigation management.
High Capital and O&M Costs
Drip fertigation systems with advanced features require significant infrastructure, including pressure-regulated mainlines, dual filtration, backflow prevention, and programmable controllers. These requirements increase initial costs beyond what many smallholder farmers can afford. Economic analyses indicate that variable-rate fertigation systems have payback periods of over 27 years for commodity crops, while fixed-rate pivot systems achieve payback in 10 years. The financial barriers are particularly challenging in low-income regions with small farm sizes and limited credit access. The ongoing maintenance costs, including system flushing, acid treatment, and sensor calibration, create additional financial pressure, which reduces system upgrades and new purchases.
Other drivers and restraints analyzed in the detailed report include:
- Rapid Adoption of Water-Soluble Specialty Fertilizers
- Growing Water Scarcity Heightens Efficient Nutrient Delivery
- Less Technical Knowledge Among Farmers
For complete list of drivers and restraints, kindly check the Table Of Contents.
Segment Analysis
The fertigation and chemigation market is dominated by fertilizers, which accounted for 46.0% of revenue share in 2024. This dominance is primarily due to water-soluble NPK formulations that offer rapid dissolution and minimal line precipitation. Major manufacturers are developing chelated micronutrient blends to address nutrient deficiencies in intensive horticultural operations.
Biostimulants and micronutrients are emerging as significant growth drivers, with projections indicating a 10.2% CAGR from 2025-2030. This growth is driven by farmers seeking consistent yields during unpredictable weather conditions. Research indicates that plant-based extracts and microbial consortia improve nutrient-use efficiency by 30% compared to conventional fertilizer applications, leading major lettuce and berry producers to implement these solutions across their operations. New liquid inoculants designed for low-pressure drip systems enhance soil-microbe interactions without emitter blockage.
Insecticides and fungicides maintain moderate growth rates, as fertigation systems enable uniform distribution throughout dense crop canopies, reducing overall chemical usage while maintaining effective pest control levels. The herbicide segment, though smaller due to application limitations, shows gradual growth in managing glyphosate-resistant weed populations.
Fruits and vegetables maintain the largest market share at 38.0% in 2024, driven by their high nutrient timing requirements that fertigation effectively addresses. Drip line fertigation systems demonstrate yield increases of 15-35% in vine crops, strawberries, and leafy greens, particularly in peri-urban areas where high land costs necessitate increased productivity. Cereal and grain producers are transitioning from pilot programs to commercial implementation, with maize and wheat farmers adopting low-pressure systems within crop rotation schedules. The technology also shows increasing adoption in oil crops and pulses, especially in water-scarce regions where split nitrogen applications reduce nutrient loss through volatilization.
Plantation crops, including tea, coffee, cocoa, coconut, and rubber, exhibit unique fertigation adoption patterns. While currently holding a smaller market share, the fertigation and chemigation market for plantation crops is projected to grow at an 8.0% CAGR from 2025-2030. These crops benefit significantly from low-volume, high-frequency nutrient delivery due to their long production cycles and perennial root systems, particularly during extended dry periods. Growers report improved leaf development and bean quality uniformity after implementing drip fertigation, which reduces nutrient leaching in high-rainfall areas. The extended lifespan of plantation crops supports the initial capital investment, as the revenue benefits accumulate over multiple years, improving the overall return on investment.
The Fertigation and Chemigation Market is Segmented by Input Type (Fertilizers, Insecticides, and More), by Crop Type (Grains and Cereals, and More), by Application (Open-Field Agriculture, and More), by Irrigation Type (Drip Irrigation, and More), and by Geography (North America and More). The Market Forecasts are Provided in Terms of Value (USD).
Geography Analysis
Europe holds a 34.0% share of the fertigation and chemigation market revenue in 2024. Growers of olives, vineyards, and greenhouse vegetables have implemented sensor-based fertigation systems to meet EU nitrate-directive requirements while improving yield consistency and product quality. The Common Agricultural Policy provides government grants and low-interest loans that support the adoption of advanced systems incorporating soil-moisture sensors, automated filtration, and digital monitoring platforms, reducing return-on-investment periods despite increasing labor costs. The extensive greenhouse facilities in the Netherlands, Spain, and Italy drive technology adoption, as controlled environments maximize the effectiveness of precise nutrient application and pH management. The market growth is supported by an established service network, where agricultural input suppliers collaborate with technology companies to deliver complete solution packages, from design through maintenance, targeting medium-sized farming cooperatives that require regulatory compliance without expanding their technical staff.
North America holds the second-largest market share by value, supported by widespread digital technology adoption and established technical support networks. Regional revenue is anticipated to grow from USD 263.82 million in 2023 to USD 433.74 million by 2030, driven by Midwestern farmers responding to fertilizer price fluctuations. Research indicates 78.6% of corn and soybean farmers prioritize fertilizer efficiency, increasing the implementation of variable-rate pivot fertigation. Federal conservation funding and strict runoff regulations strengthen the implementation rationale.
Africa demonstrates the highest growth potential with a 9.4% CAGR from 2025-2030. The Africa Fertilizer and Soil Health Summit and regional smart-irrigation initiatives highlight fertigation's water conservation and nutritional advantages. Implementation varies significantly-24% of farms in South Africa's Vhembe district utilize climate-smart irrigation, compared to 68% in Capricorn. SMS-based and low-bandwidth digital extension services help address knowledge gaps. Precision-fertilization programs in Kenya and Tanzania demonstrate regional interest in mobile applications for nutrient management guidance.
- Netafim Limited (An Orbia Business)
- Jain Irrigation Systems Limited (Rivulis Irrigation Ltd.)
- Lindsay Corporation
- Valmont Industries, Inc.
- The Toro Company
- Rain Bird Corporation
- Automat Industries Private Limited
- Mahindra EPC Irrigation Limited
- Hunter Industries Inc.
- Irritec S.p.A
Additional Benefits:
- The market estimate (ME) sheet in Excel format
- 3 months of analyst support
TABLE OF CONTENTS
1 Introduction
- 1.1 Study Assumptions and Market Definition
- 1.2 Scope of the Study
2 Research Methodology
3 Executive Summary
4 Market Landscape
- 4.1 Market Overview
- 4.2 Market Drivers
- 4.2.1 Rising Demand for Food Security and Yield Maximization
- 4.2.2 Government Subsidies and Micro-Irrigation Incentives
- 4.2.3 Growing Water Scarcity Heightens Efficient Nutrient Delivery
- 4.2.4 Rapid Adoption of Water-Soluble Specialty Fertilizers
- 4.2.5 IoT-enabled variable-rate fertigation systems
- 4.2.6 Labor and Cost Efficiency
- 4.3 Market Restraints
- 4.3.1 High Capital and O&M Costs
- 4.3.2 Less Technical Knowledge Among Farmers
- 4.3.3 Emitter Clogging from Precipitates and Biofilms
- 4.3.4 Increasing Regulatory Scrutiny on Nutrient Leaching
- 4.4 Regulatory Landscape
- 4.5 Technological Outlook
- 4.6 Porter's Five Forces Analysis
- 4.6.1 Threat of New Entrants
- 4.6.2 Bargaining Power of Buyers
- 4.6.3 Bargaining Power of Suppliers
- 4.6.4 Threat of Substitute Products
- 4.6.5 Intensity of Competitive Rivalry
5 Market Size and Growth Forecasts (Value)
- 5.1 By Input Type
- 5.1.1 Fertilizers
- 5.1.2 Insecticides
- 5.1.3 Fungicides
- 5.1.4 Herbicides
- 5.1.5 Biostimulants and Micronutrients
- 5.1.6 Other Input Types
- 5.2 By Crop Type
- 5.2.1 Cereals and Grains
- 5.2.2 Oilseeds and Pulses
- 5.2.3 Fruits and Vegetables
- 5.2.4 Plantation Crops
- 5.2.5 Turf and Ornamentals
- 5.2.6 Other Crop Types
- 5.3 By Application
- 5.3.1 Open-Field Agriculture
- 5.3.2 Greenhouse and Hydroponics
- 5.3.3 Nursery and Landscaping
- 5.3.4 Urban Vertical Farming
- 5.3.5 Other Applications
- 5.4 By Irrigation Type
- 5.4.1 Drip Irrigation
- 5.4.2 Sprinkler Irrigation
- 5.4.3 Other Irrigation Types
- 5.5 By Geography
- 5.5.1 North America
- 5.5.1.1 United States
- 5.5.1.2 Canada
- 5.5.1.3 Mexico
- 5.5.1.4 Rest of North America
- 5.5.2 Europe
- 5.5.2.1 Germany
- 5.5.2.2 United Kingdom
- 5.5.2.3 France
- 5.5.2.4 Italy
- 5.5.2.5 Spain
- 5.5.2.6 Russia
- 5.5.2.7 Rest of Europe
- 5.5.3 Asia-Pacific
- 5.5.3.1 China
- 5.5.3.2 India
- 5.5.3.3 Japan
- 5.5.3.4 Australia
- 5.5.3.5 South Korea
- 5.5.3.6 Rest of Asia-Pacific
- 5.5.4 South America
- 5.5.4.1 Brazil
- 5.5.4.2 Argentina
- 5.5.4.3 Rest of South America
- 5.5.5 Middle East and Africa
- 5.5.5.1 Turkey
- 5.5.5.2 Saudi Arabia
- 5.5.5.3 United Arab Emirates
- 5.5.5.4 South Africa
- 5.5.5.5 Egypt
- 5.5.5.6 Kenya
- 5.5.5.7 Rest of Middle East and Africa
- 5.5.1 North America
6 Competitive Landscape
- 6.1 Market Concentration
- 6.2 Strategic Moves
- 6.3 Market Share Analysis
- 6.4 Company Profiles (includes Global level Overview, Market level overview, Core Segments, Financials as available, Strategic Information, Market Rank/Share for key companies, Products and Services, and Recent Developments)
- 6.4.1 Netafim Limited (An Orbia Business)
- 6.4.2 Jain Irrigation Systems Limited (Rivulis Irrigation Ltd.)
- 6.4.3 Lindsay Corporation
- 6.4.4 Valmont Industries, Inc.
- 6.4.5 The Toro Company
- 6.4.6 Rain Bird Corporation
- 6.4.7 Automat Industries Private Limited
- 6.4.8 Mahindra EPC Irrigation Limited
- 6.4.9 Hunter Industries Inc.
- 6.4.10 Irritec S.p.A
7 Market Opportunities and Future Outlook

