
PUBLISHER: Mordor Intelligence | PRODUCT CODE: 1842665

PUBLISHER: Mordor Intelligence | PRODUCT CODE: 1842665
CINV Treatment - Market Share Analysis, Industry Trends & Statistics, Growth Forecasts (2025 - 2030)
The CINV Treatment Market size is estimated at USD 5.38 billion in 2025, and is expected to reach USD 7.15 billion by 2030, at a CAGR of 5.87% during the forecast period (2025-2030).
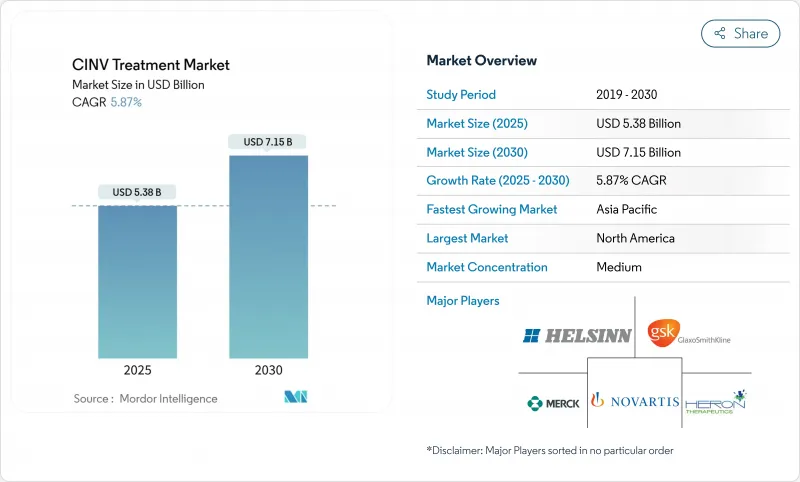
Sustained demand arises from expanding cancer prevalence, wider use of highly-emetogenic chemotherapy, and the steady migration of care toward outpatient and home-based settings. Oral and extended-release formulations gain traction because they fit decentralized care pathways and improve adherence, a shift that tempers the historical dominance of injectables. Patent expiries for key brands place near-term pressure on prices, yet they also open space for differentiated products that emphasize convenience, fixed-dose combinations, and personalized dosing. Asia-Pacific's regulatory harmonization and rising oncology caseload drive the fastest regional growth, while North America leverages reimbursement depth and clinical trial infrastructure to remain the largest contributor to CINV treatment market revenue.
Global CINV Treatment Market Trends and Insights
Increasing Prevalence of Cancer
Breakthrough oncology drugs cleared by the FDA in 2024 widened the treated patient pool, intensifying demand for supportive care antiemetics. Longer survival times among older populations further lengthen exposure to chemotherapy and related nausea risks, ensuring that antiemetic use scales alongside oncology advances. The demographic shift toward aging populations in developed markets compounds this trend, as older patients typically require more aggressive chemotherapy protocols with higher emetogenic potential. Additionally, improved cancer screening programs detect malignancies at earlier stages, leading to longer treatment durations and cumulative antiemetic exposure per patient.
Adoption of Highly-Emetogenic Chemotherapy Regimens
Clinical protocols incorporating anthracycline-based or platinum-dense regimens hinge on robust antiemetic prophylaxis, steering prescribers toward premium NK1 antagonists. A study showed 94.7% complete response when olanzapine, palonosetron, and fosaprepitant were combined for high-risk patients.The trend accelerates as precision oncology identifies patient subgroups requiring intensified treatment approaches, creating sustained demand for advanced antiemetic solutions. Furthermore, the integration of immunotherapy with traditional chemotherapy creates novel emetogenic profiles that require specialized management strategies.
Patent Expiries Driving Price Erosion
Loss of exclusivity for brands such as Sancuso intensifies generic entry, compressing average selling prices and challenging R&D reinvestment models for incumbents, particularly in regions where payers prioritize least-cost alternatives. Companies respond through defensive strategies including authorized generics, value-based contracting, and lifecycle management initiatives, but these approaches typically delay rather than prevent revenue erosion. The pricing pressure intensifies in emerging markets where healthcare systems prioritize cost-effectiveness over brand preference, accelerating generic adoption rates.
Other drivers and restraints analyzed in the detailed report include:
- Guideline-Driven Uptake of Triple Antiemetic Therapy
- Fixed-Dose Combos & Extended-Release Formulations
- Side-Effect Profile Limiting Adherence
For complete list of drivers and restraints, kindly check the Table Of Contents.
Segment Analysis
5-HT3 receptor antagonists retained a 44.87% CINV treatment market share in 2024, a position built on long-standing clinical familiarity. Yet the segment grows modestly as clinicians increasingly adopt NK1 agents for delayed-phase protection. The CINV treatment market size tied to NK1 antagonists is on track to rise at 6.71% CAGR thanks to guideline endorsements and new once-daily formulations. Robust clinical evidence underpins NK1 uptake, and brands such as CINVANTI extend protection through 2035 patents, giving innovators pricing latitude.
Complementary roles for dopamine antagonists and corticosteroids persist, while cannabinoids remain a niche option for refractory cases. Evidence supporting olanzapine's multi-receptor blockade is altering rescue therapy preferences, especially for breakthrough nausea where single-mechanism drugs show gaps. As combination regimens become standard, manufacturers that integrate NK1 components with 5-HT3 or corticosteroids in a single capsule or infusion capture workflow efficiencies that resonate with oncology clinics.
The CINV Treatment Market Report is Segmented by Drug Class (5-HT3 Receptor Antagonists, NK1 Receptor Antagonists, Dopamine Antagonists, Cannabinoid Antagonists, and More), Formulation (Oral, Injectable, Transdermal, Sublingual), End User (Hospitals, Oncology & Specialty Clinics, Homecare Settings & ASCs), and Geography (North America, Europe, Asia-Pacific, and More). The Market Forecasts are Provided in Terms of Value (USD).
Geography Analysis
North America generated 37.74% of global revenue in 2024 owing to established clinical guideline enforcement, rapid FDA approvals, and extensive insurance coverage for supportive oncology drugs. The region's clinicians readily adopt extended-release innovations despite higher acquisition costs when data show reduced rescue medication use. Patent expiries are expected to temper annual price growth, but volume expansion from rising cancer incidence and broader use of immuno-chemotherapy combinations sustains overall market value. Value-based care models are nudging hospital systems toward longer-acting antiemetics that cut infusion chair occupancy and readmissions.
Asia-Pacific is projected to grow at 7.08% CAGR through 2030 as China, India, and Southeast Asian countries expand oncology infrastructure and harmonize regulatory pathways. China's National Medical Products Administration cleared 228 NDAs in 2024, 37% for antineoplastic agents, catalyzing supportive-care demand. Domestic manufacturers introduce cost-competitive NK1 generics, while multinational firms leverage accelerated pathways to launch fixed-dose combos. Pharmacovigilance capacity is rising, making data-driven formulary inclusion more feasible across public hospitals.
Europe maintains consistent demand anchored by harmonized EMA approvals and robust health technology assessments that balance innovation with cost containment. National reimbursement boards emphasize real-world effectiveness data, favoring products that document reduced rescue therapy and hospital re-visits. Emerging regions in MEA and South America remain nascent contributors yet represent strategic expansions for companies willing to localize production and navigate fragmented regulatory landscapes.
- Merck
- GlaxoSmithKline
- Heron Therapeutics
- Helsinn Group
- Novartis
- Pfizer
- Johnson & Johnson
- Baxter
- Teva Pharmaceutical Industries
- Sun Pharma Industries Ltd.
- Roche
- Dr Reddy's Laboratories
- Cipla
- Eisai
- Accord Healthcare
- Mundipharma Intl.
- Tesaro (Biotech)
- Fresenius
- Lupin
- Orchid Healthcare
Additional Benefits:
- The market estimate (ME) sheet in Excel format
- 3 months of analyst support
TABLE OF CONTENTS
1 Introduction
- 1.1 Study Assumptions & Market Definition
- 1.2 Scope of the Study
2 Research Methodology
3 Executive Summary
4 Market Landscape
- 4.1 Market Overview
- 4.2 Market Drivers
- 4.2.1 Increasing Prevalence of Cancer
- 4.2.2 Adoption of Highly-Emetogenic Chemotherapy Regimens
- 4.2.3 Guideline-Driven Uptake of Triple Antiemetic Therapy
- 4.2.4 Fixed-Dose Combos & Extended-Release Formulations
- 4.2.5 Expansion of Oral Oncolytics Fueling Oral Antiemetic Use
- 4.2.6 Pharmacogenomics-Based Personalization of Therapy
- 4.3 Market Restraints
- 4.3.1 Patent Expiries Driving Price Erosion
- 4.3.2 Side-Effect Profile Limiting Adherence
- 4.3.3 Oncologist Under-Estimation of Emetogenic Risk
- 4.3.4 Restricted Reimbursement of Novel Combos in EMs
- 4.4 Regulatory Landscape
- 4.5 Porter's Five Forces Analysis
- 4.5.1 Threat of New Entrants
- 4.5.2 Bargaining Power of Buyers
- 4.5.3 Bargaining Power of Suppliers
- 4.5.4 Threat of Substitutes
- 4.5.5 Competitive Rivalry
5 Market Size & Growth Forecasts (Value in USD)
- 5.1 By Drug Class
- 5.1.1 5-HT3 Receptor Antagonists
- 5.1.2 NK1 Receptor Antagonists
- 5.1.3 Dopamine Antagonists
- 5.1.4 Cannabinoid Antagonists
- 5.1.5 Corticosteroids
- 5.1.6 Other Classes (Benzodiazepines, Antihistamines)
- 5.2 By Formulation
- 5.2.1 Oral
- 5.2.2 Injectable
- 5.2.3 Transdermal
- 5.2.4 Sublingual
- 5.3 By End User
- 5.3.1 Hospitals
- 5.3.2 Oncology & Specialty Clinics
- 5.3.3 Homecare Settings & ASCs
- 5.4 By Geography
- 5.4.1 North America
- 5.4.1.1 United States
- 5.4.1.2 Canada
- 5.4.1.3 Mexico
- 5.4.2 Europe
- 5.4.2.1 Germany
- 5.4.2.2 United Kingdom
- 5.4.2.3 France
- 5.4.2.4 Italy
- 5.4.2.5 Spain
- 5.4.2.6 Rest of Europe
- 5.4.3 Asia-Pacific
- 5.4.3.1 China
- 5.4.3.2 Japan
- 5.4.3.3 India
- 5.4.3.4 Australia
- 5.4.3.5 South Korea
- 5.4.3.6 Rest of Asia-Pacific
- 5.4.4 Middle East & Africa
- 5.4.4.1 GCC
- 5.4.4.2 South Africa
- 5.4.4.3 Rest of Middle East & Africa
- 5.4.5 South America
- 5.4.5.1 Brazil
- 5.4.5.2 Argentina
- 5.4.5.3 Rest of South America
- 5.4.1 North America
6 Competitive Landscape
- 6.1 Market Concentration
- 6.2 Market Share Analysis
- 6.3 Company Profiles (includes Global level Overview, Market level overview, Core Segments, Financials as available, Strategic Information, Market Rank/Share for key companies, Products & Services, and Recent Developments)
- 6.3.1 Merck & Co., Inc.
- 6.3.2 GlaxoSmithKline plc
- 6.3.3 Heron Therapeutics, Inc.
- 6.3.4 Helsinn Group
- 6.3.5 Novartis AG
- 6.3.6 Pfizer Inc.
- 6.3.7 Johnson & Johnson (Janssen)
- 6.3.8 Baxter International Inc.
- 6.3.9 Teva Pharmaceutical Industries Ltd.
- 6.3.10 Sun Pharma Industries Ltd.
- 6.3.11 Roche Holding AG
- 6.3.12 Dr Reddy's Laboratories
- 6.3.13 Cipla Ltd.
- 6.3.14 Eisai Co., Ltd.
- 6.3.15 Accord Healthcare
- 6.3.16 Mundipharma Intl.
- 6.3.17 Tesaro (Biotech)
- 6.3.18 Fresenius Kabi
- 6.3.19 Lupin Ltd.
- 6.3.20 Orchid Healthcare
7 Market Opportunities & Future Outlook
- 7.1 White-space & Unmet-need Assessment

